

Abstract
Objective
To determine the accuracy of self-reported healthcare utilization and absence reported on health risk assessments (HRAs) against administrative claims and human resource records.
Methods
Self-reported values of healthcare utilization and absenteeism were analyzed for concordance to administrative claims values. Percent agreement, Pearson’s correlations, and multivariate logistic regression models examined the level of agreement and characteristics of participants with concordance.
Results
Self-report and administrative data showed greater concordance for monthly compared to yearly healthcare utilization metrics. Percent agreement ranged from 30 to 99% with annual doctor visits having the lowest percent agreement. Younger people, males, those with higher education, and healthier individuals more accurately reported their healthcare utilization and absenteeism.
Conclusions
Self-reported healthcare utilization and absenteeism may be used as a proxy when medical claims and administrative data are unavailable, particularly for shorter recall periods.
Keywords: self-report, administrative data, healthcare utilization, absenteeism
Introduction
Self-report is one of the most widely used methods of collecting information regarding individuals’ health status and utilization of healthcare services.(1) Self-report has been used to assess an extensive range of health behaviors when estimating the prevalence of health risk factors, use of preventive care, and use of mental healthcare services.(2–5) Healthcare practitioners and researchers often rely upon self-reported measures to estimate utilization of healthcare services, absenteeism, and worker productivity. Typically collected through the administration of a health risk assessment (HRA) questionnaire, self-reported measures can be useful when actual administrative data, such as medical claims and work absence records, are unavailable or are too time-consuming or expensive to analyze. Despite widespread use, there is little consensus on the accuracy and validity of self-reported healthcare utilization and absenteeism data.(1, 6–8)
High levels of agreement have been found between self-report and employer administrative sickness/absenteeism data (9, 10), while other studies have demonstrated that self-reported absenteeism underestimates hours and days missed and overestimates the number of hours worked compared to employer payroll records among workers. (11) Insurer administrative claims records have been found to consistently underestimate the number and duration of absences due to work-related injury or illness compared to self-report. (6, 12, 13)
The use of preventive healthcare services based on self-report tends to be higher than rates calculated through analysis of insurance claims data.(14, 15) Self-reported utilization of digital rectal exams, fecal occult blood tests, mammogram screenings, and Pap tests have also been shown to be higher compared to medical record audits.(16) In terms of mental health services use, patients with higher levels of mental distress or depression self-reported higher rates of service use compared to data culled from administrative records.(17, 18) However, administrative claims data may not always capture a person’s complete healthcare utilization experience where there is no actual payment for the service.(19) This might occur when services are provided free of charge at a public health clinic, a workplace medical center, a health fair, or under the auspices of a health maintenance organization (HMO) or other capitated health plan.
When evaluating healthcare utilization, situational factors may affect the accuracy of self-reported utilization of medical services. Situational factors include type of utilization (type of service sought, for example, ER or office visit), time frame (time required for recall, for example, three months compared to one year), utilization frequency (typical number of visits or the frequency of the event), mode of data collection (surveys, in-person interviews, internet surveys) and questionnaire design (location, structure and wording of items in a questionnaire).(1)
Recall timeframe may affect the accuracy of self-reported healthcare utilization and administrative data in many ways. Telescoping occurs when an individual lengthens the recall period beyond the timeframe in question. For example, an individual may be asked to recall the number of ER visits in the past year (12 months), and the individual inadvertently recalls visits for 14 months (2 months beyond the period in question). Reverse telescoping occurs when individual shortens the recall period. An individual may be asked to recall the number of physician visits in the past month, and the individual inadvertently recalls visits for 3 weeks (approximately 1 week shorter than the period in question). Memory decay often results in the under-reporting of visits due to a failure to remember visits to a healthcare provider. The longer the recall period, the less accurate individuals are in reporting use of healthcare services, with under-reporting more substantial than over-reporting over a 12-month recall time frame.(1) For example, the length of time from the date of a screening was found to decrease the accuracy of the event for Pap smear and mammography screenings.(20–22) A similar pattern is observed with absenteeism data. As the recall period increases, the discrepancy between insurer or employer payroll records and self-reported absence increases.(11, 13)
As the number of healthcare visits increases, under-reporting of utilization due to memory decay is more likely to occur.(23–26). Inpatient hospital admission and ER visits, which tend to be rare and highly memorable events, are more likely to be reported accurately over longer recall periods compared to physician visits that are more commonplace.(24, 27) The optimal recall period for self-reported surveys of fairly routine doctor visits is thought to be six months or less, but longer - up to 12 months - for rarely used healthcare services.(1, 23)
Demographic factors affecting self-report may include respondents’ age, health status, gender, education, and ethnicity.(1) A number of studies have found no consistent relationship between demographic factors, such as education, gender, health status, socioeconomic status, and self-report accuracy.(23, 28–30) Older age is the only demographic factor that has been found to be significantly associated with inaccuracy and under-reporting of healthcare utilization.(24–26, 31) Overall, education level and gender were found to have little influence over the accuracy of recall related to self-reported health risk status.(20)
Previous studies examining health status-related predictors of the relationship between self-reported and objective measurements are of interest as well. Muhajarine et al. (32) showed that individuals classified as diabetic or obese were less likely to demonstrate agreement between self-reported hypertension and physician-diagnosed hypertension (based on claims data) compared to non-diabetic or non-obese subjects, respectively.
Other studies, however, have not found that self-reported health status influences agreement between self-reported and objective measurements of health. For example, Beckles et al. (15) found no relationship between patients’ health status and self-reported eye exams for adults with diabetes. Except for postnatal depression, Petrou et al. (27) found that health status was not significantly associated with the likelihood of accurately reporting healthcare utilization among women.
With this literature as background, we sought to assess the validity of self-reported healthcare utilization and absenteeism for a working adult population: employees at The Dow Chemical Company (Dow). As shown above, previous studies have primarily focused on clinical outcomes and predictors of accurate self-report for specific medical procedures or diagnoses. The objectives of this study were to investigate the concordance between 1) self-reported healthcare utilization and medical claims data and 2) self-reported absenteeism and administrative absence data. Assessing the accuracy of self-reports would help employers, researchers, and policy makers determine the validity of financial estimates related to healthcare utilization and absenteeism.
To conduct our research, we linked employee-level data from HRA questionnaires administered to Dow employees with their medical claims and absenteeism records. We then assessed the accuracy of self-report by determining the extent to which self-report and administrative data were in perfect agreement, under-reported, and over-reported. Our results span data from a two-year period, providing us with the opportunity to generalize the findings across years. We were also interested in establishing the employee characteristics that predicted accurate self-reports.
Methods
Subjects
This study is part of a larger multi-year, multi-site research initiative funded by the National Heart, Lung, and Blood Institute (NHLBI) examining the impacts of environmental approaches to prevent or manage obesity among working adults.(33, 34) Subjects in this study were chosen based on their participation in the LightenUP weight management program at Dow. Subjects were employees who completed an HRA for the LightenUP program in either 2006, 2007, or both years and for whom healthcare utilization claims data were available from their insurance carrier or absenteeism records were available from Dow’s human resources database. These data were aggregated, checked for quality, and placed in an integrated health and productivity management (HPM) database for Dow for the period of 2005 to 2007.
Research Design
We conducted a cross-sectional analysis of the database by comparing participants’ self-reported healthcare utilization and absenteeism to their recorded administrative medical and absenteeism records. We calculated concordance by examining the percent agreement between self-report and administrative data and applied logistic regression analysis to illustrate the predictors of agreement. In the HRA administered to Dow employees, subjects were asked to recall the number of doctor visits, ER visits, and hospital admissions over a previous specified time period. Similarly, they were asked to recall the number of days absent in the prior year due to illness or injury.
“Perfect agreement” was defined as accurately reporting the exact same number of doctor visits, ER visits, hospitalizations, and days absent as calculated through analysis of their insurance claims or human resources records. Also reported were the percent of employees who over- or under-reported healthcare utilization or absenteeism when their self-report did not match exactly the data culled from the administrative systems.
Data Sources
HRAs were distributed to study subjects from January to March in 2006 and 2007. Administrative claims data were obtained from the healthcare utilization and absenteeism data for Dow maintained by Thomson Reuters. Administrative absenteeism records were derived from Dow’s time reporting system, where employees self-report their absence from work (on a weekly or bi-weekly basis) rather than from a time-based system such as “punching in” to work each day.
Sample
To be included in the sample, Dow employees must have completed an HRA in either 2006 or 2007 and have been eligible for health and absenteeism benefits during the same year in which they completed the HRA. Participant data were linked so that each record in the dataset contained a person’s self-reported and calculated healthcare utilization and absenteeism values derived from administrative claims. Participants were required to be eligible for medical and absenteeism insurance benefits but were not required to have any claims during a given time period, i.e., their number of claims in a given period could be zero. The eligible participants for both years were pooled together to create one sample for all outcomes.
Inclusion and Exclusion Criteria
To be included in the healthcare utilization analysis, participants had to be enrolled in the Dow Preferred Provider Organization (PPO) healthcare plan for at least 320 days; this is a minimum number of days used in other healthcare research, (35–37) which allows individuals to be temporarily ineligible for benefits due to travel abroad, unpaid leave, care for family members who are ill, and other short-term circumstances. Only employees eligible for PPO plans were included because their claims supported analysis of individual-level healthcare utilization, whereas data from fully managed health self-insured plans such as Health Maintenance Organizations (HMOs), the other option for Dow, often lack this information. Employees who were pregnant (as determined by their response to a relevant question on the HRA or based on ICD-9 codes in the medical claims database) were excluded from the analyses.
We examined the administrative data for possible invalid, improbable, or inaccurate values and found that none of the healthcare utilization amounts exceeded our reasonableness criteria (e.g., more than 300 doctor visits in one year). As noted above, the pooled data for healthcare utilization were constructed from 2005 and 2006 data files. The number of employees with claims in either year was 16,800. Figure 1 displays how the final study samples for the healthcare utilization outcomes (as shown in Table 4) were derived after inclusion and exclusion criteria were applied.
Figure 1.
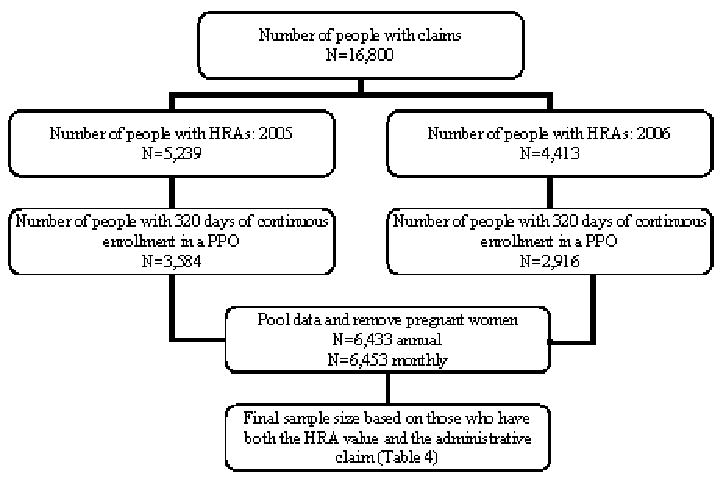
Inclusion criteria and sample size for annual and monthly healthcare utilization outcomes
Table 4.
Distribution of the relationship between self-reported and administrative data, shown as percent perfect agreement, under-reported (more claims than self-report), and over-reported (more self-reported than claims) for all eligible participants
| Yearly Doctor Visits |
Monthly Doctor Visits |
Yearly ER Visits |
Monthly ER Visits |
Yearly Inpatient Admissions |
Monthly Inpatient Admissions |
Yearly Absenteeism |
|
|---|---|---|---|---|---|---|---|
| Percent Agreement | 30.22 | 74.81 | 91.60 | 98.83 | 93.22 | 99.01 | 37.64 |
| Percent Under-reporting | 42.79 | 5.06 | 3.78 | 0.37 | 0.34 | 0.06 | 37.88 |
| Percent Over-Reporting | 26.99 | 20.13 | 4.62 | 0.79 | 6.44 | 0.92 | 24.48 |
| Sample Size | 6169 | 6031 | 6164 | 6164 | 6177 | 6176 | 4812 |
For the absenteeism analysis, only hourly employees were included, since at Dow only these employees report their daily absences to an administrative absence management system. Applying this criteria, 4,184 people were removed from the data file who were exempt (salaried) employees. Employees with more than 90 absent days per year (typically an indication of short-term disability) were excluded, in addition to pregnant women (951 and 60 people, respectively). Finally, 141 people were removed from the sample because of invalid HRA data (i.e. more than 90 absent days per year, invalid values).
The following seven outcomes were analyzed: 1) monthly doctor visits, 2) monthly ER visits, 3) monthly inpatient admissions, 4) yearly doctor visits, 5) yearly ER visits, 6) yearly inpatient admissions, and 7) yearly absent days. Employees were excluded from specific analyses if they did not report a value for a relevant question on the HRA. In the analysis of healthcare utilization, employees who did not have any administrative claims for a given period were assumed to have incurred zero utilization for that period.
Statistical Methods
Since the HRAs were distributed between January and March of a given study year, annual responses were compared to the previous year’s claims data. For example, comparisons were made for participants who completed the HRA in early 2006, using their 2005 administrative data. Monthly comparisons were made by contrasting self-reported utilization in a given month to their previous month’s administrative values in the claims databases.
Data were analyzed at the individual level. Descriptive statistics were used to show means and standard deviations for visits or days, based on the self-reported HRA responses and claims data. Difference scores were created by subtracting the self-reported values from the claims record to show the concordance between the self-report and administrative scores. If the difference score was 0, then “perfect agreement” was recorded between the number of visits or days self-reported and actual administrative claims. If the difference score was negative, participants were said to have over-reported utilization, since the number of visits or days self-reported was higher than their actual administrative claims would suggest. If the difference score was positive, participants were said to have under-reported the number of visits or days.
Finally, to examine factors that might predict accurate self-report, a logistic regression was performed to predict the likelihood of agreement based on demographic and health status characteristics. We applied Generalized Estimating Equations (GEE) methods to handle repeated measures, as our sample included individuals who had data in both study years, and their values were expected to be highly correlated.
The dependent variable in the regression analyses was binary, where a score of 1 indicated perfect agreement between self-report and administrative claims, and 0 indicated disagreement. Confounders adjusted for in the logistic regression included: year of data, person identifier, race, gender, education, body mass index (BMI), study treatment condition, disease severity, and the person’s self-reported health status. Year of data and person identifier were included in the model to account for within subject variation. Age and the Charlson’s Comorbidity Index (CCI), a disease severity indicator of health status, were included as continuous variables.(38, 39)
Race was categorized as “white” or “non-white,” and education was categorized as “basic” (less than a bachelor’s degree) or “advanced” (bachelors, masters or doctoral degrees). BMI was categorized as “normal” (18–24.9), or “high” (25.0 or higher). Self-reported health status, reported as “good,” “very good,” or “excellent” (as a category) was compared to those who reported “fair” or “poor.” The same regression model was used for all outcomes. Analyses were completed using SAS version 9.1 and Stata version 8.(40, 41)
As a sensitivity analysis, we examined the possibility of relaxing the definition of agreement to determine the number of additional participants who would be included in the category of “agreement” by reporting within one, two, or three days. Only annual doctor visits and absenteeism were included in this sensitivity analysis, since more than 90% of the participants had concordance for annual and monthly inpatient hospital admissions, emergency room visits, and monthly doctor visits. Since annual doctor visits and absenteeism are more common than emergency room or hospital admissions, people may not remember their exact number of visits but could come within a few days. We applied the same logistic regression model to these three relaxed definitions of agreement for annual doctor visits and absence days.
Results
Descriptive data for the sample are presented in Tables 1 and 2. Since inclusion and exclusion criteria differed for the healthcare utilization and absenteeism analyses, the demographic characteristics comprising each of the samples also differed.
Table 1.
Descriptive characteristics for the sample used in the absenteeism analysis
| Characteristics | HRA (N=4812) | |
|---|---|---|
| Frequency | Percent | |
| Gender | ||
| Male | 3581 | 74.42 |
| Female | 1231 | 25.58 |
| Race | ||
| White | 3643 | 75.72 |
| African American/Black | 446 | 9.27 |
| Hispanic/Latino | 555 | 11.53 |
| Other | 166 | 3.46 |
| Education | ||
| High School or less | 1127 | 35.93 |
| Vocational | 273 | 8.70 |
| Bachelor’s | 1261 | 40.20 |
| Master’s/Doctorate | 476 | 15.17 |
| Body Mass Index | ||
| Normal (18.5–24.9) | 591 | 21.80 |
| Overweight (25.0–29.9) | 1078 | 39.76 |
| Obese (30.0+) | 1042 | 38.44 |
| Average | Standard Deviation | |
| Age | 45.45 | 8.64 |
| CCI | 0.20 | 0.63 |
| BMI | 29.23 | 5.50 |
Table 2.
Descriptive characteristics for the sample used in the healthcare utilization analysis
| Characteristics | HRA (N=6433) | |
|---|---|---|
| Frequency | Percent | |
| Gender | ||
| Male | 4935 | 76.71 |
| Female | 1498 | 23.29 |
| Race | ||
| White | 4953 | 77.16 |
| African American/Black | 545 | 8.49 |
| Hispanic/Latino | 682 | 10.62 |
| Other | 239 | 3.73 |
| Education | ||
| High School or less | 1171 | 26.61 |
| Vocational | 343 | 7.80 |
| Bachelor’s | 2050 | 46.59 |
| Master’s/Doctorate | 836 | 19.00 |
| Body Mass Index | ||
| Normal (18.5–24.9) | 1065 | 23.89 |
| Overweight (25.0–29.9) | 1765 | 39.59 |
| Obese (30.0+) | 1628 | 36.52 |
| Average | Standard Deviation | |
| Age | 45.73 | 8.39 |
| CCI | 0.27 | 0.84 |
| BMI | 28.97 | 5.43 |
Table 1 displays the descriptive characteristics of 4,812 employees included in the analysis of absenteeism data. About three-fourths were male and white. Their average age was 45, and their average disease severity score, as measured by the CCI, was 0.20. About 36% of the sample had education levels below high school, 40% was classified as overweight, and 38% obese.
Table 2 displays the descriptive characteristics of 6,433 participants included in the healthcare utilization analysis. Similar to the absenteeism participants, about three-quarters of the sample was white and male, and their average age was 46. Almost half of the sample attained a bachelor’s degree, and another 19% had advanced degrees. The sample’s average disease severity score (CCI) was 0.27. The average BMI was 29.0, and the percent of participants classified as overweight and obese were 40% and 37%, respectively.
Table 3 shows the average values and standard deviations for self-reported healthcare use and absenteeism, next to their corresponding administrative claims experience, and the differences between self-reported values and those derived from claims data. Six of seven outcomes had average self-report values within a half day or visit of “actual,” when compared to administrative data. The largest difference between self-reported and administrative data was found in absenteeism scores, where employees over-reported their absenteeism by 1.23 days. To put these figures in perspective, employees under-estimated their annual doctor visits by about one third visit, while yearly and monthly ER and inpatient admissions were nearly identical to values derived from claims data.
Table 3.
Average and standard deviation values for self-reported and claims values in healthcare utilization and absenteeism measures
| Yearly Doctor Visits |
Monthly Doctor Visits |
Yearly ER Visits |
Monthly ER Visits |
Yearly Inpatient Admissions |
Monthly Inpatient Admissions |
Yearly Absenteeism |
|
|---|---|---|---|---|---|---|---|
| Claims Value | 3.29 (3.87) | 0.21 (0.55) | 0.13 (0.43) | 0.01 (0.10) | 0.04 (0.24) | 0.00 (0.05) | 2.03 (4.44) |
| Self-Reported value | 2.97 (5.79) | 0.45 (0.97) | 0.14 (0.44) | 0.01 (0.11) | 0.11 (0.42) | 0.01 (0.12) | 3.26 (7.59) |
| Difference | 0.32 | −0.24 | −0.01 | 0.00 | −0.07 | −0.01 | −1.23 |
Table 4 shows the percent perfect agreement between self-reports and administrative claims, as well as over- and under-reporting of data. Yearly doctor visits and yearly absenteeism had the lowest percent perfect agreement scores (30% and 38% respectively). For yearly and monthly ER visits and hospital inpatient admissions, over 90% of employees perfectly reported their healthcare utilizations in the prior period. As expected, monthly outcomes had higher perfect agreement scores compared to annual outcomes; monthly doctor visits more than doubled the percent perfect agreement compared to annual doctor visits (75% and 30% respectively).
Table 5 presents data for a sensitivity analysis that relaxes the definition of agreement between self-report and administrative data for annual doctor visits and annual absenteeism. By extending the definition of agreement by one day (either as an over or underestimate), percent agreements increased to 61% for doctor visits and 58% for absenteeism, respectively. Expanding agreement definitions by two or three units further increased the percent agreements for absenteeism to 73% and 81%, respectively. Similarly, relaxing the agreement criterion to within three days for doctor visits led to an 85% agreement score. Thus, the vast majority of employees who reported their annual healthcare utilization and absenteeism experience were accurate to within one to three days or visits.
Table 5.
Agreement and relaxed-agreement for yearly doctor visits and absenteeism
| Yearly Doctor’s visits | Yearly Absenteeism | |
|---|---|---|
| Percent Perfect Agreement | 30.22 | 37.64 |
| Percent Under-reporting | 26.99 | 37.88 |
| Percent Over-Reporting | 42.79 | 24.48 |
| Agreement within −1/+1 day | 60.91 | 58.02 |
| Agreement within −2/+2 day | 76.18 | 73.38 |
| Agreement within −3/+3 day | 84.70 | 81.09 |
The results of the regression analyses predicting the likelihood of agreement for annual and monthly outcomes are presented in Tables 6 and 7. While each model had a different set of predictors that significantly influenced the accuracy in the ability of employees to remember prior events, there were some common predictors across outcomes. Overall, education was a significant positive predictor of accuracy in five of the seven models. In particular, participants with advanced degrees were 1.7 to 2 times more likely to correctly predict their annual and monthly hospital admissions compared to those with less education (aOR=1.74 for annual hospital admissions and aOR=2.18 for monthly hospital admissions). Age, gender, and BMI were significant predictors in four of the seven models. Females were less likely to accurately recall the number of health-related events and absenteeism compared to males (i.e., aOR=0.61 and 0.65, for annual and monthly doctor visits, respectively). Older people were less likely to accurately report healthcare utilization (i.e. aOR=0.98 for annual and monthly doctor visits), but more likely to accurately report absenteeism compared to younger people. Similarly, overweight or obese participants were 30–60% less likely to remember their annual and monthly hospital admissions accurately compared to normal BMI participants (aOR=0.67 and 0.30, respectively). Absenteeism had the greatest number of significant predictors (eight out of ten) that influenced the likelihood of agreement.
Table 6.
Logistic Regression Results—adjusted odds ratios and 95% confidence intervals for agreement between annual self-reported and administrative healthcare utilization and absenteeism, examining demographic characteristics
| Annual Doctor Visits | Annual ER Visits | Annual Hospital Admissions |
Annual Absenteeism Days | ||||||||||
|---|---|---|---|---|---|---|---|---|---|---|---|---|---|
| Parameter | Estimate | aOR | 95% Confidence Interval |
Estimate | aOR | 95% Confidence Interval |
Estimate | aOR | 95% Confidence Interval |
Estimate | aOR | 95% Confidence Interval |
|
| Year | 2005 | −0.04 | 0.96 | 0.84–1.09 | 0.03 | 1.03 | 0.83–1.30 | 0.16 | 1.18 | 0.92–1.50 | 0.09 | 1.10 | 0.92–1.31 |
| 2006 | 0.00 | 1.00 | -- | 0.00 | 1.00 | -- | 0.00 | 1.00 | -- | 0.00 | 1.00 | -- | |
| Age | -- | −0.02 | 0.98 | 0.97–0.98 | 0.01 | 1.01 | 0.99–1.02 | −0.03 | 0.97 | 0.96–0.99 | 0.02 | 1.02 | 1.01–1.03 |
| CCI | -- | −0.03 | 0.97 | 0.89–1.05 | −0.01 | 0.99 | 0.86–1.13 | 0.05 | 1.05 | 0.89–1.23 | −0.17 | 0.84 | 0.72–0.99 |
| Race | Not White | −0.06 | 0.94 | 0.80–1.10 | −0.17 | 0.84 | 0.65–1.08 | 0.15 | 1.16 | 0.86–1.57 | 0.07 | 1.07 | 0.86–1.33 |
| White | 0.00 | 1.00 | -- | 0.00 | 1.00 | -- | 0.00 | 1.00 | -- | 0.00 | 1.00 | -- | |
| Education | Advanced | 0.24 | 1.27 | 1.07–1.51 | 0.33 | 1.38 | 1.04–1.83 | 0.55 | 1.74 | 1.28–2.36 | 0.64 | 1.89 | 1.48–2.42 |
| Basic | 0.00 | 1.00 | -- | 0.00 | 1.00 | -- | 0.00 | 1.00 | -- | 0.00 | 1.00 | -- | |
| Gender | Female | −0.49 | 0.61 | 0.52–0.72 | −0.28 | 0.76 | 0.59–0.97 | 0.02 | 1.03 | 0.76–1.39 | −0.92 | 0.40 | 0.32–0.50 |
| Male | 0.00 | 1.00 | -- | 0.00 | 1.00 | -- | 0.00 | 1.00 | -- | 0.00 | 1.00 | -- | |
| BMI | High | −0.18 | 0.84 | 0.71–0.98 | −0.28 | 0.76 | 0.56–1.02 | −0.40 | 0.67 | 0.47–0.96 | -0.43 | 0.65 | 0.52–0.82 |
| Normal | 0.00 | 1.00 | -- | 0.00 | 1.00 | -- | 0.00 | 1.00 | -- | 0.00 | 1.00 | -- | |
| Self-Reported Health Status | good/very good/excellent |
0.18 | 1.20 | 1.00–1.45 | 0.48 | 1.61 | 1.23–2.12 | 0.67 | 1.96 | 1.47–2.61 | 0.29 | 1.34 | 1.03–1.73 |
| poor/fair | 0.00 | 1.00 | -- | 0.00 | 1.00 | -- | 0.00 | 1.00 | -- | 0.00 | 1.00 | -- | |
Table 7.
Logistic Regression Results—adjusted odds ratios and 95% confidence intervals for agreement between monthly self-reported and administrative healthcare utilization and absenteeism, examining demographic characteristics
| Monthly Doctor Visits | Monthly ER Visits | Monthly Hospital Admissions | ||||||||
|---|---|---|---|---|---|---|---|---|---|---|
| Parameter | Estimate | aOR | 95% Confidence Interval |
Estimate | aOR | 95% Confidence Interval |
Estimate | aOR | 95% Confidence Interval |
|
| Year | 2005 | −0.06 | 0.95 | 0.82–1.09 | −0.13 | 0.88 | 0.48–1.62 | 0.31 | 1.37 | 0.76–2.47 |
| 2006 | 0.00 | 1.00 | -- | 0.00 | 1.00 | -- | 0.00 | 1.00 | -- | |
| Age | -- | −0.02 | 0.98 | 0.97–0.99 | 0.02 | 1.02 | 0.99–1.05 | −0.02 | 0.98 | 0.94–1.03 |
| CCI | -- | −0.02 | 0.98 | 0.90–1.06 | −0.23 | 0.80 | 0.67–0.95 | 0.02 | 1.02 | 0.55–1.89 |
| Race | Not White | −0.05 | 0.95 | 0.80–1.12 | 0.11 | 1.11 | 0.54–2.30 | 0.29 | 1.33 | 0.63–2.82 |
| White | 0.00 | 1.00 | -- | 0.00 | 1.00 | -- | 0.00 | 1.00 | -- | |
| Education | Advanced | 0.14 | 1.15 | 0.96–1.38 | −0.11 | 0.90 | 0.41–1.98 | 0.78 | 2.18 | 1.01–4.71 |
| Basic | 0.00 | 1.00 | -- | 0.00 | 1.00 | -- | 0.00 | 1.00 | -- | |
| Gender | Female | −0.42 | 0.65 | 0.56–0.77 | −0.39 | 0.67 | 0.34–1.35 | −0.43 | 0.65 | 0.34–1.25 |
| Male | 0.00 | 1.00 | -- | 0.00 | 1.00 | -- | 0.00 | 1.00 | -- | |
| BMI | High | −0.04 | 0.96 | 0.81–1.15 | −0.17 | 0.84 | 0.39–1.83 | −1.19 | 0.30 | 0.10–0.96 |
| Normal | 0.00 | 1.00 | -- | 0.00 | 1.00 | -- | 0.00 | 1.00 | -- | |
| Self-Reported Health Status | Good/very good/excellent |
0.51 | 1.66 | 1.38–2.00 | 0.41 | 1.50 | 0.74–3.06 | 0.46 | 1.59 | 0.79–3.19 |
| poor/fair | 0.00 | 1.00 | -- | 0.00 | 1.00 | -- | 0.00 | 1.00 | -- | |
For yearly outcomes—absenteeism, doctor visits, ER visits and hospital admissions—education, age, and self-reported health status significantly influenced employees’ ability to accurately remember prior healthcare and absenteeism events (Table 6). Those with advanced degrees were 27% more likely to remember their yearly doctor visits compared to less educated counterparts (aOR=1.27, 95% CI, 1.07–1.51). In general, for each year increase in age, the ability to accurately remember prior events significantly decreased by 2% to 3% (except for annual absenteeism days where older adults were more likely to remember their absent days). Additionally, employees who rated themselves to be in good health were 34% more likely to accurately remember their previous absenteeism days (aOR=1.34, 95% CI, 1.03–1.73) and 61% more likely to remember annual ER visits (aOR=1.61, 95% CI, 1.23–2.12) compared to those in poorer health. Overall, age and self-reported health were significant predictors in three of four yearly outcomes; younger employees were more accurate in remembering doctor visits, hospital admissions and absenteeism, while those in better health had higher accuracy when reporting annual ER visits, hospital admissions and absenteeism. Finally, overweight or obese people were less likely to accurately report yearly doctor visits and hospital admissions compared to normal weight respondents.
Additional analyses were conducted to determine if there was consistency between the two years of data when recalling healthcare usage and absenteeism. The results (not presented) showed that, for the most part, agreement rates did not differ across years with the exception of self-reported absenteeism data, which did fluctuate from year to year. In 2006, employees over-reported their absenteeism by almost an entire day. However, in 2007, over-reporting was reduced to only one-fifth of a day. Despite the different magnitude of over-reporting across years, the percent agreement between the two years was almost identical.
As an extension of the sensitivity analysis presented in Table 5, we also examined the outcomes of relaxed agreement (absenteeism and doctor visits within one, two, and three days) to determine if there were differences in the predictors of agreement. The results (not shown) indicated similar relationships between predictors of perfect agreement and relaxed agreement.
Discussion
We determined the extent to which self-reported healthcare utilization and absenteeism, collected through an HRA, corresponded to administrative data collected for the same employees at Dow during the same time period. Self-reported healthcare utilization (doctor visits, ER visits, and hospitalizations) were compared to insurance claims data, and self-reported absenteeism was compared to data in Dow’s human resources database for hourly employees.
Our results showed that self-reported and administrative data correspond fairly well with respect to healthcare utilization but not for absenteeism. As with previous research (6, 12, 13), our results demonstrated that rates of self-reported absenteeism were higher compared to administrative data. The majority of participants were able to accurately report their healthcare utilization over the past month but not their annual usage, a finding that confirms earlier research. However, the majority of respondents were accurate in their annual recollection of events if the criterion for precision was relaxed by one or two days or visits of their actual values.
Our findings were similar to those of Petrou et al. (27) and Roberts et al. (24) who also found that participants’ agreement was more accurate for monthly compared to yearly outcomes and for outpatient or inpatient hospital services compared to doctor visits. Memory decay, a failure to remember visits to a healthcare provider, may explain why participant agreement was more accurate for monthly healthcare visits compared to yearly visits. The longer the recall period, the less accurate individuals are in reporting use of healthcare services.(1) Since ER visits and inpatient hospital admissions can be traumatic events, they are easier to remember than routine doctor’s visits.
Self-reported healthcare utilization has been used to evaluate the impact of health promotion interventions by calculating cost savings attributable to a reduction in the use of outpatient, inpatient, or ER care, and employees’ absenteeism experience. Our analysis confirms that caution should be taken when self-reported healthcare utilization data are used to calculate costs, especially when estimating annual utilization and corresponding expenses. Others have reported that costs can be as much as 50 percent higher based on self-reported data compared to cost estimates derived from medical records.(42) For inpatient care, patients may not accurately recall two important cost drivers: the length of hospital stay and their primary diagnoses related to the admission.(43)
Consistent with previous findings (24–26), we found that as people age, their ability to accurately report yearly and monthly doctor visits was reduced. We found that higher education predicted greater accuracy for five of the seven outcomes. Although previous results investigating the relationship between gender and self-report accuracy have been mixed (23, 31, 44), our findings suggest that females were less likely to accurately report the number of doctor visits and absenteeism compared to males.
We expected BMI to be a significant predictor of agreement in healthcare utilization because those with higher BMI use more healthcare services (45, 46) and are therefore less likely to accurately report yearly doctor visits, yearly and monthly inpatient hospital admissions, and absenteeism. Our findings confirmed this expectation.
We considered the reliability of self-reported estimates by comparing separate years of data. We found general consistency in the reporting of absenteeism. Additionally, the small standard deviations in self-reported and claims data, and the small ranges reported for 95% confidence intervals in the logistic regression analyses, further reinforced our observation that findings were consistent across years.
Limitations
A limitation of this study is that employees may interpret questions on the HRA in different ways. Some respondents may have interpreted our HRA question asking about health care utilization “in the past year” to mean within the past calendar year (January to December) or in the past 12 months (i.e., from the exact date they completed the HRA). We assumed in our analysis that respondents reported their experience in the past calendar year. Another limitation related to question interpretation concerns the term ‘doctor visits’ which, for some may mean visits to any type of doctor, while for others may mean visits to a primary care physician.
The discrepancy found between self-reported absenteeism and data collected by the Dow human resource system may be explained by the way employees report their data to administrative systems. Employees may report absenteeism for reasons other than their own sickness. They may report being absent when they need to care for other family members who are ill, to attend a family event, to repair their cars, to be home for a service call or store delivery, or simply to recover from a stressful work event or long overtime. The HRA at Dow asks employees to recall their days absent attributable to personal illness or injury whereas employees reporting their absence in the administrative system may do so for any number of other reasons.
Another potential limitation is that the Dow employees responding to the HRA may be different in important ways from non-respondents in terms of demographic characteristics and patterns of healthcare utilization and absenteeism. This would limit the generalizability of our analysis. To examine this issue, we compared the gender, education, age, and race composition of non-respondents to respondents. We found some differences. Our sample had more females, was more highly educated, contained more whites and Hispanic/Latinos, and fewer African Americans. In addition, employees in our sample were on average 1.5 years older. Thus, as is common in other studies where HRA participants are compared to non-participants, respondents to HRA surveys may not be typical of all workers at a given employer, especially when response rates are low.
We excluded employees who were pregnant from the analysis, since these employees are atypical of the general employee population in that their healthcare utilization and absenteeism experience would be temporarily affected by their pregnancy status. Also, women who are pregnant are probably more likely to remember their number of prenatal visits and time away from work. If so, including pregnant workers in the analysis might have artificially increased the levels of agreement. This is a testable hypothesis for future research.
Conclusions/Implications for Action
We conclude that self-reported healthcare utilization and absenteeism can be relied upon as proxies for financial outcome measures when the recall required is within one month. However, the ability to extrapolate results from one month to a year, in order to infer annual medical and absenteeism losses, is inexact and subject to recall bias. Respondents accurately remembered monthly events, but concordance rates were low for annual common events where recall increased as the definition of agreement was relaxed. Furthermore, individuals have higher accuracy in reporting isolated, traumatic events such as visits to the ER and hospital admissions, which are less common and not easily forgotten.
We recommend that questions on HRAs should ask about monthly healthcare utilization and absenteeism; short recall periods garner the most accurate answers for estimating routine events such as doctor visits and absences from work, while annual estimates of infrequent events such as ER and inpatient hospital admissions are mostly valid and reliable. We also recommend replicating our methods using additional comparisons of self-reported values to administrative claims of other companies and diverse employee populations. Once validated by other studies, a set of HRA questions can be developed to finely tune questions related to participants’ healthcare utilization and absenteeism through self-reported means. Using this finely tuned instrument, one may be able to develop prediction models that would adjust self-reported data based on linkages to actual healthcare utilization and absenteeism data. This would allow researchers to better estimate of the actual changes over time for healthcare utilization and absenteeism outcomes when administrative data are unavailable.
This study also reported on the characteristics of participants who accurately report their healthcare utilization and absenteeism. Future studies should explore these findings to determine why certain participants are under- or over-reporting. For example, our study found that women are less accurate in their reporting compared to men. We speculate that the actual healthcare and absenteeism experience of women, who tend to be the primary healthcare decision-makers in families, may be obscured by other family members’ healthcare and absenteeism experience. Future research could explore why these differences by gender exist.
These findings are important to employers, health plans, state governments, and researchers because many of them collect financial data using HRAs as a proxy for actual claims and administrative data. The results highlight the care needed when monetizing self-report data. As shown, when relaxed definitions of agreement are used, self-reported measures of healthcare use and absenteeism can provide a range of costs due to poor health and for evaluating health and disease management program impacts.
For state health departments and Medicaid administrators, program officials may wish to consider inserting healthcare utilization and productivity items into survey instruments and other health assessments. The information collected can help them estimate the economic impacts of alternative policies and programs and to appeal to business interests about the economic consequences of poor health. It may be valuable for these entities to test the relationships examined in this study to assess the relative merits of either data collection method. It may also be useful to assess the cost-effectiveness of analyzing large quantities of administrative data as compared to relying upon frequent random surveys of target populations. In any event, further studies of this issue with across and within populations is warranted.
In close, because many researchers now rely upon self-reported healthcare utilization and absenteeism measures to calculate the differences in business metrics between program participants and non-participants, the evaluation of the accuracy of self-reported data is essential. While previous studies examined specific diseases conditions or medical services when assessing the accuracy of self-reports, our analysis approached this issue more globally, addressing more macro estimates related to health service use and worker productivity. Such measures are relevant to evaluations of program effects, especially when economic analyses are needed to sustain investments in these programs.
Acknowledgments
ACKNOWLEDGMENT OF FUNDING: Funding for the preparation of this paper was provided under (NHLBI): 1 R01 HL079546-01. The opinions expressed in this paper are the authors’ and do not represent the opinions of Emory University or Thomson Reuters. The authors would like to thank Jessica Waddell M.P.H. for reviewing and editing this paper.
Contributor Information
Meghan E. Short, Health and Productivity Research, Thomson Reuters.
Ron Z. Goetzel, Institute for Health and Productivity Studies, Rollins School or Public Health, Emory University; Vice President, Consulting and Applied Research, Thomson Reuters, 4301 Connecticut Ave., NW - Suite 330, Washington, DC 20008, 202-719-7850, 202-719-7801 (fax), ron.goetzel@thomsonreuters.com.
Xiaofei Pei, Health and Productivity Research, Thomson Reuters.
Maryam J. Tabrizi, Health and Productivity Research, Thomson Reuters.
Ronald J. Ozminkowski, Ann Arbor, MI.
Teresa B. Gibson, Health Outcomes Research, Thomson Reuters
Dave M. DeJoy, Department of Health Promotion and Behavior, College of Public Health, University of Georgia, Athens, GA
Mark G. Wilson, Department of Health Promotion and Behavior, College of Public Health, University of Georgia, Athens, GA
References
- 1.Bhandari A, Wagner T. Self-Reported Utilization of Health Care Services: Improving Measurement and Accuracy. Medical Care Research and Review. 2006;63:217–235. doi: 10.1177/1077558705285298. [DOI] [PubMed] [Google Scholar]
- 2.U.S. Department of Health and Human Services National Center for Health Statistics. National Health Interview Survey. Hyattsville, MD: 1997. [Google Scholar]
- 3.Centers for Disease Control and Prevention. Behavioral Risk Factor Surveillance System Survey Data. Atlanta, Georgia: U.S. Department of Health and Human Services, Centers for Disease Control and Prevention; 2007. [Google Scholar]
- 4.U.S. Department of Health and Human Services Center for Medicare Medicaid Services. Medicare Current Beneficiary Survey. Baltimore, MD: 2007. [Google Scholar]
- 5.New York City Department of Health and Mental Hygiene, Bureau of Epidemiology Services. New York City Community Health Survey (CHS) Department of Health and Mental Hygiene DoE, Bureau of Epidemiology Services, ed; New York, NY: 2006. [Google Scholar]
- 6.Pole JD, Franche RL, Hogg-Johnson S, Vidmar M, Krause N. Duration of work disability: a comparison of self-report and administrative data. Am J Ind Med. 2006;49:394–401. doi: 10.1002/ajim.20300. [DOI] [PubMed] [Google Scholar]
- 7.Krause N, Dasinger LK, Deegan LJ, Brand RJ, Rudolph L. Alternative approaches for measuring duration of work disability after low back injury based on administrative workers’ compensation data. Am J Ind Med. 1999;35:604–618. doi: 10.1002/(sici)1097-0274(199906)35:6<604::aid-ajim8>3.0.co;2-t. [DOI] [PubMed] [Google Scholar]
- 8.Amick BC, 3rd, Lerner D, Rogers WH, Rooney T, Katz JN. A review of health-related work outcome measures and their uses, and recommended measures. Spine. 2000;25:3152–3160. doi: 10.1097/00007632-200012150-00010. [DOI] [PubMed] [Google Scholar]
- 9.Rees D, Cooper CL. Research note: reliability of self-report sickness absence data in the health service. Health Serv Manage Res. 1993;6:140–141. doi: 10.1177/095148489300600208. [DOI] [PubMed] [Google Scholar]
- 10.Revicki DA, Irwin D, Reblando J, Simon GE. The accuracy of self-reported disability days. Med Care. 1994;32:401–404. doi: 10.1097/00005650-199404000-00008. [DOI] [PubMed] [Google Scholar]
- 11.Kessler RC, Barber C, Beck A, et al. The World Health Organization Health and Work Performance Questionnaire (HPQ) J Occup Environ Med. 2003;45:156–174. doi: 10.1097/01.jom.0000052967.43131.51. [DOI] [PubMed] [Google Scholar]
- 12.Evanoff B, Abedin S, Grayson D, Dale AM, Wolf L, Bohr P. Is disability underreported following work injury? J Occup Rehabil. 2002;12:139–150. doi: 10.1023/a:1016838510682. [DOI] [PubMed] [Google Scholar]
- 13.Dasinger LK, Krause N, Deegan LJ, Brand RJ, Rudolph L. Duration of work disability after low back injury: a comparison of administrative and self-reported outcomes. Am J Ind Med. 1999;35:619–631. doi: 10.1002/(sici)1097-0274(199906)35:6<619::aid-ajim9>3.0.co;2-i. [DOI] [PubMed] [Google Scholar]
- 14.Fiscella K, Holt K, Meldrum S, Franks P. Disparities in Preventive Procedures: Comparisons of Self-Report and Medicare Claims Data. BMC Health Services Research. 2006;29:122. doi: 10.1186/1472-6963-6-122. [DOI] [PMC free article] [PubMed] [Google Scholar]
- 15.Beckles GL, Williamson DF, Brown AF, et al. Agreement Between Self-Reports and Medical Records was Only Fair in a Cross-Sectional Study of Performance of Annual Eye Examinations Among Adults with Diabetes in Managed Care. Medical Care. 2007;45:876–883. doi: 10.1097/MLR.0b013e3180ca95fa. [DOI] [PubMed] [Google Scholar]
- 16.Hiatt RA, Perez-Stable EJ, Quesesnberry C, Sabogal F, Otero-Sabogal R, McPhee SJ. Agreement Between Self-Reported Early Cancer Detection Practices and Medical Audits Among Hispanic and non-Hispanic White Health Plan Members in Northern California. Preventive Medicine. 1995;24:278–285. doi: 10.1006/pmed.1995.1045. [DOI] [PubMed] [Google Scholar]
- 17.Rhodes AE, Lin E, Mustard CA. Self-Reported Use of Mental Health Services Versus Administrative Records: Should We Care? International Journal of Methods in Psychiatric Research. 2002;11:125–133. doi: 10.1002/mpr.130. [DOI] [PMC free article] [PubMed] [Google Scholar]
- 18.Rhodes AE, Fung K. Self-Reported Use of Mental Health Services Versus Administrative Records: Care to Recall? International Journal of Methods in Psychiatric Research. 2004;13:165–175. doi: 10.1002/mpr.172. [DOI] [PMC free article] [PubMed] [Google Scholar]
- 19.Fowles JB, Rosheim K, Fowler EJ, Craft C, Arrichiello L. The Validity of Self-Reported Diabetes Quality of Care Measures. International Journal for Quality in Health Care. 1999;11:407–412. doi: 10.1093/intqhc/11.5.407. [DOI] [PubMed] [Google Scholar]
- 20.Newell SA, Gorges A, Samson-Fisher RW, Savolainen NJ. The Accuracy of Self-Reported Health Behaviors and Risk Factors Relating to Cancer and Cardiovascular Disease in the General Population: A Critical Review. American Journal of Preventive Medicine. 1999;17:211–229. doi: 10.1016/s0749-3797(99)00069-0. [DOI] [PubMed] [Google Scholar]
- 21.Zapka JG, Bigelow C, Hurley T, et al. Mammography Use Among Sociodemographically Diverse Women: The Accuracy of Self-Report. American Journal of Public Health. 1996;86:1016–1021. doi: 10.2105/ajph.86.7.1016. [DOI] [PMC free article] [PubMed] [Google Scholar]
- 22.Bowman JA, Sanson-Fisher R, Redman S. The Accuracy of Self-Reported Pap Smear Utilization. Social Science & Medicine. 1997;44:969–976. doi: 10.1016/s0277-9536(96)00222-5. [DOI] [PubMed] [Google Scholar]
- 23.Ritter PL, Stewart AL, Kaymaz H, Sobel DS, Block DA, Lorig KR. Self-Reports of Healthcare Utilization Compared to Provider Records. Journal of Clinical Epidemiology. 2001;54:136–141. doi: 10.1016/s0895-4356(00)00261-4. [DOI] [PubMed] [Google Scholar]
- 24.Roberts RO, Bergstralh EJ, Schmidt L, Jacobsen SJ. Comparison of Self-Reported and Medical Record Health Care Utilization Measures. Journal of Clinical Epidemiology. 1996;49:989–995. doi: 10.1016/0895-4356(96)00143-6. [DOI] [PubMed] [Google Scholar]
- 25.Cleary PD, Jette AM. The Validity of Self-Reported Physician Utilization Measures. Medical Care. 1984;22:796–803. doi: 10.1097/00005650-198409000-00003. [DOI] [PubMed] [Google Scholar]
- 26.Wallihan DB, Stump TE, Callahan CM. Accuracy of Self-Reported Health Services Use and Patterns of Care Among Urban Older Adults. Medical Care. 1999;37:662–670. doi: 10.1097/00005650-199907000-00006. [DOI] [PubMed] [Google Scholar]
- 27.Petrou S, Murray L, Cooper P, Davidson LL. The Accuracy of Self-Reported Healthcare Resource Utilization in Health Economic Studies. International Journal of Technology Assessment in Health Care. 2002;18:705–710. doi: 10.1017/s026646230200051x. [DOI] [PubMed] [Google Scholar]
- 28.Marshall SF, Deapen D, Allen M, et al. Validating California Teachers Study Self-Reports of Recent Hospitalization: Comparison with California Hospital Discharge Data. American Journal of Epidemiology. 2003;158:1012–1020. doi: 10.1093/aje/kwg256. [DOI] [PubMed] [Google Scholar]
- 29.Reijneveld SA, Stronks K. The Validity of Self-Reported Use of Health Care Across Socioeconomic Strata: A Comparison of Survey and Registration Data. International Journal of Epidemiology. 2001;30:1407–1414. doi: 10.1093/ije/30.6.1407. [DOI] [PubMed] [Google Scholar]
- 30.Reijneveld SA. The Cross-Cultural Validity of Self-Reported Use of Health Care: A Comparison of Survey and Registration Data. Journal of Clinical Epidemiology. 2000;53:267–272. doi: 10.1016/s0895-4356(99)00138-9. [DOI] [PubMed] [Google Scholar]
- 31.Raina PVT-R, Wong M, Woodward C. Agreement Between Self-Reported and Routinely Collected Health-Care Utilization Data Among Seniors. Health Services Research. 2002;37:751–774. doi: 10.1111/1475-6773.00047. [DOI] [PMC free article] [PubMed] [Google Scholar]
- 32.Muharjarine N, Mustard CA, Roos LL, Young TK, Gelskey DE. Comparison of Survey and Physician Claims Data for Detecting Hypertension. Journal of Clinical Epidemiology. 1997;50:711–718. doi: 10.1016/s0895-4356(97)00019-x. [DOI] [PubMed] [Google Scholar]
- 33.Pratt CA, Lemon SC, Fernandez ID, et al. Design Characteristics of Worksite Environmental Interventions for Weight Control and Obesity Prevention. Obesity. 2007;15:2171–2180. doi: 10.1038/oby.2007.258. [DOI] [PubMed] [Google Scholar]
- 34.Wilson MG, Goetzel RZ, Ozminkowski RJ, et al. Using Formative Research to Develop Environmental and Ecological Interventions to Address Overweight and Obesity. Obesity. 2007;15:37S–47S. doi: 10.1038/oby.2007.386. [DOI] [PMC free article] [PubMed] [Google Scholar]
- 35.U.S. Office of Personnel Management. FEHB Program Carrier Letter: Guidance on HEDISR Measures for Fee-for-Service Plans. Washington, DC: National Committee on Quality Assurance; 2006. [Google Scholar]
- 36.Ozminkowski RJ, Wang S, Marder WD, Azzolini J. Short-run Associations Between Medical Care Expenditures and Adherence to Clinical Practice Guideline-based Measures for Diabetes. Value in Health. 2000;3:29–38. doi: 10.1046/j.1524-4733.2000.36013.x. [DOI] [PubMed] [Google Scholar]
- 37.Ozminkowski RJ, Wang S, Marder WD, Azzolini J, Schutt D. Cost Implications for the Use of Anti-Inflammatory Medications in the Treatment of Asthma. Pharmacoeconomics. 2000;18:253–264. doi: 10.2165/00019053-200018030-00005. [DOI] [PubMed] [Google Scholar]
- 38.Charlson ME, Pompei P, Ales K, MacKenzie CR. A New Method of Classifying Prognostic Comorbidity in Longitudinal Studies: Development and Validation. Journal of Chronic Diseases. 1987;40:373–383. doi: 10.1016/0021-9681(87)90171-8. [DOI] [PubMed] [Google Scholar]
- 39.de Groot V, Beckerman H, Lankhorst GJ, Bouter LM. How to measure comorbidity. a critical review of available methods. J Clin Epidemiol. 2003;56:221–229. doi: 10.1016/s0895-4356(02)00585-1. [DOI] [PubMed] [Google Scholar]
- 40.SAS Cary. N.C: SAS Institute, Inc; 2003. [Google Scholar]
- 41.Stata Statistical Software. College Station, TX: StataCorp; 2003. [Google Scholar]
- 42.Cronan TA, Walen HR. Accuracy of Self-Reported Healthcare Use in Patients with Osteoarthritis. Journal of Rheumatology. 2002;29:2181–2184. [PubMed] [Google Scholar]
- 43.Wagner TH, Chen S, Barnett PG. Using Average Cost Methods to Estimate Encounter-Level Costs for Medical-Surgical Stays in the VA. Medical Care Research and Review. 2003;60:15S–36S. doi: 10.1177/1077558703256485. [DOI] [PubMed] [Google Scholar]
- 44.Jobe JB, White AA, Kelley CL, Mingay DJ, Sanchez MJ, Loftus EF. Recall strategies and memory for health-care visits. Milbank Q. 1990;68:171–189. [PubMed] [Google Scholar]
- 45.Raebel MA, Malone DC, Conner DA, Xu S, Porter JA, Lanty FA. Health Services Use and Health Care Costs of Obese and Nonobese Individuals. Archives of Internal Medicine. 2004;164:2135–2140. doi: 10.1001/archinte.164.19.2135. [DOI] [PubMed] [Google Scholar]
- 46.Quesenberry CP, Caan B, Jacobson A. Obesity, Health Services Use and Health Care Costs Among Members of a Health Maintenance Organization. Archives of Internal Medicine. 1998;158:466–472. doi: 10.1001/archinte.158.5.466. [DOI] [PubMed] [Google Scholar]