Abstract
Application of 13C MRS in vivo on whole body MR system has been limited due to the low static field (and consequent low signal to noise ratio—SNR) of these scanners; thus there have been few reports of 1H decoupled 13C MRS in vivo using a clinical MR platform. The recent development of techniques to retain highly polarized spins in solution following DNP in a solid matrix has provided a mechanism to use endogenous pre-polarized 13C labeled substrates to study real time cellular metabolism in vivo with high SNR. In a recent in vivo hyperpolarized metabolic imaging study using 13C pyruvate, it has been demonstrated that the line shape (signal decay) of the resonances observed are greatly affected by JCH coupling in addition to inhomogeneous broadening. This study demonstrates the feasibility of improving hyperpolarized 13C metabolic imaging in vivo by incorporating 1H decoupling on a clinical whole body 3 T MR scanner. No reduction of T1 of a pre-polarized 13C substrate ([1-13C] lactate) in solution was observed when 1H decoupling was applied with WALTZ16 sequence. Narrower linewidth for the [1-13C] lactate resonance was observed in hyperpolarized 13C MRSI data in vivo with 1H decoupling.
Keywords: DNP, Hyperpolarized 13C MR metabolic imaging, 1H decoupling, T1, Clinical MR system
1. Introduction
1H decoupling for 13C MRS experiments is performed routinely on analytical NMR systems for both simplification of the NMR spectrum as well as enhancement of peak amplitude signal to noise. It has also been utilized in in vivo MRS experiments with dedicated high field animal MR systems [1]. Application of 13C MRS in vivo on whole body MR systems has been limited due to the low static field of these scanners (hence lower sensitivity). Thus there have been few reports of 1H decoupled 13C MRS in vivo using a clinical MR platform [2,3].
The recent development of techniques to retain highly polarized spins in solution from DNP [4] has provided a mechanism to use endogenous pre-polarized substrates to study real time cellular metabolism in vivo [5]. It has been shown following injection of pre-polarized [1-13C] pyruvate, that its metabolic products [1-13C] lactate, [1-13C] alanine and [1-13C] bicarbonate can be observed in vivo [5,6]. In a recent in vivo hyperpolarized metabolic imaging study using 13C pyruvate, it was demonstrated that the line shape (signal decay) of the resonances observed were greatly affected by JCH coupling in addition to inhomogeneous broadening (T2*) [6]. Since the 13C spectrum in this particular application is fairly sparse, the broadened lines do not affect the ability to identify and quantify each of the metabolite resonances individually. However, as the pre-polarized substrate and DNP applications move beyond [1-13C] pyruvate, stronger proton–carbon coupling and smaller chemical shift difference between metabolites may hinder interpretation and quantification of the data.
One important consideration for 13C MRS or MRSI experiments is the longitudinal relaxation time of the pre-polarized substrate as well as its metabolite products. A previous study reported a reduction of T1s of 13C spins in non-hyperpolarized substrates when conventional 1H decoupling scheme (such as WALTZ16 [7]) was applied [8]. In the present study, the effect of 1H decoupling on the T1 of a pre-polarized 13C substrate was investigated at both low and high magnetic fields. This study also examined the feasibility of improving hyperpolarized 13C metabolic imaging in vivo by incorporating 1H decoupling on a clinical whole body 3 T MR scanner.
2. Methods
2.1. MR hardware
All in vivo and some solution studies of the pre-polarized 13C metabolite T1 measurement in solution were performed using a 3 T GE Signa™ scanner (GE Healthcare, Waukesha, WI) equipped with the MNS (multinuclear spectroscopy) hardware package. This system was also equipped with a separate 1H RF channel for decoupling. The 1H decoupling unit was programmed with WALTZ16 pulse sequence and allowed bi-level irradiation. The RF coil used in the 3 T experiments was a custom build dual-tuned 1H–13C birdcage coil with a quadrature 13C channel and linear 1H channel constructed based on an earlier design [9]. The inner coil diameter was 8 cm and the length of the coil was 9 cm. A Varian INOVA 14.1 T spectrometer (Varian, Palo Alto, CA) equipped with an 8 mm 31P/13C dual-tuned probe with 1H decoupling outer coil was also used for pre-polarized 13C metabolite T1 measurements in solution.
2.2. Polarizer and compound
A HyperSense DNP polarizer (Oxford Instruments, Abingdon, UK) was used in this study. Two different preparations of 13C samples were polarized and dissolved in this study: first was a mixture [1-13C] lactate (Isotec, Miamisburg, OH), water, DMSO and OX063 trityl radical (Oxford Instruments, Abingdon, UK). The mixture contained 38.5% [1-13C]-lactate and 30% DMSO. The trityl radical concentration was 15 mM. The second preparation, used in the in vivo experiments was a mixture of neat (99% purity) [1-13C] pyruvic acid (Isotec) and 15 mM of OX063 trityl radical. Both mixtures were polarized in a field of 3.35 T at approximately 1.4 K by irradiation of microwaves (94.116 GHz for lactate mixture, and 94.113 GHz for pyruvic acid mixture) similar to what was described previously [4]. Each 13C lactate sample (n = 9) was polarized for ~100 min prior to dissolution with a 100 mM phosphate buffer (50 μl of lactate mixture/5 ml of buffer). Each [1-13C] pyruvic acid sample (two for each animal, four total) was polarized for ~60 min prior to dissolution with 40 mM TRIS buffered NaOH solution (32 μl of pyruvic acid mixture/~5 ml of buffer) that gave a nominal final pH of 7.4 [6].
2.3. Simulation
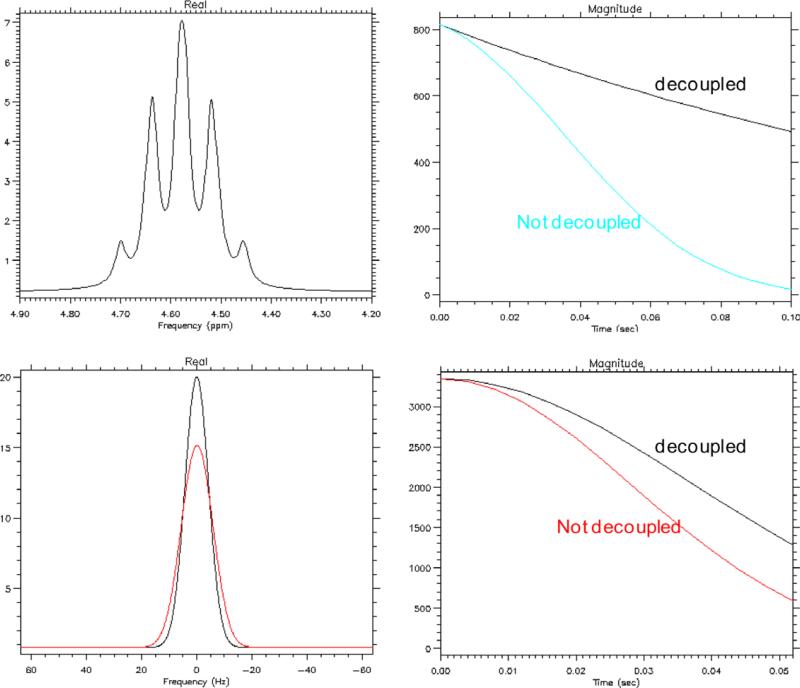
Simulated [1-13C] lactate data with and without JCH coupling were created in SAGE software (GE Healthcare, Waukesha, WI). One dataset was created with T2* of 200 ms (1.6 Hz linewidth) without JCH coupling and the other dataset was created with T2* of 32 ms (10 Hz linewidth) without JCH coupling. Area under the T2* decay curve were calculated for both datasets without and with the presence of JCH coupling to estimated the SNR benefit of [1-13C] lactate data acquired with 1H decoupling vs. without 1H decoupling (3.33 Hz for methine-carbonyl coupling, and 4.1 Hz for methyl-carbonyl coupling, empirically measured at 9.4 T, data not shown).
2.4. T1 measurement of pre-polarized 13C metabolite in solution
Experiments to estimate the T1 of pre-polarized [1-13C] lactate with and without decoupling were conducted at both 14.1 and 3 T. A small tip angle (five degree in all experiments) pulse-acquire pulse sequence was used on both platforms. For measurements at 3 T, 64 spectra were acquired at interval of 3 s (TR = 3 s) and sampling duration was 1.638 s (5000 Hz spectral bandwidth, 8192 pts). Four T1 measurements of pre-polarized [1-13C] lactate were performed at 3 T: without decoupling (n = 2) and with WALTZ 16 1H decoupling (n = 2). A syringe filled with 1.77 M [1-13C] lactate solution was tested prior to the experiments with the pre-polarized [1-13C] lactate to determine the decoupling parameters, The WALTZ-16 sequence was used with a 90 pulse-width of 1.25 ms and power of 30 W during acquisition. Using the bi-level irradiation feature of this 1H RF channel, decoupling power was attenuated by 10 dB during non-sampling portion of the pulse sequence. The center frequency used for decoupling was 127.76315 MHz (between the methine and the methyl protons of lactate). For measurements at 14.1 T, 64 spectra were acquired at intervals of 3.5 s (TR = 3.5 s) and sampling duration was 2 s (16,000 Hz spectral bandwidth, 32,000 pts). Five T1 measurements of pre-polarized [1-13C] lactate were performed at 14.1 T: without decoupling (n = 2), WALTZ16 1H decoupling during sampling only (n = 1), and WALTZ16 1H decoupling continuously (n = 2) during the entire experiment. The WALTZ16 sequence had a 90° pulse duration of 29.2 μs for a pre-calibrated power setting at 14.1 T. To estimate the longitudinal relaxation time, 13C lactate peak integrals were plotted as a function of time and the signal decay curve was fitted to the equation: I(i) = Iocos(i–1)θe–(i–1)TR/T1, where I(i) is the signal measured at each time point, Io is the signal of the first point, θ is the RF tip angle [10]. The fitting was performed using Marquardt's non-linear least square routine as implemented in MATLAB software (The MathWorks Inc., Natick, MA). For the 3 T measurements, the entire sample was within the detection volume of the RF coil, for the 14.1 T measurements, most of the sample was within the detection volume of the coil. Shimming was performed manually in all in vitro experiments using a syringe (3 T) or an nmr tube (14.1 T) filled with non-hyperpolarized [1-13C] lactate solution.
2.5. In vivo 13C MRSI experiments
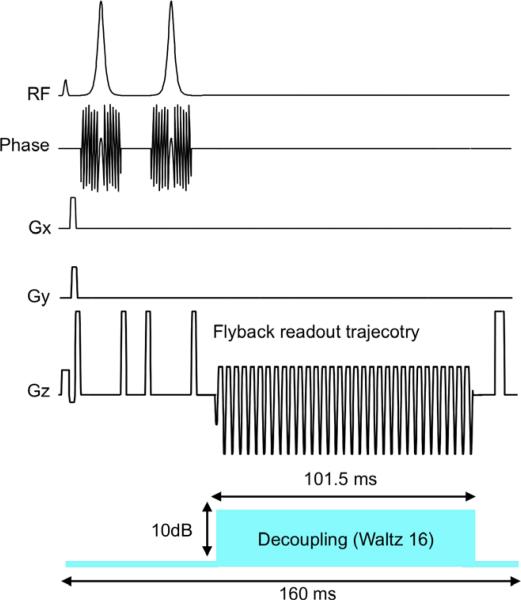
All animal experiments followed a protocol approved by the UCSF institutional animal research committee. Two hyperpolarized 13C MRSI experiments were performed on each of the two normal male Sprague–Dawley rats included in the study. For each animal, the MRSI experiments were performed following two separate (1 h apart) tail vein injections of 2.5 ml/100 mM of pre-polarized [1-13C] pyruvate, with 1H decoupling performed in one of the two experiments. Care was taken to ensure the body temperature of the animal was constant throughout the imaging procedures by maintaining a flow of heated water through the pad supporting the rat. Both the oxygen saturation and pulse rate of the animal was continuously monitored to ensure that the animals were under similar apparent physiological state for the two injections. Shim current values were kept the same throughout the experiment for a given animal. Shim current values were set by the standard auto-shimming routine on the MRI system performed during the 1H anatomical scans, as endogenous natural abundant 13C spins in a normal rat was inadequate for shimming. A double spin–echo pulse sequence with a flyback echo-planar readout trajectory was used in the experiments with TE = 35 ms and TR = 160 ms (Fig. 1) [11]. Spectral resolution was 9.85 Hz/pts (101.5 ms sampling time, 581 Hz spectral bandwidth, 59 pts). The spatial encoding matrix was 12 × 8 × 16, and FOV was 72 mm × 48 mm × 96 mm, resulted in (6 mm)3 spatial resolution. The acquisition started 35 s after the beginning of the injection (injection duration: 12 s) [6,12]. The total acquisition time was ~15 s. The WALTZ16 parameters used in the in vivo experiments were the same as what was described above in the in vitro experiments at 3 T. Peak amplitude and linewidth (FWHM) of both 13C lactate and 13C pyruvate resonances were measured (from all voxels within the rat body) and compared between experiments with and without 1H decoupling. Liquid state polarizations were presumed to be the same for the two experiments in each animal at the time of injection. The paired T-test was used to examine if the changes in peak amplitude and linewidth were significant for the experiments with 1H decoupling as compared to those without.
Fig. 1.
13C pulse sequence (with 1H decoupling) diagram for in vivo 3D MRSI experiment.
3. Results
The simulated spectrum of [1-13C] lactate with 200 ms T2* and JCH coupling is shown in Fig. 2 (upper left). The corresponding T2* decay curves with and without the JCH coupling (Fig. 2, upper right) demonstrated an SNR benefit of 1H decoupling even when a short sampling duration was used. More specifically, when 100 ms of the FID was sampled, the integral under the T2* curve is was 78% higher with 1H decoupling as compared to without decoupling; when only 50 ms of the FID was sampled, the integral under the curve with 1H decoupling was still 24% higher. [1-13C] lactate was also simulated as a peak with 10 Hz Gaussian line shape (32 ms T2*, Fig. 2, lower left). In this case, when 50 ms of the FID was sampled, a 19% gain with 1H decoupling was attained when 1H decoupling was used as compared to without 1H decoupling (Fig. 2, lower right).
Fig. 2.
Simulated [1-13C] lactate data with 200 ms T2* (spectrum: upper left, T2* decay curves: upper right) and 32 ms T2* (spectrum: lower left, T2* decay curves: lower right) are shown. When sampling 50 ms of the FID, in data with 200 ms T2*, 1H decoupling improve the area under the curve by 24%; in data with 32 ms T2*, 1H decoupling improve the area by 18%.
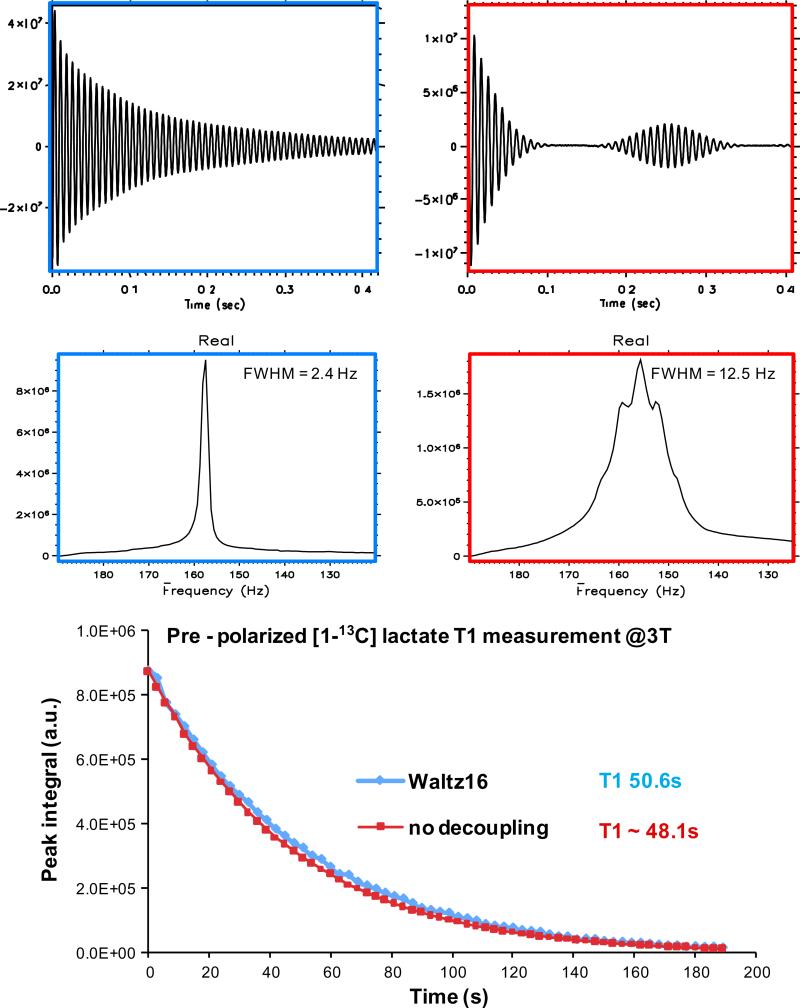
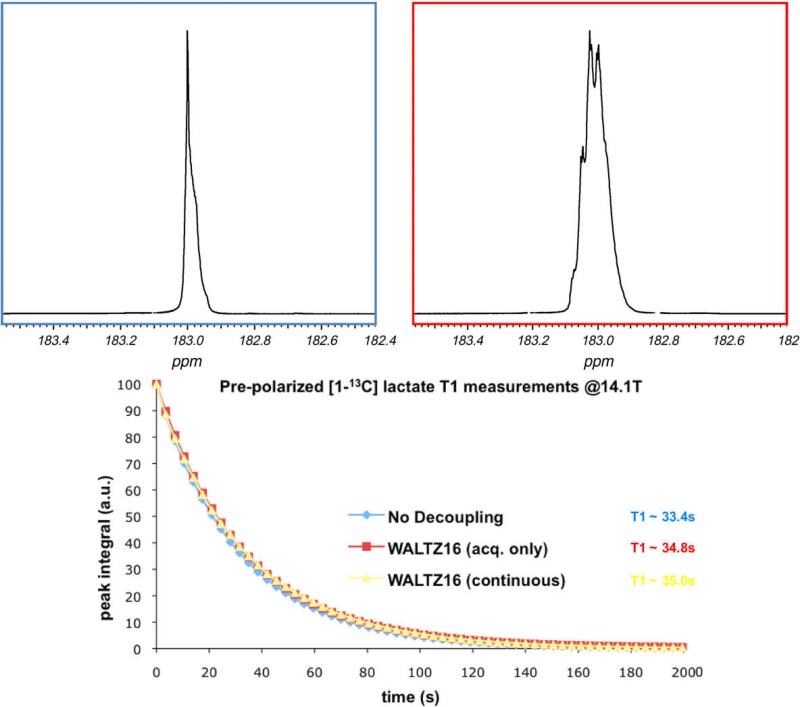
Representative data from the in vitro T1 measurement of pre-polarized [1-13C] lactate at 3 T are summarized in Fig. 3. The effect of 1H decoupling was demonstrated in the representative free induction decay and spectra from both experiments (Fig. 3, upper and middle plots). Average lactate linewidth (FWHM) for the experiments at 3 T with 1H decoupling was 2.4 Hz and that for the experiments without 1H decoupling was 12.5 Hz. The T1 estimated from the experiment with WALTZ16 decoupling was approximately 50.5 s (50.6 and 50.4 s in repeated experiments) and it was approximately 48.3 s (48.1 and 48.4 s) for the experiment without 1H decoupling (Fig. 3. lower plot). Data from T1 measurement of pre-polarized [1-13C] lactate at 14.1 T are summarized in Fig. 4. A shortening of T1 was observed at higher field. T1s of pre-polarized lactate were approximately 33.0 (average of 33.4 and 32.7 s), 34.8 and 35.1 s (average of 35.0 and 35.2 s), respectively, for experiments without 1H decoupling, with WALTZ16 decoupling RF irradiation during sampling only and decoupling RF irradiation continuously. The lactate carbonyl linewidth for the experiments at 14.1 T with 1H decoupling was 2.3 Hz and that for the experiments without 1H decoupling was 13.0 Hz. The average R2 values of the signal decay curve fit was >0.99.
Fig. 3.
In vitro T1 measurement of pre-polarized [1-13C] lactate at 3 T. Representative FIDs and spectra from both the 1H decoupled experiments (upper and middle left) and the experiments without decoupling are shown (upper and middle right). Signal decay curve from the representative data are plotted (lower plot), the two curves are normalized by the first time point of each experiment.
Fig. 4.
Data from in vitro T1 measurement of pre-polarized [1-13C] lactate at 14.1 T. Representative spectra with 1H decoupling (upper left) and without 1H decoupling (continuous decoupling, upper right) are shown. Signal decay curves from the data were plotted (lower plot), the curves were normalized by the first time point of each experiment.
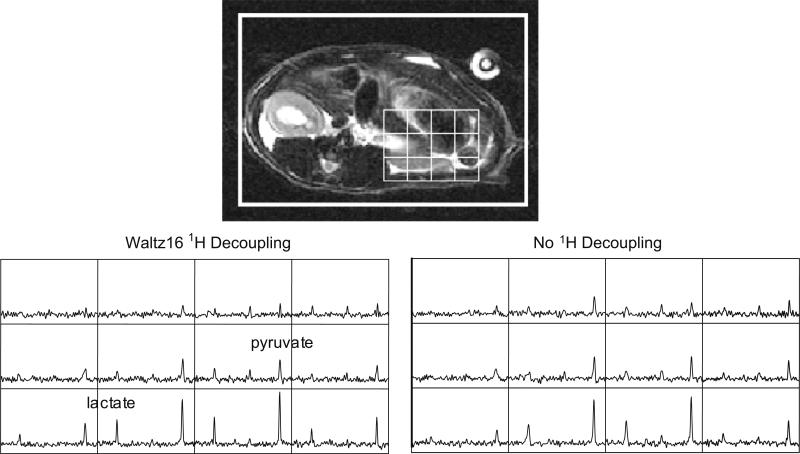
Representative data from 13C MRSI acquired in one normal rat are shown in Fig. 5. In some voxels within the volume imaged, narrower linewidth for [1-13C] lactate was clearly observed in the experiment with 1H decoupling as compare to experiments without decoupling. On average for both animals (average over all voxels), 13C lactate linewidth was 7% narrower (10.9 Hz with decoupling, 11.8 Hz without decoupling) and 13C pyruvate was 4% narrower (12.0 Hz with decoupling, 12.5 Hz without decoupling) for the experiments with decoupling as compared to the experiment without decoupling. The standard deviation of the lactate linewidth was 4.9 Hz and the standard deviation of the pyruvate linewidth was 5.8 Hz over all the voxels in the animals; this high variability was presumably due to the large variation of local B0 within the rat body. A 16% higher peak amplitude SNR (2.06 vs. 1.77) for 13C lactate resonance was also observed for the 1H decoupled experiment, while peak amplitude SNR for 13C pyruvate was 2% lower (3.91 vs. 4.01). For both of the animals in the study, the change in lactate linewidth was statistically significant (p = 0.04), while the change in pyruvate linewidth was not (p = 0.11). And the change in SNR was not significant for either the lactate (p = 0.19) or the pyruvate resonances (0.42).
Fig. 5.
Representaive 13C spectra obtained from a normal rate with and without 1H decoupling following separate boluses of pre-polarized 13C pyruvate. Change in linewidth of the 13C lactate and pyruvate resonances were observed in some voxels with 1H decoupling.
4. Discussion
Proton decoupling for 13C MRS/MRSI experiments can provide higher peak amplitude SNR and help resolve overlapping resonances in some applications. It has been reported, however, that spin-lattice relaxation times of carbonyl carbons measured with fast small tip angle experiments can be substantially reduced by the application of the WALTZ 1H decoupling scheme [8]; and the effect is particularly pronounced when the decoupling sequence irradiation was applied continuously during the experiment. If this phenomenon is also true for pre-polarized carbonyl 13C spins, it would greatly affect one's approach to 13C DNP MRS/MRSI experiments when 1H decoupling is desired.
In this study, the spin-lattice relaxation time of the carbonyl carbon on pre-polarized 13C lactate was estimated by the same fast small tip angle approach mentioned above, with and without the application of WALTZ16 1H decoupling during the experiment. The aim of these measurements was to investigate if proton decoupling negatively affected the T1 relaxation of the pre-polarized spins in vivo (such as [1-13C] lactate). In data acquired at both 14.1 and 3 T, no reduction of T1 was observed when 1H decoupling was applied, although a shortening of the [1-13C] lactate T1 was observed at the higher field as compared to lower field, presumably due to increased influence of chemical shift anisotropy [13].In addition, the T1 for [1-13C] lactate was unchanged when 1H decoupling RF was applied continuously or only during sampling.
This absence of any change in T1 is rationalized as follows. Proton decoupling can alter the apparent relaxation rate, by driving the populations of proton sub-levels from their equilibrium values, provided that dipole-mediated cross-relaxation is strong enough to give rapid cross-relaxation between the carbon and proton magnetizations. In the instance presented in this study, however, the large proton–carbon inter-nuclear distance precludes rapid cross-relaxation (and, in consequence, any large Overhauser enhancement). The comparative isolation which results between proton and carbon magnetizations also ensures that the dipolar cross correlation effects, which are predicted [14] to survive decoupling, will be likewise be of small importance.
Then, given that the carbonyl carbon of lactate interacts but weakly with protons and relaxes slowly, compared to a methyl or methylene carbon, its T1 is expected to be long, and also relatively immune to decoupling effects. The long T1 is in fact essential to the successful use of hyperpolarized substrates in vivo, and is correlated, not incidentally, with the weak JCH scalar coupling, given that both types of coupling—through bond, and through space—grow larger as the inter-nuclear distance decreases. It is expected that the T1 of a methyl carbon should be more sensitive to decoupling than that of the lactate carbonyl, simply because the proximity of the carbon and hydrogen in the methyl group, and the resulting increase in cross-relaxation.
Although the effect of 1H decoupling on [1-13C] pyruvate was not measured, but since the JCH coupling for the [1-13C] pyruvate carbonyl is even less than that of [1-13C] lactate, it is likely that the T1 of [1-13C] pyruvate will not be shortened by 1H decoupling either. It is also not clear what the role of NOE plays in the presence of large non-equilibrium polarization of 13C nuclei, theoretical modeling and more experimental investigation may be necessary to completely understand our observation [15].
This study also demonstrated the feasibility of applying 1H decoupling for hyperpolarized 13C MRSI on a standard clinical 3 T MR system. The spectral resolution of the experiment was limited due to the speed of acquisition required for in vivo hyperpolarized MRSI experiments; this limited the accuracy of the linewidth measurements in these in vivo studies. Both the limited spectral resolution and the various tissue type within the imaging volume (Bo variation) contributed to the large standard deviation of the linewidth measurements. But as demonstrated by the simulation (Fig. 2), one would expect a SNR benefit with 1H decoupling for resonances having linewidths similar to the in vivo lactate carbonyl (10 Hz), even when using short data acquisition times (50 ms). In addition, clear linewidth changes were observed in some of the voxels (Fig. 5), and the overall average linewidth was also narrower for the 1H decoupled experiment. In some voxels, 1H decoupling did not demonstrate an observable effect; again a large slab through the rat body contains various tissue types, the inhomogeneous broadening (T2*) may be the dominant decay mechanism in some voxels while JCH coupling may be making more contribution in other voxels that have higher degree of local B0 homogeneity, hence the differential response to decoupling. In future application involving larger animals and humans, where the regions of interest are confined to an organ or a specific tissue type (brain, liver or prostate), the overall benefit of 1H decoupling should be more clearly observed. Furthermore, improved B1 homogeneity of the 1H coil used and a more appropriate phantom (similar loading compare to the subject) for optimizing decoupling may improve the efficacy of 1H decoupling throughout the region of interest. Adiabatic decoupling pulse sequences were not available on the 3 T MR scanner used in this study, but utilizing such sequences could provide more uniform decoupling B1 over the region of interest and potentially allow 1H decoupling to be performed at lower power (lower SAR).
No significant increase in SNR was observed for either the [1-13C] pyruvate or the [1-13C] lactate resonances in the in vivo MRSI data. However, the change in lactate linewidth was significant. This is consistent with the larger ~3 Hz couplings from methine and methyl protons in lactate compared to the ~1.5 Hz couplings from methyl protons in the [1-13C] pyruvate case. The observed difference in SNR (although not significant) for [1-13C] lactate also was consistent with the simulation (Fig. 2, lower plots) for the linewidth and the readout duration used in these experiments. To better quantify the potential gain in SNR in vivo with 1H decoupling, more studies (larger animals at 3 T or small animals using dedicated animal imager with high performance gradients) and accurate liquid state polarization measurements will need to be performed.
5. Conclusions
The potential and feasibility of performing 1H decoupling for hyperpolarized 13C MRSI experiment in vivo was demonstrated in this study in rats using a clinical 3 T MR system. With application of 1H decoupling using the WALTZ16 sequence, we found no decrease of spin-lattice relaxation time of the pre-polarized substrate, and some improvement in the quality of 13C MRSI data. 1H decoupling for future in vivo applications with pre-polarized 13C substrates in larger animals and humans may be an important consideration for optimized 13C MRSI studies.
Acknowledgment
We gratefully acknowledge the assistance of Dr. Robert Bok for the animal preparation and funding from the NIH (R01 EB007588).
References
- 1.Gruetter R, Adriany G, Choi I, Henry P, Lei H, Oz G. Localized in vivo 13C NMR spectroscopy of the brain. NMR Biomed. 2003;16:313–338. doi: 10.1002/nbm.841. [DOI] [PMC free article] [PubMed] [Google Scholar]
- 2.Ross B, Lin AP, Harris K. Clinical experience with 13C MRS in vivo. NMR Biomed. 2003;16:358–369. doi: 10.1002/nbm.852. [DOI] [PubMed] [Google Scholar]
- 3.Saito M, Matsuda T, Tropp J, Inubushi T, Nakai T. Assessment of the specific absorption rate and calibration of decoupling parameters for proton decoupled carbon-13 MR spectroscopy at 3.0 T. EJRAD. 2005;55:289–293. doi: 10.1016/j.ejrad.2004.11.011. [DOI] [PubMed] [Google Scholar]
- 4.Ardenkjaer-Larsen JH, Fridlund B, Gram A, Hansson G, Hansson L, Lerche MH, Servin R, Thaning M, Golman K. Increase in signal-to-noise ratio of >10, 000 times in liquid-state NMR. Proc. Natl. Acad. Sci. USA. 2003;100(18):10158–10163. doi: 10.1073/pnas.1733835100. [DOI] [PMC free article] [PubMed] [Google Scholar]
- 5.Golman K, Zandt R, Thaning M. Real-time metabolic imaging. PNAS. 2006;103(30):11270–11275. doi: 10.1073/pnas.0601319103. [DOI] [PMC free article] [PubMed] [Google Scholar]
- 6.Kohler SJ, Yen Y, Wolber J, Chen AP, Albers MJ, Bok R, Zhang V, Tropp J, Nelson S, Vigneron DB, Kurhanewicz J, Hurd RE. In vivo 13 carbon metabolic imaging at 3 T with hyperpolarized 13C-1-pyruvate. Magn. Res. Med. 2007;58(1):65–69. doi: 10.1002/mrm.21253. [DOI] [PubMed] [Google Scholar]
- 7.Shaka AJ, Keeler J, Frenkiel T, Freeman R. An improved sequence for broadband decoupling: WALTZ-16. J. Magn. Reson. 1983;53(2):335–338. [Google Scholar]
- 8.Day IJ, Mitchell JC, Snowden MJ, Davis AL. Applications of DNP-NMR for the measurement of heteronuclear T1 relaxation times. J. Magn. Reson. 2007;187:216–224. doi: 10.1016/j.jmr.2007.04.015. [DOI] [PubMed] [Google Scholar]
- 9.Derby K, Tropp J, Hawryszko C. Design and evaluation of a novel dual-tuned resonator for spectroscopic imaging. J. Magn. Reson. 1990;86:645–651. [Google Scholar]
- 10.Patyal BR, Gao J, Williams RF, Roby J, Saam B, Rockwell BJ, Thomas RJ, Stolarski DJ, Fox PT. Longitudinal relaxation and diffusion measurements using magnetic resonance signals from laser-hyperpolarized 129Xe nuclei. J. Magn. Reson. 1997;126:58–65. doi: 10.1006/jmre.1997.1159. [DOI] [PubMed] [Google Scholar]
- 11.Cunningham CH, Chen AP, Albers MJ, Kurhanewicz J, Hurd RE, Yen Y, Nelson SJ, Vigneron DB. Double spin–echo sequence for rapid spectroscopic imaging of hyperpolarized 13C. J. Magn. Reson. 2007;287(2):357–362. doi: 10.1016/j.jmr.2007.05.014. [DOI] [PubMed] [Google Scholar]
- 12.Chen AP, Albers P, Cunningham CH, Kohler SJ, Yen Y, Hurd RE, Tropp J, Bok R, Nelson SJ, Kurhanewicz J, Vigneron DB. Hyperpolarized C-13 spectroscopic imaging of the TRAMP mouse at 3 T-initial experience. Magn. Res. Med. 2007;58(6):1099–1106. doi: 10.1002/mrm.21256. [DOI] [PubMed] [Google Scholar]
- 13.Levy GC, Edlund U. Carbon-13 chemical shift anisotropy relaxation in organic compounds. J. Am. Chem. Soc. 1975;97(17):5031–5032. [Google Scholar]
- 14.Werbelow LG, Grant DM. Proton-decoupled carbon-13 relaxation in 13CH2 and 13CH3 spin systems. J. Chem. Phys. 1975;63(11):4742–4748. [Google Scholar]
- 15.Merritt ME, Harrison C, Mander W, Malloy CR, Sherry AD. Dipolar cross-relaxation modulates signal amplitudes in the 1H NMR spectrum of hyperpolarized [13C]formate. J. Magn. Reson. 2007;189(2):280–285. doi: 10.1016/j.jmr.2007.09.011. [DOI] [PMC free article] [PubMed] [Google Scholar]


