

Abstract
The nematode Caenorhabditis elegans is a unique whole animal model system for identifying small molecules with in vivo anti-infective properties. C. elegans can be infected with a broad range of human pathogens, including Enterococcus faecalis, an important human nosocomial pathogen with a mortality rate of up to 37% that is increasingly acquiring resistance to antibiotics. Here, we describe an automated, high throughput screen of 37,200 compounds and natural product extracts for those that enhance survival of C. elegans infected with E. faecalis. The screen uses a robot to accurately dispense live, infected animals into 384-well plates, and automated microscopy and image analysis to generate quantitative, high content data. We identified 28 compounds and extracts that were not previously reported to have antimicrobial properties, including 6 structural classes that cure infected C. elegans animals but do not affect the growth of the pathogen in vitro, thus acting by a mechanism of action distinct from antibiotics currently in clinical use. Our versatile and robust screening system can be easily adapted for other whole animal assays to probe a broad range of biological processes.
INTRODUCTION
Identifying new classes of antimicrobial drugs is imperative due to the growing threat of antibiotic-resistant bacteria in both nosocomial and community settings. Traditionally, new antibiotics are discovered using assays that measure growth inhibition or killing of a microbial pathogen (1), but the rate of new antibiotic discovery using this approach has been disappointingly slow (1–5). This is partly because traditional in vitro and whole cell drug screens are inefficient, yielding compounds that are non-specifically toxic or compounds with the same mechanism of action as known antibiotics. Antibiotics currently in use inhibit about 40 bacterial targets, all of which affect the growth or survival of the bacteria (6).
Previously, we developed a unique approach to the discovery of novel antimicrobials that is based on the idea of screening for anti-infective properties of drugs in an environment that better approximates an infected human host than current in vitro models. This was achieved by assaying survival of a live model host organism, the nematode Caenorhabditis elegans, infected with the human opportunistic pathogen Enterococcus faecalis (7). The use of live, infected whole animals to screen for antimicrobial compounds advances the established paradigm for identifying antibiotics in several key ways. First, the whole animal approach directly assesses drug efficacy in vivo, discarding compounds toxic to the host early in the analysis. Also, unlike conventional in vitro screens, this strategy can identify compounds that target the processes by which microbes establish infections, specifically mechanisms that are only manifest when the complex host/pathogen relationship is intact. Furthermore, because possible targets such as those related to pathogen virulence or host immunity are not likely to be essential genes, they may not be subject to a high level of selection pressure in the environment, and may not be as susceptible to the development of drug resistance as essential targets.
Previously, we completed a small scale, manual screen of 6,000 compounds and 1,136 natural product extracts that identified 16 compounds and extracts that promoted nematode survival after exposure to E. faecalis (7). Several of these cure C. elegans of a bacterial infection in vivo, but do not affect the free-living microbe, indicating that whole animal screening can identify compounds with novel targets. Although successful, our small scale C. elegans screen involved many tedious manual manipulations that introduced variability and represented hours of labor, including many spent screening individual nematodes by eye at a microscope. Here, we describe the development of an automated C. elegans screening system that decreases manual labor and experimental variability, thereby increasing the throughput of screening and accuracy of the data. We accomplished this through miniaturization to a 384-well plate format compatible with high throughput chemical screens, the use of a large particle sorter to dispense living worms into the wells, imaging of wells with automated microscopy, and the development of software to quantify worm survival from the images. Using these methods, we screened approximately 37,000 small molecules and natural product extracts for those that increased survival of C. elegans infected with E. faecalis. We identified 28 compounds that have confirmed curing activity but which were not known antibiotics, structural analogs of antibiotics, or compounds with documented antimicrobial activity. Of these 28 compounds, 6 are of high interest because they inhibit pathogen growth in vivo in a live host but do not significantly inhibit microbial growth in vitro, suggesting that they may be functioning as virulence inhibitors or host immune enhancers in the C. elegans model and thus, distinct from traditional antibiotics. In addition, with the automation of a C. elegans screen for anti-infectives, we have developed a scalable and adaptable system that can be applied to a broad range of whole animal screens.
RESULTS AND DISCUSSION
High throughput assay development
Our goal was to identify anti-infective compounds through a quantitative, high throughput C. elegans screen, based on our previous, small scale assay (7). To improve the screening rate and accuracy, we automated several steps (Fig. 1a). First, we used a large particle sorter to dispense an exact number of infected animals into each well of a 384-well compound plate. Because human screening of the plates is too slow, labor intensive and subjective for high throughput screening, we developed a staining method to distinguish live from dead worms. We stained the worms with SYTOX Orange, which is excluded by living cells but readily enters cells with damaged membranes, specifically staining dead worms (8). Because the SYTOX dye also stains the bacteria in the well, we added a wash step to remove the bacteria before staining. Next, we used an automated microscope to acquire an image of the SYTOX fluorescence and a bright field image of each well. We then quantified worm survival in an automated manner by adapting the open-source cell image analysis program CellProfiler (9). We also created a web-based interface for viewing the original images and CellProfiler outputs, as well as to perform additional analyses (Supplementary Fig. 1). The availability of the original images and the deposition of our data into the publicly available ChemBank database (10) provide a powerful resource for future data mining.
Figure 1.

Automated, high throughput C. elegans infection screen. a) Screening scheme. b) Major steps of CellProfiler image analysis. The original SYTOX fluorescence and bright field images of untreated and ampicillin-treated wells, as well as images after CellProfiler manipulations and data from the analysis are shown.
To create an automated image analysis system robust enough for high throughput screening, we developed a complex CellProfiler pipeline consisting of 29 steps to analyze images. The major steps of this pipeline are shown in Fig. 1b (see also Supplementary Method 1). The general approach was to measure the area of each well that was SYTOX-positive in the fluorescence image and normalize by the total area occupied by all worms, as quantified in the bright field image. This required illumination correction to flatten lighting abnormalities, adaptive thresholding, and size- and contrast-based filters and masks to exclude debris and other artifacts. By calculating the ratio of fluorescent area to total area, we were able to accurately quantify worm death in each well. As shown in Fig. 1b, when 12 of the 14 worms are dead in a well as scored manually by shape (live worms are sinusoidal whereas dead worms are rigid rods), the ratio of fluorescent area to total worm area is 0.78. In a well where the worms are rescued by ampicillin treatment, 3 of the 14 worms are dead and the ratio obtained by CellProfiler analysis is correspondingly low at 0.12.
The SYTOX analysis method was sufficiently accurate for automated, high throughput screening (Fig. 2a). In an assay with duplicate 384-well plates where half of the wells contained 21µg/ml ampicillin and the other half contained DMSO as a mock treatment, there was no overlap in scores between the mock (range = 0 to 0.3) and antibiotic (range = 0.85 to 0.95) treatment. The Z’-factor for the assay was 0.61, which denotes that the mean scores of the control populations are separated by several standard deviations and that the screening method is extremely robust (11).
Figure 2.

Robust screening methods. a) A large separation is seen between the fraction dead of ampicillin and mock-treated control wells from 2 control plates. Red squares are values for mock-treated control wells and the blue circles are for ampicillin-treated control wells. b) Linear regression plot correlating manually scored data with CellProfiler scored data. Worm survival determined by the automated method correlates well with the manual method in a simple regression line with the R2 = 0.98. c), d), e) and f) zscore values for compounds in 4 libraries (c=Analyticon, d=TimTec, e=ChemDiv, and f=SPBio). Blue circles represent z-scores of compounds and the positive hits from manual screening are highlighted as red squares. The false negative compounds that were hits by manual screening but had z-scores near 0 are labeled as red numbers.
We also compared the accuracy of the automated image analysis method to manual, body shape-based scoring. Scoring the same set of control images with the two methods, we found that in general, worm survival determined by the automated method correlates well with the manual method in a simple regression line with the R2 = 0.98 (Fig. 2b). We observed a small fraction of worms that appeared dead based on their body shape but did not stain with SYTOX (one example is seen in the ampicillin-treated well in Fig. 1b), and another small fraction of sinusoidal worms that were SYTOX-stained. These discrepancies may be due to variability in SYTOX staining, autofluorescence that occurs in sick or dying worms, or SYTOX staining of dying cells in worms that are still alive. In the case of SYTOX staining of live worms, an interesting possibility is that particular compounds may increase the membrane permeability of the worms to the dye. To make the automated analysis directly comparable to the more conventional shape-based scoring method would require algorithms to identify and measure the shape of individual worms. We have begun to develop such algorithms, which would also enable screens for a wide array of phenotypes, such as changes in morphology or fluorescence localization.
Currently, a set of 30 384-well plates requires 8 hours of worm dispensing. The same set of 30 plates also requires a full day to image and another day for image analysis. Scoring the plates using the automated SYTOX live/dead assay is about five times faster than scoring the plates manually. Thus, this versatile and robust automated whole animal screening system accommodates ~9,000 compounds per week, per researcher, thereby enabling screens that were previously not feasible due to the amount of labor and time required for manual scoring.
Although there have been examples of manual and semi-automated small molecule screens with C. elegans and other model organisms (12–14), our system is unique in its adaptability and scalability. All the instrumentation is commercially available and the software is open-source (www.CellProfiler.org). The methodology is immediately applicable to C. elegans screens with a live or dead readout, including screens to identify compounds that have anti-infective activity against other pathogens, that extend lifespan, or that kill pathogenic nematodes. The approach can also be easily adapted for a broad range of small molecule screens using whole animals to probe a variety of biological processes, for example, to identify modifiers of gene expression or behavior that are linked to changes in fluorescence.
High throughput screen
Using these methods, we screened approximately 54,000 wells in duplicate from multiple compound collections, including known bioactives, natural product extracts, purified natural products, or synthetic compounds (Table 1). Because several of the compound collections contained identical compounds, we screened 33,931 unique compounds and 3,283 natural product extracts. For each of the 17 independent batches of plates, we included two 384-well plates that contained only the mock treatment. This enabled the Broad Chemical Biology Platform to generate a z-score value for each sample, which represents the number of standard deviations the sample well ratio is apart from the ratio of the mock-treated wells (10). Each screening assay also included duplicate positive and negative control plates in which half of the wells contained ampicillin or DMSO (mock) treatment. A mock-treated well should have a z-score of zero and a well with increased worm survival should have a negative z-score because it has a lower ratio of dead to total area. The screen average for mock-treated wells was −0.14 with a standard deviation of 0.71. For ampicillin-treated wells, the average was −8.70 with a standard deviation of 0.61.
Table 1.
Compound libraries screened and the number of members from each library identified as having curing activity in C. elegans infected with E. faecalis.
| Compound Library | # wells screened | # hits | hit rate |
|---|---|---|---|
| Bioactives | 2,000a | 69 | 3.50%a |
| Natural product extracts | 3,283 | 4 | 0.12% |
| Analyticon purified natural products | 2,477 | 18 | 0.65% |
| Diversity-Oriented Synthesis (DOS) | 11,666 | 1 | 0.01% |
| ChemBridge kinases | 8,240 | 21 | 0.27% |
| Commercial compounds: | |||
| ChemDiv | 11,616 | 12 | 0.10% |
| TimTec | 8,512 | 7 | 0.08% |
| MayBridge | 5,448 | 3 | 0.06% |
| ChemBridge | 704 | 1 | 0.14% |
| Total | 53,946b | 136 | 0.24%c |
approximate number due to redundancies
33,931 unique compounds and 3,283 extracts
average hit rate
In the primary screen, a composite z-score was calculated from the two replicates for each compound. The composite z-scores were sorted in ascending order and approximately the top 1% of the compounds was selected for confirmation by manual analysis of the original images based on body shape, a reasonable number to score by eye. “False-positive” wells excluded from further analysis included cases with low fluorescence signal with straight body position, debris or compound precipitation that was quantified as total worm area, the absence of worms in the well due to inaccurate worm sorting, poor image quality due to well abnormalities, or cases where only one of the two duplicate wells showed increased survival.
To determine the false negative rate of the automated analysis method, we manually screened a random set of 6,144 bright-field images for one of the library collections. We identified 18 wells that showed increased survival for both duplicate wells (Fig. 2c). 16 of these wells were also identified by the automated analysis method. The 2 wells that were not identified by the automated analysis, corresponding to compounds #1341 and #2275, were missed because the worms with sinusoidal, live body position were SYTOX-positive with corresponding z-scores of 0.3 and 0.5. A similar number of bright-field images for other compound libraries were also screened and no more false negatives were identified, suggesting that they occur at a very low frequency (Fig. 2d, e, f).
Analysis of novel identified anti-infectives
The screen identified 132 compounds and 4 extracts that increased worm survival, with an overall hit rate of approximately 0.25% (Table 1 and Supplementary Figure 2). Among the 136 primary hits, we identified 16 pairs of duplicate compounds from different compound libraries, indicating that the assay is consistent between experiments. However, we also found 5 hit compounds among the 136 primary hits that had duplicates in other libraries that were not identified as hits. In general, these latter 5 hits had relatively weak activity. Of the primary hits, 119 compounds and extracts were available for cherry picking and retesting in a secondary screen. 108 of the 119 compounds and extracts (91%) retested as positive in a second experiment. Of these, 62 are known antibiotics and 18 others have reported antimicrobial properties or are structural analogs of known antibiotics. These 80 known or suspected antibiotics include 15 of the 16 pairs of duplicate compounds. Of the remaining 27 unique hits, we were able to purchase 21 compounds for further testing.
We determined the Minimum Inhibitory Concentrations (MIC) of the 21 commercially available compounds in vitro with E. faecalis and performed dose response time course experiments to determine the kinetics of their activity in the infection assay (Table 2 and Supplementary Fig. 3, 4). We found that 9 of the 21 compounds cure C. elegans of an E. faecalis infection at a significantly lower concentration than is necessary to inhibit the growth of the pathogen in vitro, the hallmark of an anti-infective compound that targets pathogen virulence or host immunity. Four of the 9 compounds share a structural backbone (structural group 1 of Table 2 and Supplementary Fig. 4) and 3 of the remaining 5 anti-infective compounds (groups 2, 3, and 4 of Table 2 and Supplementary Fig. 4) each had another compound with a shared backbone that was identified as having curing activity. Supplementary Fig. 3 shows dose response curves illustrating the curing kinetics for a representative compound from each of the 6 anti-infective structural classes. One other compound (structural group 7 of Supplementary Fig. 4) also exhibited anti-infective properties, but because the curing activity was weak, was not included in subsequent studies.
Table 2.
Representative structures for the 6 anti-infective structural groups identified in the screen and their corresponding MIC and minimum EC values.
| Group | Compound Structure | MIC | EC |
|---|---|---|---|
| 1 | 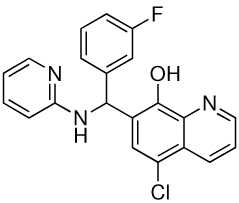 |
25 | 1.56 |
| 2 | 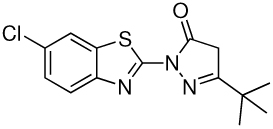 |
1.56 | 0.39 |
| 3 | 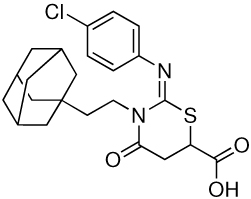 |
6.25 | 0.39 |
| 4 | 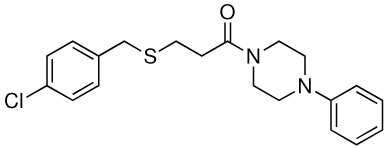 |
>100 | 25 |
| 5 | 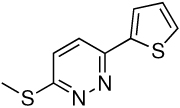 |
>100 | 3.13 |
| 6 | 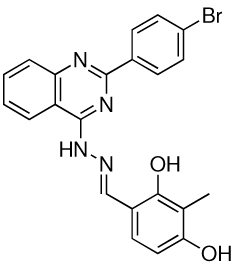 |
>100 | 3.13 |
Interestingly, 8 compounds, representing 2 structural classes (groups 1 and 2 of Table 2 and Supplementary Fig. 4), are similar to two structural groups that were identified previously in a screen for inhibitors of Pseudomonas aeruginosa biofilm development (15). Also, another structural group (group 3 in Table 2 and Supplementary Fig. 4) was identified in a screen for O-GlcNAc transferase inhibitors (16). The activity of these small molecules in other screens suggests a mechanism by which the compounds promote worm survival in our assay. Intriguingly, inhibition of biofilm formation and eradication of established biofilms have been postulated to be mechanisms for anti-virulence factors (17, 18), and the discovery of biofilm inhibitors in our screen suggests that such factors may be able to cure infections in an in vivo setting. Furthermore, biofilm blockers may dramatically change clinical treatment regimens since persistant pathogen infections normally present in biofilms are extremely difficult to eradicate with conventional antibiotics (17, 18). Importantly, we have also identified 3 novel classes of compounds (groups 4, 5 and 6 in Table 2 and Supplementary Fig. 4) that may represent small molecules with novel targets in pathogenesis and immunity.
Our high content screen of ~37,000 compounds identified 6 structural classes of compounds that we classify as anti-infectives rather than traditional antibiotics because they cure infected C. elegans animals without affecting the growth of the pathogen in vitro. The screen also identified many known antibiotics, antimicrobials and compounds with known anti-virulence activity, which serves as a proof of principle for the screen. Furthermore, the identification of three novel structural classes of compounds validates that high throughput, whole organism C. elegans screening will reveal compounds acting through novel mechanisms of action. In addition, the whole animal screening system we developed makes possible the direct study of complex biological processes such as growth, reproduction, aging and immunity, which would not be possible in vitro or with a cell-based system. Despite the challenges, our discoveries indicate that screening in a living animal confers strong advantages, with profound implications for drug discovery efforts as well as for basic biological research. We are using the novel small molecules identified in the screen to probe bacterial pathogenesis and C. elegans innate immunity, while also identifying the targets of these compounds and investigating their clinical relevance.
MATERIALS AND METHODS
Infection assay for primary compound screen
glp-4(bn2);sek-1(km4) mutant worms were grown to gravid adult stage (19, 20). 1,000 worms at the L1 stage were grown for 5.2 days at 15°C on 9 cm plates of SK agar media (21) spread with a lawn of E. coli strain HB101. Embryos from the gravid adults were isolated by a previously described hypochlorite method (22) and hatched at 15°C for 2 days. 4,500 of the L1 hatchlings were grown on each 9 cm plate of SK-NS agar (SK media with 62.5 U/ml nystatin and 100 µg/ml streptomycin) and with lawns of E. coli HB101. These worms were grown at 25°C for 52 hrs to generate sterile, young adults. A culture of E. faecalis MMH594 was grown in BHI broth (BD Difco) with 80 µg/ml kanamycin at 37°C for 6 hrs and 100 µl of the culture were spread onto each 9 cm plate of BHI agar containing 80 µg/ml kanamycin. Lawns of E. faecalis were grown at 25°C for 16 hrs and transferred to 15°C for 8 hrs.
Sterile adult worms were resuspended in M9 buffer (23) and washed two times with M9 in a 1:10 ratio to remove E. coli. 8,000 worms were pipetted onto each lawn of E. faecalis and incubated 15 hrs at 15°C. After infection, the worms were resuspended in M9 and used as described below. 384-well plates (Corning #3712) were filled with 55 µl media (see below) using a Thermo Scientific Multidrop Combi reagent dispenser. 0.3 µl of compound in DSMO were pin transferred into each well using a CyBio CyBi-Well vario transfer system. The plates were agitated using an Eppendorf MixMate at 1,800 rpm for 15 sec. Using the Union Biometrica Complex Object Parametric Analyzer and Sorter (COPAS) BioSort worm sorter according to manufacturer’s protocols, 15 of the infected worms were transferred to each well in a total volume of approximately 15 µl. Total volume per well is 70 µl/well with a final composition of the media being 20% BHI, 60% M9 buffer, 80 µg/ml kanamycin, 62.5 U/ml nystatin, 1% DMSO, and 19% sheath solution (Union Biometrica Part # 300–5101–000). Plates were vortexed for 5 sec, centrifuged at 1000×g for 10 sec, and sealed with gas permeable membranes (BreathEasy, Diversified). Plates were placed in a single layer on the top shelves in a 26.3°C incubator at 85% relative humidity (RH) and incubated without agitation for 5 days.
After 5 days, the bacteria and liquid media in the assay plates were removed as described below. First, the bacteria were resuspended by shaking on the MixMate for 15 sec at 1,800 rpm, the sealing membrane was removed, and the worms were allowed to settle to the bottom of the wells for 3 min. Using the BioTek ELx405 microplate washer with the BioStack plate handling system according to manufacturer’s guidelines, approximately 70% of the liquid in the wells were aspirated. Then, 65 µl of M9 buffer was dispensed into the wells at maximum speed to resuspend the well contents. The worms were allowed to settle for at least 3 minutes, then three more cycles of aspiration, dispensing and settling were performed. Lastly, one final round of aspiration was performed leaving approximately 20 µl of liquid in the well. 70 µl of 0.9 µM SYTOX Orange (Invitrogen) in M9 was dispensed into each well with the Combi dispenser to yield a final concentration of 0.7 µM of dye. The plates were sealed with gas permeable membranes and incubated at 20°C and 80% RH for 16 hrs. Using a Molecular Devices Discovery-1 microscope with a transmitted light module and a 2× low magnification objective running MetaExpress software, images showing the entire well were captured using a TRITC filter set or with bright field transmitted light.
The screen was performed using duplicate plates. For every experiment, one set of duplicate plates consisted entirely of mock treatment (DMSO only). Another set of duplicate plates each contained 192 wells of Ampicillin at a final concentration of 21 µg/ml as a positive control and 192 wells of mock treatment as the negative control. The primary screen was performed with 17 independent infection assays where a total of 33,931 compounds and 3,283 natural product extracts were screened at the Broad Institute’s Chemical Biology Platform Screening Facility.
Data storage and CellProfiler analysis
All images acquired at the Broad Institute were transferred to and stored on a dedicated Dell PowerEdge 2950 server attached directly to 15 1TB SATA hard drives at Massachusetts General Hospital. Data analysis was carried out on the Dell 2950 server with CellProfiler (www.cellprofiler.org) using a customized pipeline (Supplementary Method 1) and the resulting processed images and associated data were loaded into a custom Oracle database developed specifically for this project.
Dose response time courses
The infection assay was performed essentially as described above, except SYTOX staining was not used. Instead, brightfield images of the wells were acquired at daily time points and scored manually for worm survival by analyzing worm body positioning. The Effective Concentrations (EC) were calculated as the concentrations at which the dose response curves of a compound (converted to Kaplan-Meier survival plots) were significantly different from the mock-treated sample with a p-value<0.05, according to the logrank statistical analysis. All purchased compounds used in secondary assays were confirmed for identity and purity by liquid chromatography/mass spectrometry (Supplementary Method 2).
Scoring control plates for manual vs. automated methods comparison
Synchronized young adult worms were grown on E. coli HB101 on SK-NS agar plates at 25°C as described above. To generate dead worms, the worms were washed with M9 buffer and then incubated in M9 buffer at 42°C for 2 hr. The COPAS Biosort was used to transfer 15 live or dead worms into a 384-well plate containing M9 buffer and 0.7 µM SYTOX Orange. The worms were incubated for 4 hr at 22°C, fluorescence and bright field images were taken for each well, and images were scored as described.
MIC assays
A culture of E. faecalis MMH594 was grown overnight in BHI broth to stationary phase at 37°C with aeration. The culture was diluted to an approximate density of 2 × 10⁻⁴ CFU/ml in worm infection media (20% BHI, 80% M9 buffer). 12.5 µl of the bacterial culture dilution was inoculated into 384-well plates containing 12.5 µl of 2-fold serial dilutions of the compounds. All wells had a final DMSO concentration of 1%. Plates were incubated at 37°C for 15 hr and scored by eye for bacterial growth.
Supplementary Material
This material is available free of charge via the Internet.
ACKNOWLEDGEMENTS
We thank the Broad Institute of MIT and Harvard Chemical Biology Platform screening facility staff including L. Verplank, A. Stern, J. Burbank, S. Norton, M de Silva, K. Rose, M. Bliss-Moreau, and N. Tolliday for assistance with chemical screening and many helpful discussions. We thank T. R. Jones of the Broad Institute Imaging Platform for contributions to image analysis algorithms. This work was funded by a grant from the Broad Institute of Harvard and MIT and by NIH grant AI072508 and in part with Federal funds from the National Cancer Institute's Initiative for Chemical Genetics, National Institutes of Health, under Contract No. N01-CO-12400. AEC was supported by a Novartis Fellowship of the Life Sciences Research Foundation. The content of this publication does not necessarily reflect the views or policies of the Department of Health and Human Service, nor does mention of trade names, commercial products or organizations imply endorsement by the U.S. Government.
LITERATURE CITED
- 1.Walsh C. Where will new antibiotics come from? Nat Rev Microbiol. 2003;1:65–70. doi: 10.1038/nrmicro727. [DOI] [PubMed] [Google Scholar]
- 2.Boggs AF, Miller GH. Antibacterial drug discovery: is small pharma the solution? Clin Microbiol Infect. 2004;10 Suppl 4:32–36. doi: 10.1111/j.1465-0691.2004.1008.x. [DOI] [PubMed] [Google Scholar]
- 3.Projan SJ, Shlaes DM. Antibacterial drug discovery: is it all downhill from here? Clin Microbiol Infect. 2004;10 Suppl 4:18–22. doi: 10.1111/j.1465-0691.2004.1006.x. [DOI] [PubMed] [Google Scholar]
- 4.Schmid MB. Seeing is believing: the impact of structural genomics on antimicrobial drug discovery. Nat Rev Microbiol. 2004;2:739–746. doi: 10.1038/nrmicro978. [DOI] [PubMed] [Google Scholar]
- 5.Silver LL. A retrospective on the failures and successes of antibacterial drug discovery. IDrugs. 2005;8:651–655. [PubMed] [Google Scholar]
- 6.Bumann D. Has nature already identified all useful antibacterial targets? Curr Opin Microbiol. 2008;11:387–392. doi: 10.1016/j.mib.2008.08.002. [DOI] [PubMed] [Google Scholar]
- 7.Moy TI, Ball AR, Anklesaria Z, Casadei G, Lewis K, Ausubel FM. Identification of novel antimicrobials using a live-animal infection model. Proc Natl Acad Sci U S A. 2006;103:10414–10419. doi: 10.1073/pnas.0604055103. [DOI] [PMC free article] [PubMed] [Google Scholar]
- 8.Gill MS, Olsen A, Sampayo JN, Lithgow GJ. An automated high-throughput assay for survival of the nematode Caenorhabditis elegans. Free Radic Biol Med. 2003;35:558–565. doi: 10.1016/s0891-5849(03)00328-9. [DOI] [PubMed] [Google Scholar]
- 9.Carpenter AE, Jones TR, Lamprecht MR, Clarke C, Kang IH, Friman O, Guertin DA, Chang JH, Lindquist RA, Moffat J, Golland P, Sabatini DM. CellProfiler: image analysis software for identifying and quantifying cell phenotypes. Genome Biol. 2006;7:R100. doi: 10.1186/gb-2006-7-10-r100. [DOI] [PMC free article] [PubMed] [Google Scholar]
- 10.Seiler KP, George GA, Happ MP, Bodycombe NE, Carrinski HA, Norton S, Brudz S, Sullivan JP, Muhlich J, Serrano M, Ferraiolo P, Tolliday NJ, Schreiber SL, Clemons PA. ChemBank: a small-molecule screening and cheminformatics resource database. Nucleic Acids Res. 2008;36:D351–D359. doi: 10.1093/nar/gkm843. [DOI] [PMC free article] [PubMed] [Google Scholar]
- 11.Zhang J. A Simple Statistical Parameter for Use in Evaluation and Validation of High Throughput Screening Assays. Journal of Biomolecular Screening. 1999;4:67–73. doi: 10.1177/108705719900400206. [DOI] [PubMed] [Google Scholar]
- 12.Kwok TC, Ricker N, Fraser R, Chan AW, Burns A, Stanley EF, McCourt P, Cutler SR, Roy PJ. A small-molecule screen in C. elegans yields a new calcium channel antagonist. Nature. 2006;441:91–95. doi: 10.1038/nature04657. [DOI] [PubMed] [Google Scholar]
- 13.Petrascheck M, Ye X, Buck L. An antidepressant that extends lifespan in adult Caenorhabditis elegans. Nature. 2007;450:553–556. doi: 10.1038/nature05991. [DOI] [PubMed] [Google Scholar]
- 14.Tran TC, Sneed B, Haider J, Blavo D, White A, Aiyejorun T, Baranowski TC, Rubinstein AL, Doan TN, Dingledine R, Sandberg EM. Automated, quantitative screening assay for antiangiogenic compounds using transgenic zebrafish. Cancer Res. 2007;67:11386–11392. doi: 10.1158/0008-5472.CAN-07-3126. [DOI] [PubMed] [Google Scholar]
- 15.Junker LM, Clardy J. High-throughput screens for small-molecule inhibitors of Pseudomonas aeruginosa biofilm development. Antimicrob Agents Chemother. 2007;51:3582–3590. doi: 10.1128/AAC.00506-07. [DOI] [PMC free article] [PubMed] [Google Scholar]
- 16.Gross BJ, Kraybill BC, Walker S. Discovery of O-GlcNAc transferase inhibitors. J Am Chem Soc. 2005;127:14588–14589. doi: 10.1021/ja0555217. [DOI] [PubMed] [Google Scholar]
- 17.Marra A. Targeting virulence for antibacterial chemotherapy: identifying and characterising virulence factors for lead discovery. Drugs R D. 2006;7:1–16. doi: 10.2165/00126839-200607010-00001. [DOI] [PubMed] [Google Scholar]
- 18.Cegelski L, Marshall GR, Eldridge GR, Hultgren SJ. The biology and future prospects of antivirulence therapies. Nat Rev Microbiol. 2008;6:17–27. doi: 10.1038/nrmicro1818. [DOI] [PMC free article] [PubMed] [Google Scholar]
- 19.Tanaka-Hino M, Sagasti A, Hisamoto N, Kawasaki M, Nakano S, Ninomiya-Tsuji J, Bargmann CI, Matsumoto K. SEK-1 MAPKK mediates Ca2+ signaling to determine neuronal asymmetric development in Caenorhabditis elegans. EMBO Rep. 2002;3:56–62. doi: 10.1093/embo-reports/kvf001. [DOI] [PMC free article] [PubMed] [Google Scholar]
- 20.Beanan MJ, Strome S. Characterization of a germ-line proliferation mutation in C. elegans. Development. 1992;116:755–766. doi: 10.1242/dev.116.3.755. [DOI] [PubMed] [Google Scholar]
- 21.Tan MW, Mahajan-Miklos S, Ausubel FM. Killing of Caenorhabditis elegans by Pseudomonas aeruginosa used to model mammalian bacterial pathogenesis. Proc Natl Acad Sci U S A. 1999;96:715–720. doi: 10.1073/pnas.96.2.715. [DOI] [PMC free article] [PubMed] [Google Scholar]
- 22.Powell JR, Ausubel FM. Models of Caenorhabditis elegans infection by bacterial and fungal pathogens. Methods Mol Biol. 2008;415:403–427. doi: 10.1007/978-1-59745-570-1_24. [DOI] [PubMed] [Google Scholar]
- 23.Stiernagle T. Maintenance of C. elegans. In: WormBook, editor. The C. elegans Research Community. 2006. [DOI] [PMC free article] [PubMed] [Google Scholar]
Associated Data
This section collects any data citations, data availability statements, or supplementary materials included in this article.
Supplementary Materials
This material is available free of charge via the Internet.