

Abstract
Dystonia is a brain disorder characterized by sustained involuntary muscle contractions. It is typically inherited as an autosomal dominant trait with incomplete penetrance. While lacking clear degenerative neuropathology, primary dystonia is thought to involve microstructural and functional changes in neuronal circuitry. In the current study, we used magnetic resonance diffusion tensor imaging and probabilistic tractography to identify the specific circuit abnormalities that underlie clinical penetrance in carriers of genetic mutations for this disorder. This approach revealed reduced integrity of cerebellothalamocortical fiber tracts, likely developmental in origin, in both manifesting and clinically nonmanifesting dystonia mutation carriers. In these subjects, reductions in cerebellothalamic connectivity correlated with increased motor activation responses, consistent with loss of inhibition at the cortical level. Nonmanifesting mutation carriers were distinguished by an additional area of fiber tract disruption situated distally along the thalamocortical segment of the pathway, in tandem with the proximal cerebellar outflow abnormality. In individual gene carriers, clinical penetrance was determined by the difference in connectivity measured at these two sites. Overall, these findings point to a novel mechanism to explain differences in clinical expression in carriers of genes for brain disease.
Introduction
Many genetic disorders are inherited as autosomal dominant traits with reduced penetrance. However, it is largely unknown why some carriers of mutant genes for disease exhibit clinical manifestations, while other carriers of the same mutation do not. Primary dystonia, a chronic brain disorder characterized by sustained muscle contractions and involuntary movements, is a typical example of this pattern of inheritance. The most common inherited form of this disease is associated with the DYT1 mutation on chromosome 9q34, representing a GAG deletion within the coding area for torsinA (Breakefield et al., 2008). The less frequent DYT6 mutation is linked to the THAP1 gene on chromosome 8q21-22 (Fuchs et al., 2009). Both DYT1 and DYT6 are autosomal dominant mutations with incomplete penetrance. Both genotypes are associated with symptom onset in late childhood or adolescence, and exhibit similar clinical phenotypes.
The histopathological basis for primary dystonia remains unknown, although the disease is generally regarded as a disorder of the basal ganglia and its efferent connections to the thalamus and brainstem (Vitek, 2002; DeLong and Wichmann, 2007). However, experimental animal studies have also implicated the cerebellum in the pathophysiology of dystonia (LeDoux et al., 1998; LeDoux and Lorden, 2002; Pizoli et al., 2002; Neychev et al., 2008). Indeed, cerebellar abnormalities have been consistently identified in functional imaging studies of DYT1 and DYT6 carriers (Eidelberg et al., 1998; Trošt et al., 2002; Carbon et al., 2008b; Carbon and Eidelberg, 2009). Nonetheless, these metabolic changes do not differentiate affected subjects from those without clinical manifestations.
Another approach to delineate the circuit abnormalities that underlie dystonia has used magnetic resonance (MR) diffusion tensor imaging (DTI) in mutation carriers. DTI studies have revealed microstructural abnormalities in DYT1 and DYT6 carriers involving localized reductions in fractional anisotropy (FA), a measure of axonal integrity and coherence, in white matter pathways subjacent to the sensorimotor cortex (SMC) and in the dorsal pons (Carbon et al., 2004, 2008a; Delmaire et al., 2009). The latter change was found to be greater in manifesting (MAN) than in nonmanifesting (NM) carriers. Nonetheless, this regional measure of altered microstructure failed to accurately classify individual gene-positive subjects according to clinical penetrance. Moreover, a major limitation of these studies has been the inability to localize the microstructural changes to specific neuroanatomical fiber tracts.
In this study, we used high-field DTI to study a new cohort of DYT1 and DYT6 mutation carriers. The resulting images were analyzed using probabilistic tractography (Behrens et al., 2003, 2007) to generate connectivity maps of the cerebellothalamocortical (CbTC) pathways. Abnormalities in fiber tract integrity were identified at the voxel level for MAN and NM carriers and correlated with regional cerebral blood flow (rCBF) recorded in the same subjects during movement and rest. These studies revealed the presence of discrete alterations in CbTC connectivity, which were closely related to regional brain function. Moreover, the observed CbTC tract changes were predictive of penetrance in individual gene carriers.
Materials and Methods
Subjects.
The following groups of subjects were studied: (1) MAN dystonia mutation carriers [n = 12: 7 DYT1/5 DYT6; 5 male (M)/7 female (F), age 42.2 ± 15.2 (mean ± SD)]; (2) NM dystonia mutation carriers (n = 8: 4 DYT1/4 DYT6; 5 M/3 F, age 44.0 ± 17.4); (3) healthy volunteer subjects (n = 8: 5 M/3 F, age 40.3 ± 19.0). Given the very low prevalence of the DYT1 and DYT6 mutations in the general population, the likelihood that any one of these healthy subjects was a carrier was negligible (<0.1%) (Ghilardi et al., 2003). Ethical permission for all studies was obtained from the Institutional Review Board of North Shore University Hospital. Written consent was obtained from each subject after detailed explanation of the procedures.
Diffusion tensor imaging.
Images were acquired in a 3T GE whole-body MR scanner with an eight-channel head coil in parallel imaging mode with acceleration factor of 2. A single-shot spin-echo EPI sequence was used, with one image without diffusion weighting and 55 isotropically distributed diffusion gradient directions. The b value in the diffusion-weighted images was 1000 s/mm2. Echo time was TE = 68.3 ms, and repetition time was TR = 7000 ms. Images were zero filled to a matrix size of 256 × 256, yielding an image resolution of 0.9 × 0.9 × 1.8 mm3.
Probabilistic tractography.
Probabilistic tractography based on a multifiber model was applied using the FMRIB Diffusion Toolbox (Behrens et al., 2007). Starting from a “seed” voxel, multiple streamline samples were followed through the brain to estimate the distribution of connections. In this study, we used four different seed masks [right and left at the level of the superior cerebellar peduncle; right and left at the level of the dorsal brainstem in the vicinity of the pedunculopontine nucleus (PPN) (Olszewski and Baxter, 1982; Hazrati and Parent, 1992)] to assess the integrity of the CbTC pathways above and below the level of decussation. This approach was necessary because even with this method, fiber tracts cannot be tracked reliably through major decussations (Johansen-Berg and Behrens, 2006). Moreover, reconstructing independent fiber tracts from all four seed masks allowed for the cross-validation of any localized changes found in the individual pathways.
The analysis was run in MNI space. The seed masks (Fig. 1, a–d) were generated with WFU Pickatlas (Maldjian et al., 2003). The sphere seed masks at the lower level (center at: ±14; −37; −33) had a radius of 5 mm (81 voxels); the upper-level (center at: ±9; −26; −7) seed masks had a radius of 3 mm (19 voxels). For each seed voxel, 5000 streamline samples were acquired. All the other parameters were set to their default (step length = 0.5 mm, maximum number of steps = 2000, curvature threshold = 0.2, which corresponds approximately to ±80°). This generated four probabilistic connectivity tracts (PCTs) for each subject (one PCT per seed mask) in MNI space. Each PCT represented a map of the probability that a given voxel is connected to the associated seed mask.
Figure 1.

Reduced cerebellothalamocortical connectivity in dystonia gene carriers. The four seed masks (below and above the decussation on each side, a–d) were placed within the major outflow pathway of the cerebellum. PCTs were generated from each seed mask and compared across groups. Comparison of PCTs originating from the seed masks below the decussation of the superior cerebellar peduncle (a and b) revealed significant reductions in connectivity in the mutation carriers in the proximal segment of the CbTC pathway, near the dentate nucleus (clusters a1 and b1). PCTs generated from seed mask c above the decussation also exhibited reduced connectivity in gene carriers in this region (c1). Comparison of PCTs originating from the seed masks in the dorsal pons (c and d) revealed abnormal reductions in connectivity in the nonmanifesting carriers (clusters c2 and d1) in the subgyral white matter of the sensorimotor cortex. The size, location, and significance level of these clusters are provided in Table 1.
Group differences between PCTs were evaluated with SPM5 (Wellcome Department of Cognitive Neurology, London, UK; http://www.fil.ion.ucl.ac.uk/spm/software/spm5/). The PCTs were smoothed with an 8 × 8 × 8 mm kernel. Based on theoretical considerations, the connectivity values were assumed to have a binomial distribution [B(n, p)]. B(n, p) can be approximated by the normal distribution if np > 10. Therefore, to adapt the PCTs to parametric image analysis, we masked out voxels with mean values of <10. Group differences [MAN vs normal control (NL); NM vs NL; MAN vs NM] in the PCTs originating from each seed mask were analyzed on a voxel basis in SPM. The resulting T-maps were thresholded at p = 0.001 (voxel level, uncorrected), and regions were considered significant for p < 0.05, corrected at the cluster level. We also reported uncorrected group differences at p < 0.001, if conforming to prior hypothesis, and at p < 0.01 for homologous regions contralateral to significant clusters.
Connectivity values for each cluster were measured post hoc and compared across groups using nonparametric tests. The Mann–Whitney U test was used for pairwise group comparisons. The Jonckheere–Terpstra (J–T) test was used to assess trends across the three groups, i.e., whether the medians were ordered in a particular direction. The threshold for significance was set at p < 0.05 for both tests. Last, a multivariate discriminant analysis was performed to classify gene carriers as penetrant or not based on connectivity values measured in clusters a1, b1, c2, and d1 (see Table 1). This was achieved with PLS-DA (http://cran.r-project.org/src/contrib/Descriptions/plsgenomics.html). To confirm that group discrimination based on the connectivity values did not occur by chance, the results were validated by permutation testing (Eriksson et al., 2006).
Table 1.
Regions with significant group differences in connectivity
| Contrast | Region | Clustera | Coordinatesb |
Sizec | Tmax | p valued | ||
|---|---|---|---|---|---|---|---|---|
| x | y | z | ||||||
| MAN < NL | Cerebellum | a1 | 28 | −56 | −38 | 81 | 5.75 | 0.043* |
| c1 | 14 | −58 | −30 | 100 | 2.82 | <0.01† | ||
| b1 | −32 | −66 | −28 | 82 | 3.59 | <0.01† | ||
| NM < NL | Sensorimotor | c2 | 24 | −22 | 54 | 63 | 3.80 | 0.025* |
| d1 | −18 | −40 | 60 | 23 | 4.37 | <0.001† | ||
*Corrected at the cluster level;
†uncorrected.
aClusters designated by seed mask of origin (see Fig. 1 and Materials and Methods).
bMNI space.
cCluster size in voxels (1 voxel = 8 mm3).
dSignificant regions (p < 0.05, corrected at the cluster level are displayed in bold; see Results).
Positron emission tomography.
Ten DYT1 gene carriers also underwent activation studies with 15O-labeled water (H215O) and positron emission tomography (PET) (Carbon et al., 2008b). These subjects were scanned while performing a controlled motor task (MOVE) and in a sensory-matched condition without movement (REST). SPM correlational analysis was performed on the MOVE scans with cerebellar connectivity values (cluster a1) as the covariate of interest. Correlations were considered significant for p < 0.05, corrected at the cluster level. We also reported correlations at p < 0.001, uncorrected if conforming to prior hypothesis.
In view of potential false positives with this general voxel-based correlational approach (Kriegeskorte et al., 2009), the resulting regional correlations were verified by splitting the sample so that one-half of the MOVE scans (n = 10) were randomly selected for SPM analysis. For each of the significant clusters identified in the voxelwise analysis of the first group, we then measured rCBF in the MOVE scans from the remaining subjects and correlated these values with the corresponding cerebellar connectivity values. The results of the SPM analysis of the whole group were accepted if the post hoc regional correlations in the second group reached a threshold of p ≤ 0.01 (Pearson correlation coefficient). Having validated the SPM findings, we measured rCBF in each experimental condition (i.e., the mean across runs for MOVE and REST, and for MOVE − REST) for each significant cluster and plotted these values against cerebellar connectivity. Last, a volume-of-interest approach (Maldjian et al., 2003) was used to interrogate the relevant thalamic nuclei for potential correlations between cerebellothalamic connectivity and rCBF measured in the MOVE and REST conditions.
Simulations.
Monte Carlo simulations were used to predict the penetrance rate in the general population based on connectivity values of the proximal and distal CbTC segments. Connectivity values for the proximal segment (ConA, or “a”) were chosen randomly from the empirically determined distribution of the z-transformed data (mean = −0.38, SD = 0.68). The integrity of the distal segment (ConB, or “b”) (mean = −0.35, SD = 0.68) was modeled as k × ConA + random, where k is in the range of 0–3. This procedure generated connectivity values for the two pathway segments that are correlated to different degrees depending on the value of k. According to our hypothesis, manifestations of disease occur only if ConB > ConA. At a fixed k, 1000 iterations were run to estimate the likelihood of penetrance on a stochastic basis. As k increases, the influence of proximal segment integrity on distal segment integrity also increases. The resulting close correlation between connectivity values for the two pathway segments would make clinical penetrance less likely.
Results
Reduced cerebellothalamic connectivity in dystonia mutation carriers
CbTC pathways were reconstructed for each subject using probabilistic tractography based on the MR DTI data. To track the predecussatory and postdecussatory portions of this projection system, we positioned seed masks bilaterally in the superior cerebellar peduncle and in the dorsal pons/midbrain (corresponding to seeds a,b and c,d, respectively, in Fig. 1). Based on spatially normalized individual connectivity maps (see Materials and Methods), mean trajectories were displayed for the manifesting and nonmanifesting mutation carriers and for the control subjects (Fig. 2A). Voxel-based comparison of affected (MAN) gene carriers (n = 12) and NL subjects (n = 8) revealed a significant group difference in connectivity (Table 1) that was localized to the cerebellar outflow pathway in the white matter of lobule VI (Schmahmann et al., 2000), adjacent to the dentate nucleus (Fig. 2A). This regional abnormality was separately identified in all group contrasts, independent of the seed mask used for fiber tracking (Fig. 1, clusters a1, b1, and c1). The difference in connectivity between the two groups was greatest in magnitude for cluster a1, with significant reductions in MAN carriers relative to controls (p < 0.001, Mann–Whitney U test). In this region, all of the affected carriers had connectivity values that were beneath the lowest control value (Fig. 2B). The affected carriers also exhibited abnormal reductions in connectivity (p < 0.05, Mann–Whitney U test) on the contralateral side, in the left cerebellar white matter (Fig. 1, cluster b1).
Figure 2.
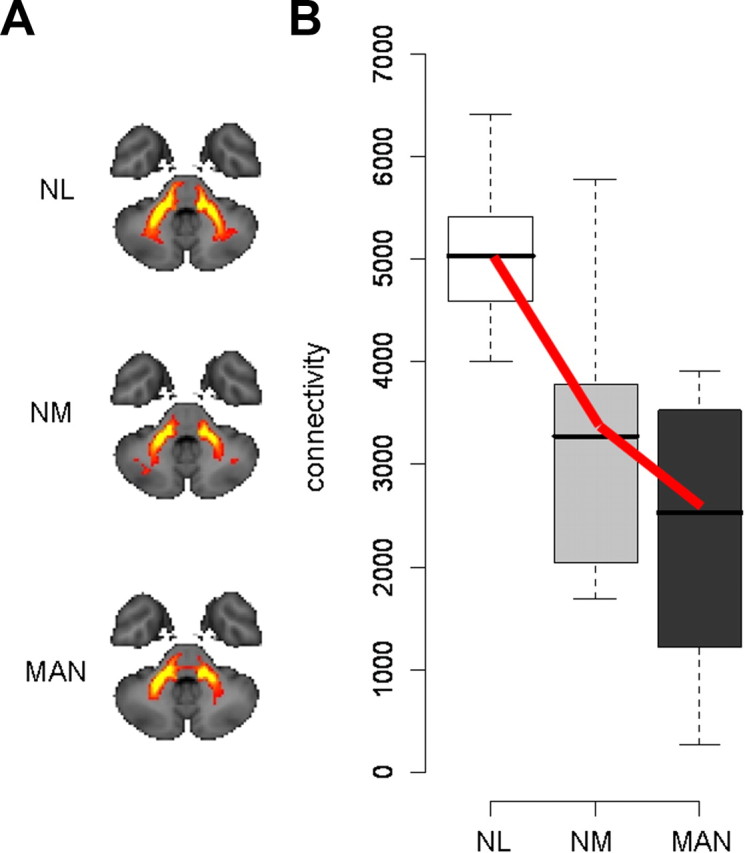
Reduced cerebellar outflow in dystonia gene carriers. A, Two-dimensional projections of the group mean PCTs (see Materials and Methods) generated from seed masks a and b (Fig. 1) in NL subjects (n = 8), and in NM (n = 8) and MAN (n = 12) dystonia mutation carriers. Reduced fiber tract integrity is evident in the proximal portion of the cerebellar outflow pathway in the NM and MAN groups. B, Box-and-whisker plot showing connectivity values for cluster a1 (Fig. 1) in the proximal portion of the CbTC pathway. Connectivity in this region, corresponding to dentatothalamic projections, was abnormally reduced in both MAN and NM gene carriers (p < 0.001 and p < 0.01, Mann–Whitney U tests). A significant decreasing trend (NL > NM > MAN, bold lines) was detected across the three groups (p < 0.001, J–T test of trends).
Connectivity in these areas was then measured in the NM carriers (n = 8), revealing an abnormal reduction (p < 0.01, Mann–Whitney U test) on the right side. The NM values fell intermediately between MAN carriers and controls, with a significant decreasing trend (p < 0.001, J–T test of trends) across the three groups (NL > NM > MAN). The same groupwise trend was also present on the left side (p = 0.017, J–T test). When separately analyzed (supplemental Fig. 1, top, available at www.jneurosci.org as supplemental material), both genotypic subgroups exhibited this trend (DYT1: p < 0.001; DYT6: p = 0.002, J–T tests). Although this tract abnormality was present in both MAN and NM carriers, the corresponding connectivity values did not separate the two phenotypic groups (p = 0.19, Mann–Whitney U test).
Relationship of altered cerebellar outflow to motor activation responses
We next determined whether these tractographic changes are relevant to brain function. Connectivity values from the significant cerebellar cluster described above (Fig. 1, cluster a1) were correlated with rCBF measured in the DYT1 carriers (n = 10) who additionally underwent PET activation studies with 15O-labeled water (H215O). Voxelwise searches revealed significant correlations between cerebellar connectivity values and rCBF (Fig. 3) at key nodes of the cortico-striato-pallido-thalamo-cortical (CSPTC) motor circuits and related pathways (DeLong and Wichmann, 2007) (Table 2). Connectivity correlated positively with motor activation recorded locally in the same cerebellar region (Fig. 3A). Here, greater outflow pathway disruption (reduced connectivity) was associated with lower rCBF during the movement task. Reduced integrity of this pathway was also associated with lower resting rCBF in the ventrolateral (VL) nucleus of the thalamus (Fig. 3B), but not in neighboring thalamic nuclei (supplemental Fig. 2, available at www.jneurosci.org as supplemental material). In the rest state, local metabolic activity is closely correlated with afferent synaptic activity (Sokoloff, 1999; Lin et al., 2008). Therefore, it was reasonable to find that lower resting rCBF in the VL nucleus was associated with greater disruption of cerebellar input to this thalamic region.
Figure 3.
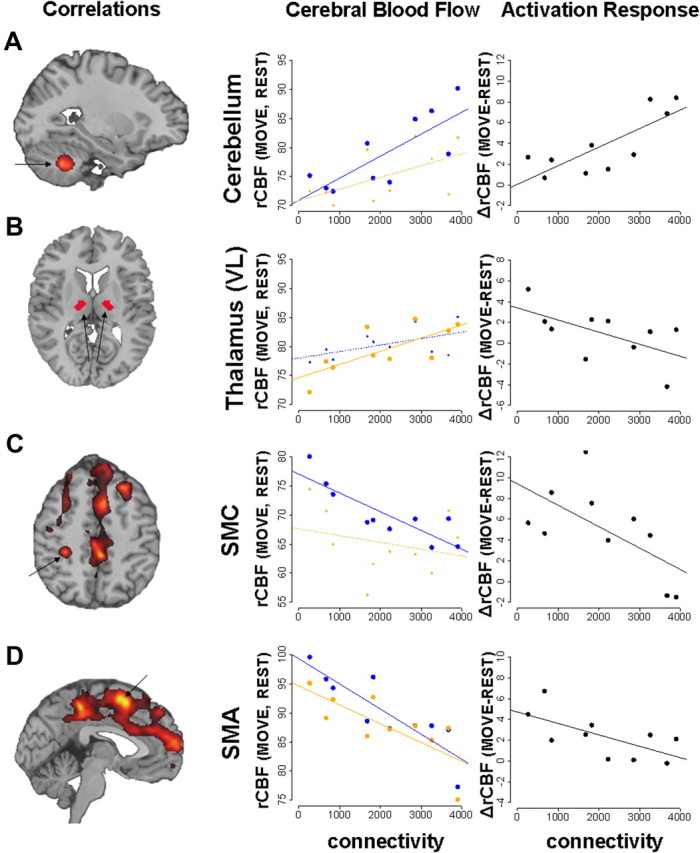
Correlations of cerebellar outflow pathway connectivity with brain activation. Voxelwise searches of the whole-brain volume (left) revealed several discrete clusters in which cerebellar connectivity correlated significantly with rCBF recorded during task performance (see Table 2). The displayed correlational maps were thresholded at p = 0.001 at peak voxel with a cluster cutoff of 30 voxels. For each significant cluster, rCBF for each subject (averaged across trial runs) was plotted (middle) against the corresponding connectivity measures. Correlations with rCBF recorded during the movement (MOVE, blue) and rest (REST, orange) conditions (see Materials and Methods) were displayed separately for each region. We also plotted (right) motor activation responses [Δ = (MOVE − REST) differences in rCBF, black] for each cluster. For both sets of plots, significant correlations (p < 0.01, Pearson product moment correlations) were indicated by bold lines and larger dots. A, Connectivity in the cerebellum correlated positively with movement-related activation in the same region (MOVE: r = 0.78, p = 0.008; REST: r = 0.55, p = 0.098; MOVE − REST: r = 0.79, p = 0.006). B, Reduced cerebellar outflow tract integrity was associated with lower resting rCBF in the VL nucleus of the thalamus (REST: r = 0.73, p = 0.017; MOVE: r = 0.54, p = 0.11; MOVE − REST: r = −0.60, p = 0.069). There were no significant correlations in the neighboring thalamic nuclei (supplemental Fig. 3, available at www.jneurosci.org as supplemental material). C, D, Cerebellar connectivity correlated negatively with motor cortical activation. The correlation was movement specific (MOVE: r = −0.85, p = 0.002; REST: r = −0.27, p = 0.44; MOVE − REST: r = −0.63, p = 0.052) in the SMC and task-independent (MOVE: r = −0.87, p = 0.001; REST: r = −0.76, p = 0.011) in the SMA.
Table 2.
Regions with significant correlations between cerebral blood flow and connectivity
| Correlation | Region | Coordinatesa |
Sizeb | Tmax | p valuec | ||
|---|---|---|---|---|---|---|---|
| x | y | z | |||||
| Positive | Cerebellum | 28 | −56 | −40 | 186 | 5.16 | 0.041* |
| Negative | SMA | 6 | 4 | 58 | 641 | 6.49 | <0.001* |
| Precuneus | 2 | −38 | 52 | 359 | 5.67 | 0.002* | |
| DLPFC | 26 | 28 | 44 | 227 | 5.48 | 0.018* | |
| mPFC | 6 | 54 | 20 | 708 | 5.18 | <0.001* | |
| SMC | −30 | −34 | 48 | 30 | 4.51 | <0.001† | |
| SMC | 44 | −30 | 68 | 40 | 4.18 | <0.001† | |
DLPFC, Dorsolateral prefrontal cortex; mPFC, medial prefrontal cortex.
*Corrected at the cluster level;
†uncorrected.
aMNI space.
bCluster size in voxels (1 voxel = 8 mm3).
cSignificant regions (p < 0.05, corrected at the cluster level are displayed in bold; see Results).
In contrast to these positive correlations, cerebellar connectivity correlated negatively with motor activation recorded in the SMC and supplementary motor area (SMA). In both regions, lower cerebellar outflow pathway integrity was associated with increased activation, which was movement specific for SMC (Fig. 3C) and task independent (i.e., present in both the movement and rest conditions) for SMA (Fig. 3D). These correlations relate the severity of cerebellar outflow tract disruption to increased motor activation in the cerebral cortex, as has been described in dystonia patients (Lerner et al., 2004; Detante et al., 2004; Carbon and Eidelberg, 2009). Moreover, relating connectivity to independent measurements of the activation response lends credence to the relevance of the tractographic findings to regional brain function.
Thalamocortical connectivity and clinical penetrance
Connectivity values measured in the proximal segment of the CbTC pathway did not differentiate between MAN and NM gene carriers. We therefore searched for other regions along this pathway in which fiber tract integrity was linked to penetrance status, either alone or in combination with the proximal cerebellar outflow abnormalities. Connectivity maps from the NM carriers (n = 8) were compared with the controls (n = 8) to identify potential abnormalities associated with nonpenetrance. Voxel-based comparison of these two groups (Table 1) revealed a significant reduction in the distal segment of the CbTC pathway (Fig. 4A) involving thalamocortical projections to SMC in the vicinity of the wrist and forearm areas. In the right hemisphere, connectivity in this region (Fig. 1, cluster c2) was significantly reduced (p = 0.006, Mann–Whitney U test) in NM carriers relative to controls (Fig. 4B). The NM carriers also exhibited abnormal reductions in connectivity (p = 0.016, Mann–Whitney U test) in the homologous region of the left hemisphere (Fig. 1, cluster d1).
Figure 4.
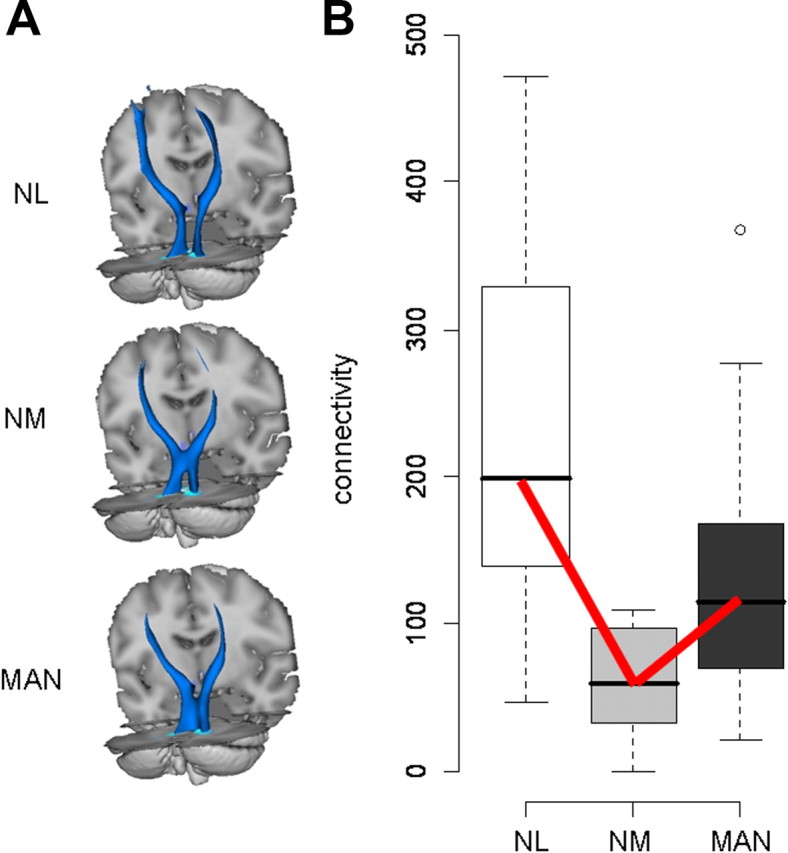
Reduced thalamocortical connectivity in nonmanifesting dystonia gene carriers. A, Three-dimensional displays of the group mean PCTs generated from seed masks c and d (Fig. 1) in NL subjects (n = 8), and in NM (n = 8) and MAN (n = 12) dystonia mutation carriers. The size of this fiber tract is reduced distally, most pronounced in the nonmanifesting carriers. B, Box-and-whisker plots showing connectivity values for cluster c2 (Fig. 1) in the distal portion of the CbTC pathway. Connectivity in this region, corresponding to thalamocortical projections, was reduced in NM carriers relative to controls (p = 0.016) and MAN carriers (p = 0.025, Mann–Whitney U tests). A significant trend (NL > MAN > NM, bold lines) was detected across the three groups (p = 0.001, J–T test of trends).
Connectivity in this segment of the CbTC pathway was then measured in each of the MAN carriers (n = 12; these values assumed an intermediate position between those for the NM carriers and the controls). Thus, mean connectivity was greater (i.e., more intact) than for NM carriers (p < 0.025) and only marginally different than for controls (p = 0.064, Mann–Whitney U tests). A significant groupwise trend (Fig. 4B) was present on both sides (right: p = 0.001; left: p = 0.008, J–T tests). This trend (NL > MAN > NM) was significant for both genotypes (DYT1: p = 0.002; DYT6: p = 0.025; J–T tests) (supplemental Fig. 1, bottom, available at www.jneurosci.org as supplemental material). Notably, the trend across groups for connectivity in this region differed from that observed in the cerebellum (i.e., NL > NM > MAN; see Fig. 2). This difference in trend suggested that connectivity measurements from both regions may be used to accurately classify individual gene carriers according to penetrance status. To examine this possibility, we used a multivariate discriminant analysis [partial least-squares discriminant analysis (PLS-DA)] to categorize each subject based on connectivity measures from the proximal and distal CbTC segments. Indeed, these measures (Fig. 5A) provided accurate discrimination of penetrant and nonpenetrant carriers [component 2 (y-axis) scores: p < 0.002, Mann–Whitney U test], which was demonstrated to be reliable by permutation testing (supplemental Fig. 3A, available at www.jneurosci.org as supplemental material). Moreover, NM and MAN carriers were similarly discriminated for both genotypes (DYT1: p = 0.036; DYT6: p = 0.032; Mann–Whitney U tests). We also noted (supplemental Fig. 3B, available at www.jneurosci.org as supplemental material) that average loadings on this function for the cerebellum and SMC were of similar magnitude but opposite sign. This suggested that each region had a discrete influence on phenotypic expression of the mutant gene.
Figure 5.
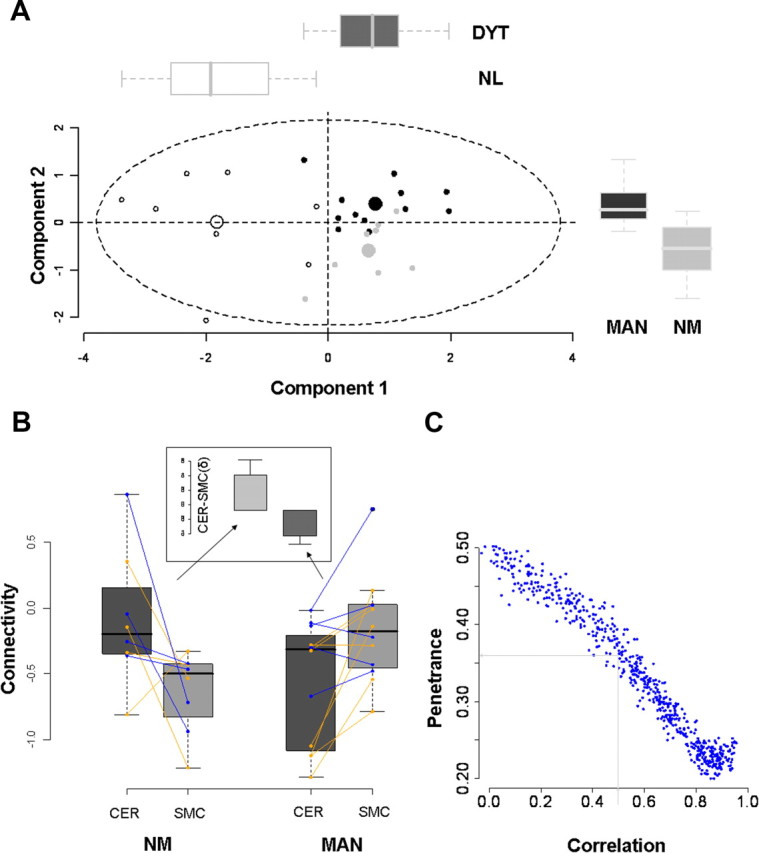
Penetrance is determined by connectivity changes at proximal and distal sites. A, PLS-DA was used to classify individual mutation carriers as penetrant or nonpenetrant based on their measured connectivity at the four loci described above (Fig. 1, clusters a1, b1, c2, and d1). Two significant discriminant functions accurately categorized the subjects. Component 1 (x-axis) separated the dystonia gene carriers (DYT, n = 20) from NL subjects (n = 8) (p < 0.00001; Mann–Whitney U test). Component 2 discriminated MAN (n = 12) from NM (n = 8) (p = 0.002, Mann–Whitney U test). The distribution of subject scores on the two discriminant functions was similar for both genotypic subgroups. [See supplemental Fig. 4, available at www.jneurosci.org as supplemental material, for validation of the PLS-DA results and for the regional loadings of the two discriminant functions.] B, Box-and-whisker plots showing the connectivity values for the cerebellar (CER) and SMC clusters from the individual gene carriers. For each subject, z-transformed connectivity values for each region were right-left averaged and connected by lines (DYT1, orange; DYT6, blue). Subject differences in connectivity between regions (δ = CER − SMC; inset) were compared for the MAN and NM carriers. Differences in δ were found to be significant (p = 0.001, Mann–Whitney U test), with positive values for the NM group and negative values for the MAN group. C, Monte Carlo simulations predicting the penetrance rate in dystonia gene carriers based on randomly chosen connectivity values for the proximal and distal CbTC pathway segments. Different values were assumed (x-axis) for the correlation coefficient relating the two connectivity measures. (The details of this model and its assumptions are presented in Materials and Methods). A correlation coefficient of 0.56, based on the regression analysis of DYT1 carrier and control data (SMC = a · CER + b: a = 0.52, b = 0.12; r = 0.56, p = 0.01, n = 19), predicted a penetrance rate of ∼36% (see Results).
A model of penetrance in gene carriers
The results of the preceding data-driven analysis suggest that cerebellar outflow tract disruption in gene carriers is associated with disease manifestations, provided that the remainder of the CbTC pathway is intact, and that disruption of the thalamocortical segment of the pathway can abolish this effect. The CbTC pathway normally facilitates intracortical inhibition via thalamocortical projections to inhibitory interneurons in sensorimotor cortex (Molinari et al., 2002; Daskalakis et al., 2004). Abnormal integrity and/or maldevelopment of cerebellothalamic projections occurring in isolation is likely to reduce this source of inhibition, resulting in increased excitability at the cortical level. Indeed, this relationship was substantiated in our activation experiments showing that disruption of cerebellar outflow pathways was associated with increased activation responses in cortical motor regions. Nonetheless, the presence of an additional lesion involving the thalamocortical segment of the pathway may limit transmission of abnormal cerebellar output signals to the motor cortex, leading to a reduction or complete absence of clinical manifestations.
Based on these considerations, we developed a simple model to explain clinical penetrance in dystonia mutation carriers. If connectivity in the proximal segment of the CbTC pathway is represented by “a” and in the distal segment by “b,” then the difference between the two (δ = a − b) can be understood as an index of the relative integrity of the pathways that mediate cerebellocortical inhibition in mutation carriers. According to this model, positive differences (δ > 0) reflect relative preservation of the integrity of the proximal cerebellothalamic segment of the CbTC pathway. In contrast, negative differences (δ < 0) reflect disruption of this segment, with relative preservation of the distal thalamocortical segment of the pathway. We hypothesized that the former scenario would typify NM carriers and the latter, their affected counterparts.
To examine this notion, we computed δ values for each subject as the difference in mean left–right connectivity for the two sites [δ = (aL + aR)/2 − (bL + bR)/2] (Fig. 5B). Indeed, these values proved to be of opposite sign for MAN and NM gene carriers, with a significant difference between them (p = 0.001, Mann–Whitney U test), which was present in both genotypic subgroups (DYT1: p = 0.036; DYT6: p = 0.032). As predicted by the model, the NM carriers had positive δ values while the affected carriers had negative values (Fig. 5B, inset). We also determined whether overall penetrance rates can be predicted by the model. This was done by randomly choosing from the range of measured connectivity values while assuming different degrees of intercorrelation between the two CbTC segments (see Materials and Methods). Each trial resulted in a δ value, the sign of which determined the outcome as penetrant or nonpenetrant. Monte Carlo simulations (Fig. 5C) revealed penetrance rates between 0.2 and 0.5, depending on the correlation coefficient assumed for the relationship of the values for “a” and “b.” A correlation coefficient of 0.56, as measured in the DYT1 carriers and controls, was associated with an estimated penetrance rate of 0.36 (Fig. 5C, gray lines).
Discussion
The abnormalities of CbTC tract integrity described in dystonia gene carriers are likely to be developmental in origin (Marenco et al., 2007). Clinical signs and symptoms of dystonia generally develop in affected DYT1 and DYT6 carriers in late childhood or adolescence, when maturation of thalamic and sensorimotor cortical pathways is known to occur (Gogtay et al., 2004; Barnea-Goraly et al., 2005; Paus, 2005). Indeed, reduced FA in these regions has been observed with DTI in dystonia mutation carriers (Carbon et al., 2004; Blood et al., 2006; Carbon et al., 2008a), while the same measure has been found to increase steadily in healthy young subjects throughout this phase of development (Barnea-Goraly et al., 2005; Paus, 2005). TorsinA, the mutant DYT1 gene product, is normally involved in a number of processes necessary for neuronal maturation such as cell adhesion, neurite extension, and cytoskeletal dynamics (Ferrari Toninelli et al., 2003; Kamm et al., 2004; Hewett et al., 2006; Nery et al., 2008). This protein is widely expressed in neurons, with particularly high concentrations in cerebellar Purkinje cells and in neurons of the dentate nucleus and ventral thalamus (Augood et al., 1999; Konakova et al., 2001). Moreover, in the mouse, torsinA expression peaks during the period of cerebellar maturation (Xiao et al., 2004), which corresponds to late childhood in humans. Thus, maldevelopment of CbTC pathways in DYT1 carriers is a likely byproduct of the regional localization and abnormal functioning of the mutant gene product. Similarly, in DYT6, THAP domains function as transcriptional activators and corepressors, and as regulators of axonal development (Chinnadurai, 2003). Indeed, in the mouse, this gene is also expressed in cerebellar Purkinje cells and in neurons of the dentate nucleus and ventral thalamus (see http://mouse.brain-map.org/brain/gene/45/thumbnails.html). The similarity of the fiber tract abnormalities observed in DYT1 and DYT6 further support the notion of a common neurodevelopmental mechanism for both mutations.
Reduced penetrance is a feature of both mutations, so that 60–70% of DYT1 carriers and ∼40% of DYT6 carriers are clinically normal (Risch et al., 2007; Saunders-Pullman et al., 2007). Nonetheless, scant information exists concerning the determinants of penetrance in these subjects. A specific gene modifier has recently been identified that regulates the effect of the DYT1 mutation in cell culture (Kock et al., 2006). This single nucleotide polymorphism (SNP) in the coding sequence for residue 216 (D216H) has recently been found to influence the penetrance of this gene (Risch et al., 2007). However, this uncommon SNP reduces overall penetrance by only 3–4%. In our simulations, connectivity values were selected at random without taking into account such penetrance modifying effects. Even so, our model predicted a DYT1 penetrance rate of ∼36%, in close agreement with published values (Risch et al., 2007). For DYT6 carriers, in whom “a” and “b” values were relatively independent, the penetrance rate was predicted to be somewhat greater, as recently reported (Fuchs et al., 2009). These observations, as well as the accurate categorization of dystonia mutation carriers based solely on their connectivity values, provide compelling evidence that penetrance is determined by the degree of CbTC tract disruption present in individual subjects.
This mechanism is consistent with existing information concerning the development of CbTC pathways and the regional localization of torsinA in the mammalian brain. In ontogeny, the proximal and distal pathway segments emerge from a common anlage that populates the Purkinje cell layer, the dentate nucleus, as well as the red nucleus and portions of the ventrolateral thalamus (Eckmiller et al., 1984; Altman and Bayer, 1985). Therefore, it is not surprising that connectivity values for the two CbTC segments were found to be intercorrelated, and therefore could not be treated as independent measures in our model. Moreover, as mentioned above, torsinA has been reported to have high expression in the cell bodies of these projecting neurons. That developmental connectivity changes can occur at either one or both of these loci to regulate penetrance is compatible with these observations. Along these lines, it is tempting to consider the possibility that phenotypic variability in affected gene carriers is determined by the somatotopic location of these changes in subrolandic white matter. In our population, MAN and NM carriers were distinguished in part by penetrance-related connectivity changes in thalamocortical projection fibers subjacent to the wrist and forearm areas of the rolandic cortex. Indeed, each of the 12 affected participants in this study exhibited dystonia of this body part, while differing widely in involvement of the rest of the body. Because the present analysis was conducted in a standardized stereotaxic space, only those features of tract disruption that were common to the whole group were detected. Further analysis in native space will determine whether subject differences in the spatial topography of these changes account for the observed phenotypic variability.
Needless to say, the current findings do not preclude the existence of additional abnormalities in other motor circuits. Tracts generated from seed masks positioned along the predecussatory and postdecussatory cerebellar outflow pathways did not capture the disynaptic connections linking the cerebellar deep nuclei, the VL and intralaminar thalamic nuclei, and the striatum (Hoshi et al., 2005). Accordingly, group differences in connectivity were not detected along this pathway. Nonetheless, the possibility remains that the integrity of other critical pathways is compromised in dystonia, such as those connecting the internal globus pallidus to the thalamus and PPN (Blood et al., 2006). That said, whole-brain searches for localized FA changes in the current high-field (3T) DTI data failed to reveal significant regional abnormalities apart from those described previously at lower field (Carbon et al., 2004, 2008a). We also cannot determine from the data whether the distal tract abnormality involved thalamocortical projections receiving input from the cerebellum, the globus pallidus, or both. In any event, reduced connectivity in this segment of the CbTC pathway is associated with the absence of clinical manifestations in individuals who express a “permissive” proximal tract abnormality on a genetic basis. It is likely that therapeutic interventions like pallidal deep brain stimulation, which is particularly effective for inherited dystonia (Vidailhet et al., 2007), achieve benefit by modulating the activity of these relatively intact distal projections. This results in a functional state similar to that seen naturally in NM carriers. New treatment strategies for dystonia can be designed to achieve a similar functional endpoint.
Footnotes
This work was supported by the National Institutes of Health [R01 NS 047668 (D.E.)], Bachmann-Strauss Dystonia & Parkinson Foundation (D.E.), and the General Clinical Research Center of The Feinstein Institute for Medical Research [National Center for Research Resources, a component of the National Institutes of Health (M01 RR 018535)]. We thank Dr. Thomas Chaly for valuable radiochemistry support and Claude Margouleff for technical support. We are grateful to Toni Flanagan for her invaluable help with study coordination and copyediting.
The authors declare no competing financial interests.
References
- Altman J, Bayer SA. Embryonic development of the rat cerebellum. II. Translocation and regional distribution of the deep neurons. J Comp Neurol. 1985;231:27–41. doi: 10.1002/cne.902310104. [DOI] [PubMed] [Google Scholar]
- Augood SJ, Martin DM, Ozelius LJ, Breakefield XO, Penney JB, Jr, Standaert DG. Distribution of the mRNAs encoding torsinA and torsinB in the normal adult human brain. Ann Neurol. 1999;46:761–769. [PubMed] [Google Scholar]
- Barnea-Goraly N, Menon V, Eckert M, Tamm L, Bammer R, Karchemskiy A, Dant CC, Reiss AL. White matter development during childhood and adolescence: a cross-sectional diffusion tensor imaging study. Cereb Cortex. 2005;15:1848–1854. doi: 10.1093/cercor/bhi062. [DOI] [PubMed] [Google Scholar]
- Behrens TE, Woolrich MW, Jenkinson M, Johansen-Berg H, Nunes RG, Clare S, Matthews PM, Brady JM, Smith SM. Characterization and propagation of uncertainty in diffusion-weighted MR imaging. Magn Reson Med. 2003;50:1077–1088. doi: 10.1002/mrm.10609. [DOI] [PubMed] [Google Scholar]
- Behrens TE, Berg HJ, Jbabdi S, Rushworth MF, Woolrich MW. Probabilistic diffusion tractography with multiple fibre orientations: what can we gain? Neuroimage. 2007;34:144–155. doi: 10.1016/j.neuroimage.2006.09.018. [DOI] [PMC free article] [PubMed] [Google Scholar]
- Blood AJ, Tuch DS, Makris N, Makhlouf ML, Sudarsky LR, Sharma N. White matter abnormalities in dystonia normalize after botulinum toxin treatment. Neuroreport. 2006;17:1251–1255. doi: 10.1097/01.wnr.0000230500.03330.01. [DOI] [PMC free article] [PubMed] [Google Scholar]
- Breakefield XO, Blood AJ, Li Y, Hallett M, Hanson PI, Standaert DG. The pathophysiological basis of dystonias. Nat Rev Neurosci. 2008;9:222–234. doi: 10.1038/nrn2337. [DOI] [PubMed] [Google Scholar]
- Carbon M, Eidelberg D Advance online publication. Abnormal structure-function relationships in hereditary dystonia. Neuroscience. 2009 doi: 10.1016/j.neuroscience.2008.12.041. [DOI] [PMC free article] [PubMed] [Google Scholar]
- Carbon M, Kingsley PB, Su S, Smith GS, Spetsieris P, Bressman S, Eidelberg D. Microstructural white matter changes in carriers of the DYT1 gene mutation. Ann Neurol. 2004;56:283–286. doi: 10.1002/ana.20177. [DOI] [PubMed] [Google Scholar]
- Carbon M, Kingsley PB, Tang C, Bressman S, Eidelberg D. Microstructural white matter changes in primary torsion dystonia. Mov Disord. 2008a;23:234–239. doi: 10.1002/mds.21806. [DOI] [PMC free article] [PubMed] [Google Scholar]
- Carbon M, Ghilardi MF, Argyelan M, Dhawan V, Bressman SB, Eidelberg D. Increased cerebellar activation during sequence learning in DYT1 carriers: an equiperformance study. Brain. 2008b;131:146–154. doi: 10.1093/brain/awm243. [DOI] [PMC free article] [PubMed] [Google Scholar]
- Chinnadurai G. CtBP family proteins: more than transcriptional corepressors. Bioessays. 2003;25:9–12. doi: 10.1002/bies.10212. [DOI] [PubMed] [Google Scholar]
- Daskalakis ZJ, Paradiso GO, Christensen BK, Fitzgerald PB, Gunraj C, Chen R. Exploring the connectivity between the cerebellum and motor cortex in humans. J Physiol. 2004;557:689–700. doi: 10.1113/jphysiol.2003.059808. [DOI] [PMC free article] [PubMed] [Google Scholar]
- Delmaire C, Vidailhet M, Wassermann D, Descoteaux M, Valabregue R, Bourdain F, Lenglet C, Sangla S, Terrier A, Deriche R, Lehéricy S. Diffusion abnormalities in the primary sensorimotor pathways in writer's cramp. Arch Neurol. 2009;66:502–508. doi: 10.1001/archneurol.2009.8. [DOI] [PubMed] [Google Scholar]
- DeLong MR, Wichmann T. Circuits and circuit disorders of the basal ganglia. Arch Neurol. 2007;64:20–24. doi: 10.1001/archneur.64.1.20. [DOI] [PubMed] [Google Scholar]
- Detante O, Vercueil L, Thobois S, Broussolle E, Costes N, Lavenne F, Chabardes S, Lebars D, Vidailhet M, Benabid AL, Pollak P. Globus pallidus internus stimulation in primary generalized dystonia: a H215O PET study. Brain. 2004;127:1899–1908. doi: 10.1093/brain/awh213. [DOI] [PubMed] [Google Scholar]
- Eckmiller R, Meisami E, Westheimer G. Neuroanatomical status of monkeys showing functional compensation following neonatal cerebellar lesions. Exp Brain Res. 1984;56:59–71. doi: 10.1007/BF00237442. [DOI] [PubMed] [Google Scholar]
- Eidelberg D, Moeller JR, Antonini A, Kazumata K, Nakamura T, Dhawan V, Spetsieris P, deLeon D, Bressman SB, Fahn S. Functional brain networks in DYT1 dystonia. Ann Neurol. 1998;44:303–312. doi: 10.1002/ana.410440304. [DOI] [PubMed] [Google Scholar]
- Eriksson L, Johansson E, Kettaneh-Wold N, Trygg J, Wikstrom C, Wold S. Multi- and megavariate data analysis part I: basic principles and applications. Umea: Umetrics; 2006. PLS; pp. 63–101. [Google Scholar]
- Ferrari Toninelli G, Spano P, Memo M. TorsinA, microtubules and cell polarity. Funct Neurol. 2003;18:7–10. [PubMed] [Google Scholar]
- Fuchs T, Gavarini S, Saunders-Pullman R, Raymond D, Ehrlich ME, Bressman SB, Ozelius LJ. Mutations in the THAP1 gene are responsible for DYT6 primary torsion dystonia. Nat Genet. 2009;41:286–288. doi: 10.1038/ng.304. [DOI] [PubMed] [Google Scholar]
- Ghilardi MF, Carbon M, Silvestri G, Dhawan V, Tagliati M, Bressman S, Ghez C, Eidelberg D. Impaired sequence learning in carriers of the DYT1 dystonia mutation. Ann Neurol. 2003;54:102–109. doi: 10.1002/ana.10610. [DOI] [PubMed] [Google Scholar]
- Gogtay N, Giedd JN, Lusk L, Hayashi KM, Greenstein D, Vaituzis AC, Nugent TF, 3rd, Herman DH, Clasen LS, Toga AW, Rapoport JL, Thompson PM. Dynamic mapping of human cortical development during childhood through early adulthood. Proc Natl Acad Sci U S A. 2004;101:8174–8179. doi: 10.1073/pnas.0402680101. [DOI] [PMC free article] [PubMed] [Google Scholar]
- Hazrati LN, Parent A. Projection from the deep cerebellar nuclei to the pedunculopontine nucleus in the squirrel monkey. Brain Res. 1992;585:267–271. doi: 10.1016/0006-8993(92)91216-2. [DOI] [PubMed] [Google Scholar]
- Hewett JW, Zeng J, Niland BP, Bragg DC, Breakefield XO. Dystonia-causing mutant torsinA inhibits cell adhesion and neurite extension through interference with cytoskeletal dynamics. Neurobiol Dis. 2006;22:98–111. doi: 10.1016/j.nbd.2005.10.012. [DOI] [PubMed] [Google Scholar]
- Hoshi E, Tremblay L, Féger J, Carras PL, Strick PL. The cerebellum communicates with the basal ganglia. Nat Neurosci. 2005;8:1491–1493. doi: 10.1038/nn1544. [DOI] [PubMed] [Google Scholar]
- Johansen-Berg H, Behrens TE. Just pretty pictures? What diffusion tractography can add in clinical neuroscience. Curr Opin Neurol. 2006;19:379–385. doi: 10.1097/01.wco.0000236618.82086.01. [DOI] [PMC free article] [PubMed] [Google Scholar]
- Kamm C, Boston H, Hewett J, Wilbur J, Corey DP, Hanson PI, Ramesh V, Breakefield XO. The early onset dystonia protein torsinA interacts with kinesin light chain 1. J Biol Chem. 2004;279:19882–19892. doi: 10.1074/jbc.M401332200. [DOI] [PubMed] [Google Scholar]
- Kock N, Naismith TV, Boston HE, Ozelius LJ, Corey DP, Breakefield XO, Hanson PI. Effects of genetic variations in the dystonia protein torsinA: identification of polymorphism at residue 216 as protein modifier. Hum Mol Genet. 2006;15:1355–1364. doi: 10.1093/hmg/ddl055. [DOI] [PubMed] [Google Scholar]
- Konakova M, Huynh DP, Yong W, Pulst SM. Cellular distribution of torsin A and torsin B in normal human brain. Arch Neurol. 2001;58:921–927. doi: 10.1001/archneur.58.6.921. [DOI] [PubMed] [Google Scholar]
- Kriegeskorte N, Simmons WK, Bellgowan PS, Baker CI. Circular analysis in systems neuroscience: the dangers of double dipping. Nat Neurosci. 2009;12:535–540. doi: 10.1038/nn.2303. [DOI] [PMC free article] [PubMed] [Google Scholar]
- LeDoux MS, Lorden JF. Abnormal spontaneous and harmaline-stimulated Purkinje cell activity in the awake genetically dystonic rat. Exp Brain Res. 2002;145:457–467. doi: 10.1007/s00221-002-1127-4. [DOI] [PubMed] [Google Scholar]
- LeDoux MS, Hurst DC, Lorden JF. Single-unit activity of cerebellar nuclear cells in the awake genetically dystonic rat. Neuroscience. 1998;86:533–545. doi: 10.1016/s0306-4522(98)00007-4. [DOI] [PubMed] [Google Scholar]
- Lerner A, Shill H, Hanakawa T, Bushara K, Goldfine A, Hallett M. Regional cerebral blood flow correlates of the severity of writer's cramp symptoms. Neuroimage. 2004;21:904–913. doi: 10.1016/j.neuroimage.2003.10.019. [DOI] [PubMed] [Google Scholar]
- Lin TP, Carbon M, Tang C, Mogilner AY, Sterio D, Beric A, Dhawan V, Eidelberg D. Metabolic correlates of subthalamic nucleus activity in Parkinson's disease. Brain. 2008;131:1373–1380. doi: 10.1093/brain/awn031. [DOI] [PubMed] [Google Scholar]
- Maldjian JA, Laurienti PJ, Kraft RA, Burdette JH. An automated method for neuroanatomic and cytoarchitectonic atlas-based interrogation of fMRI data sets. Neuroimage. 2003;19:1233–1239. doi: 10.1016/s1053-8119(03)00169-1. [DOI] [PubMed] [Google Scholar]
- Marenco S, Siuta MA, Kippenhan JS, Grodofsky S, Chang WL, Kohn P, Mervis CB, Morris CA, Weinberger DR, Meyer-Lindenberg A, Pierpaoli C, Berman KF. Genetic contributions to white matter architecture revealed by diffusion tensor imaging in Williams syndrome. Proc Natl Acad Sci U S A. 2007;104:15117–15122. doi: 10.1073/pnas.0704311104. [DOI] [PMC free article] [PubMed] [Google Scholar]
- Molinari M, Filippini V, Leggio MG. Neuronal plasticity of interrelated cerebellar and cortical networks. Neuroscience. 2002;111:863–870. doi: 10.1016/s0306-4522(02)00024-6. [DOI] [PubMed] [Google Scholar]
- Nery FC, Zeng J, Niland BP, Hewett J, Farley J, Irimia D, Li Y, Wiche G, Sonnenberg A, Breakefield XO. TorsinA binds the KASH domain of nesprins and participates in linkage between nuclear envelope and cytoskeleton. J Cell Sci. 2008;121:3476–3486. doi: 10.1242/jcs.029454. [DOI] [PMC free article] [PubMed] [Google Scholar]
- Neychev VK, Fan X, Mitev VI, Hess EJ, Jinnah HA. The basal ganglia and cerebellum interact in the expression of dystonic movement. Brain. 2008;131:2499–2509. doi: 10.1093/brain/awn168. [DOI] [PMC free article] [PubMed] [Google Scholar]
- Olszewski J, Baxter D. Ed 2. Basel: Karger; 1982. Cytoarchitecture of the human brain stem. [Google Scholar]
- Paus T. Mapping brain maturation and cognitive development during adolescence. Trends Cogn Sci. 2005;9:60–68. doi: 10.1016/j.tics.2004.12.008. [DOI] [PubMed] [Google Scholar]
- Pizoli CE, Jinnah HA, Billingsley ML, Hess EJ. Abnormal cerebellar signaling induces dystonia in mice. J Neurosci. 2002;22:7825–7833. doi: 10.1523/JNEUROSCI.22-17-07825.2002. [DOI] [PMC free article] [PubMed] [Google Scholar]
- Risch NJ, Bressman SB, Senthil G, Ozelius LJ. Intragenic Cis and Trans modification of genetic susceptibility in DYT1 torsion dystonia. Am J Hum Genet. 2007;80:1188–1193. doi: 10.1086/518427. [DOI] [PMC free article] [PubMed] [Google Scholar]
- Saunders-Pullman R, Raymond D, Senthil G, Kramer P, Ohmann E, Deligtisch A, Shanker V, Greene P, Tabamo R, Huang N, Tagliati M, Kavanagh P, Soto-Valencia J, Aguiar Pde C, Risch N, Ozelius L, Bressman S. Narrowing the DYT6 dystonia region and evidence for locus heterogeneity in the Amish-Mennonites. Am J Med Genet A. 2007;143A:2098–2105. doi: 10.1002/ajmg.a.31887. [DOI] [PubMed] [Google Scholar]
- Schmahmann JD, Doyon J, Toga AW, Petrides M, Evans AC. San Diego: Academic; 2000. MRI atlas of the human cerebellum. [DOI] [PubMed] [Google Scholar]
- Sokoloff L. Energetics of functional activation in neural tissues. Neurochem Res. 1999;24:321–329. doi: 10.1023/a:1022534709672. [DOI] [PubMed] [Google Scholar]
- Trošt M, Carbon M, Edwards C, Ma Y, Raymond D, Mentis MJ, Moeller JR, Bressman SB, Eidelberg D. Primary dystonia: is abnormal functional brain architecture linked to genotype? Ann Neurol. 2002;52:853–856. doi: 10.1002/ana.10418. [DOI] [PubMed] [Google Scholar]
- Vidailhet M, Vercueil L, Houeto JL, Krystkowiak P, Lagrange C, Yelnik J, Bardinet E, Benabid AL, Navarro S, Dormont D, Grand S, Blond S, Ardouin C, Pillon B, Dujardin K, Hahn-Barma V, Agid Y, Destée A, Pollak P French SPIDY Study Group. Bilateral, pallidal, deep-brain stimulation in primary generalised dystonia: a prospective 3 year follow-up study. Lancet Neurol. 2007;6:223–229. doi: 10.1016/S1474-4422(07)70035-2. [DOI] [PubMed] [Google Scholar]
- Vitek JL. Pathophysiology of dystonia: a neuronal model. Mov Disord. 2002;17(Suppl 3):S49–S62. doi: 10.1002/mds.10142. [DOI] [PubMed] [Google Scholar]
- Xiao J, Gong S, Zhao Y, LeDoux MS. Developmental expression of rat torsinA transcript and protein. Brain Res Dev Brain Res. 2004;152:47–60. doi: 10.1016/j.devbrainres.2004.05.012. [DOI] [PubMed] [Google Scholar]