Abstract
We have previously shown that endothelial cell matrix metalloprotease 12 (MMP12) and pentraxin 3 (PTX3) overproduction is the main alteration accounting for reduced proneness to angiogenesis in systemic sclerosis (SSc). On this basis, we stably transfected MMP12 and PTX3 in two breast cancer cell lines expressing very low amounts of the target molecules when compared with normal breast epithelial cells, relying on the hypothesis that antiangiogenic molecules released by cancer cells could confer an SSc-like antiangiogenic pattern on target endothelial cells. In Matrigel Boyden chamber invasion and capillary morphogenesis studies, transfected clones reduced endothelial cell invasion and capillary tube formation, which were abolished by tumor cell populations expressing both molecules. The Matrigel sponge assay, performed in vivo in C57/BL6 mice by injecting aliquots of lyophilized culture medium of transfected clones, indicated a similar reduction in angiogenesis. Functional studies have shown that endothelial cells treated with a culture medium of MMP12-expressing clones underwent cleavage of urokinase-type plasminogen activator receptor domain 1 which is indispensable to angiogenesis. We did not observe angiostatin production from plasminogen under the same experimental conditions. PTX3-overexpressing clones showed a powerful anti-fibroblast growth factor 2 (FGF2) activity in FGF2-dependent capillary morphogenesis. We have injected control and transfected clones into nude nu/nu (CD-1) BR mice to study the differential tumor growth pattern. We observed a reduction of tumor growth in transfected clones, which was basically complete when clones expressing both molecules were simultaneously injected. The extent of tumor necrosis suggested an antiangiogenesis-dependent inhibition of tumor development.
Introduction
When tumors undergo the “angiogenic switch,” an expanding vascular bed penetrates into cancerous growth [1–3]. Vessels supply oxygen and nutrients to the tumor, even if a large part of malignant cells survive in a state of hypoxia and nutrient starvation despite hypoxia-dependent mechanisms aimed to promote vascular invasion [4]. Further, tumor cells find a facilitated route for intravasation and metastatic spreading [1].Most human pathologies involving an altered angiogenesis, including cancer, are characterized by excess angiogenesis. Conversely, in systemic sclerosis (SSc), the sufferance of microvessels and the breakdown of their patency lead to chronic tissue hypoxia and to capillary loss that causes vital organ failure [5]. These features suggest an insufficient angiogenic response [6], despite the tissue hypoxia that characterizes the disease. Serum levels of vascular endothelial growth factor (VEGF) and skin expression of both VEGF and its receptors VEGFR-1 and VEGFR-2, as well as serum levels of fibroblast growth factor 2 (FGF2), result as dramatically upregulated throughout different stages of SSc [7,8], but these features are not sufficient to trigger the angiogenic process in hypoxic SSc tissues. Our comparative studies on dermal microvascular endothelial cells (MVECs) of normal subjects (N-MVEC) and SSc patients (SSc-MVEC) revealed that SSc-MVEC, largely overexpressing proangiogenic factors, overproduce and secrete two antiangiogenic molecules, namely, MMP12 and pentraxin 3 (PTX3) [9–11]. MMP12 is a metalloprotease that cleaves the domain 1 (D1) of urokinase-type plasminogen activator receptor (uPAR) [9], thereby preventing uPAR binding of the uPA and uPAR interaction with vitronectin and β2-integrin. Such interactions are essential for the migration-degradation-adhesion phases of the endothelial cell engaged in angiogenesis [9,10]. PTX3 [11,12] is a soluble pattern recognition receptor with many functions, including inhibition of FGF2-dependent angiogenesis [12,13]. On this basis, we have induced breast cancer cells to overproduce MMP12 and PTX3, with the aim to control tumor-dependent angiogenesis. Transfection of malignant cells with either one of the two molecules resulted into a striking inhibition of endothelial cell proneness to develop in vitro angiogenesis and of tumor angiogenesis in vivo, which were abolished by the cumulative effect of tumor cell populations expressing both molecules.
Materials and Methods
Cell Lines
Human microvascular endothelial cells (MVECs) were isolated from skin biopsies of the hands in six healthy patients undergoing surgery for traumatic events at the hands, as reported [9–11], and were maintained in complete endothelial cell growth medium as described [9]. The study was approved by the local ethical committee, and a written informed consent form was obtained from each subject enrolled. Normal breast ductal epithelial cells (line HB2), provided by Prof. Ida Pucci-Minafra (Palermo, Italy), were grown as previously described [14]. Human mammary carcinoma cell lines MCF-7 and MDA-MB-231, purchased from American Type Culture Collection (Manassas, VA), were grown in RPMI-1640 (Euroclone, Milano, Italy), added with 2 mM glutamine, 100 IU/ml penicillin, 100 µg/ml streptomycin, and 10% fetal bovine serum (FBS; Euroclone).
Detection of Transcripts by Reverse Transcription-Polymerase Chain Reaction
The expression of MMP12 and PTX3 genes was measured by reverse transcription-polymerase chain reaction (PCR) assay as described [9,10]. PCR was performed in a thermocycler, and the reaction products were analyzed by electrophoresis in 1% agarose gel containing ethidium bromide followed by photography under ultraviolet illumination using Polaroid positive/negative instant films (Polaroid Italia SpA, Varese, Italy), as reported elsewhere [9]. Primers for MMP12, PTX3, and GAPDH, cycling conditions, and size of the final products are reported in Table 1.
Table 1.
Sequences of Primers.
| A) Primers for Retrotranscription of Specific Sequences of MMP12 and PTX3 to be Inserted within Vectors |
| MMP12 |
| Forward: ATG CGG TAC CAT GGG GAA GTT TCT TCT AAT A |
| Reverse: ATG CCT CGA GCT ATT TAT CGT CAT CGT CTT TGT AGT AAC CAA ACC AGC TAT TGC TT |
| PTX3 |
| Forward: TAC CGT CAT GGG GCA TCT CCT TGC GAT TCT |
| Reverse: ACG CTC GAG CTA TTT ATC GTC ATC GTC TTT GTA GTC TGA AAC ATA CTG AGC TCC TCC A |
| B) Primers for Evaluation of Expression Pattern of MMP12 and PTX3 | |||
| Primers | Sequence | Size (bp) | Cycling Profile |
| MMP12 | Forward: CCA CTG CTT CTG GAG CTC TT | 450 | 94°C, 45 sec |
| 58°C, 45 sec | |||
| Reverse: GCG TAG TCA ACA TCC TCA CG | 72°C, 1 min | ||
| 35 cycles total | |||
| PTX3 | Forward: GTG GGT GGA GAG GAG AAC AA | 400 | 94°C, 1 min |
| 53°C, 1 min | |||
| Reverse: TTC CTC CCT CAG GAA CAA TG | 72°C, 1 min | ||
| 35 cycles total | |||
| GAPDH | Forward: CCA CCC ATG GCA AAT TCC ATG GCA | 598 | 94°C, 1 min |
| 56°C, 1 min | |||
| Reverse: TCT AGA CGG CAG GTC AGG TCC ACC | 72°C, 1 min | ||
| 35 cycles total | |||
MMP12 and PTX3 Stable Transfection
MCF-7 and MDA-MB-231 cells were stably transfected with human MMP12 or PTX3 genes obtained by retrotranscription. One microgram of RNA was extracted from HeLa and PCR-amplified by specific primers for MMP12 and PTX3. Reverse primers contained in the 3′ the sequence corresponding to the eight amino acids of the FLAG. The forward and reverse primers for each gene are reported in Table 1. The PCR fragments containing the entire ORF of MMP12 and PTX3 were cloned in XhoI and KpnI sites of pCDNA3.1+ vector, carrying the G418 resistance sequence (Invitrogen Srl, Milano, Italy), to obtain the pCDNA3.1+MMP12-FLAG and pCDNA3.1+PTX3-FLAG expression vectors. MCF-7 and MDA-MB-231 (7 x 10⁶) cells were transfected by DharmaFECT reagent (Invitrogen) as described in the instructions of the manufacturer, with 3.4 µg of pCDNA3.1+MMP12-FLAG, pCDNA3.1+PTX3-FLAG, and pCDNA3.1+ empty vector, respectively, and analyzed for expression 48 hours after transfection. The medium containing the MMP12- or PTX3-FLAG was immunoprecipitated by EZview Red ANTI-FLAG M2 Affinity Gel (Sigma, St Louis, MO) and analyzed by immunorevelation using the anti-FLAG monoclonal antibody (mAb; Sigma). The stable clones were obtained by selection of transfected cells with G418 (800 µg/ml; Sigma) administered 48 hours after transfection. The G418-resistant clones were isolated and analyzed as described previously for the flagged protein expression levels.
In Vitro Parameters of Angiogenesis
Invasion assay
The Boyden chamber assay, where upper and lower wells were separated by a porous membrane coated with Matrigel, was used to evaluate cell invasion as described [9,15]. A total of 8 x 10³ MVECs were placed in the upper chamber for each point in culture medium added with 2% fetal calf serum. Control or transfected cells were placed in the lower compartment, and migration was allowed to occur for 6 hours at 37°C in 5% CO2. Mobilization was measured by counting the number of cells moving across the filter. Each point was performed in triplicate. Migration was expressed as the mean percentage of basal response ± SEM.
Capillary morphogenesis assay
Matrigel (0.5 ml; 10–12 mg/ml) was pipetted into 13-mm tissue culture wells and polymerized for 30 minutes to 1 hour at 37°C as previously described [9]. MVECs were plated (60 x 103/ml) in endothelial cell growth medium[9]. Capillary morphogenesis was recorded after 6 and 24 hours with an inverted microscope (Leitz DM-IRB, Leico Microsystem Srl, Milano, Italy) equipped with CCD optics and a digital analysis system. Results were quantified at 6 hours by measuring the percent field occupancy of capillary projections. Six to nine photographic fields from three plates were scanned for each point.
Western Blot Analysis
Cell lysates were obtained, processed, and blotted as described [9]. The primary antibodies used were as follows: anti-MMP12 (1 mg/ml, 1:500, catalog no. AB19051; Chemicon International, Temecula, CA), anti-PTX3 (1 mg/ml, 1:500, catalog no. ALX-804-463; Alexis Biochemicals Axxora, LLC, San Diego, CA), anti-FLAG (10 µg/ml, 1:5000, catalog no. F3165; Sigma), and anti-uPAR-D1 (500 µg/ml, 1:400, catalog no. 3931; American Diagnostica, Stamford, CT). The same procedure was used for detection of MMP12 and PTX3 after immunoprecipitation of flagged proteins from culture medium performed according to the instructions of the manufacturer. After incubation with horseradish peroxidase-conjugated donkey antimouse or antirabbit immunoglobulin G(IgG; 1:5000) for 1 hour (Amersham Bioscience, GE Healthcare Europe, Milano, Italy), PTX3-antibody immune complexes were detected with the ECL Detection System (Amersham Bioscience). MMP12-antibody and Flag protein-antibody complexes were revealed by an Odyssey Infrared Imaging System, using IRDye 800 CW goat antimouse IgG (1:12,000, cat. FE30926220; LI-COR Biosciences, M-Medical, Milano, Italy) and Alexa Fluor 680 goat antirabbit IgG (1:12,000, cat. A21076; Invitrogen) as fluorescent secondary antibodies according to the instructions provided by the manufacturers.
Preparation of Conditioned Medium
Once at semiconfluence in T75 flasks, selected clones were washed with PBS and maintained 72 hours in 10-ml serum-free culture medium. The medium was then subjected to dialysis against 2000 ml of distilled H2O for three times and lyophilized. Each lyophilized sample was reconstituted in 200 µl of distilled water and used for the Matrigel sponge assay.
Angiostatin Production
Ten milliliters of serum-free conditioned medium (CM) was prepared as described previously and reconstituted in 200 µl of distilled water. Reconstituted samples were incubated overnight at 37°C with plasminogen (final concentration, 10 µg/ml) [16]. Angiostatin production was evaluated by Western blot analysis of samples with antiangiostatin antibodies.
Matrigel Sponge Assay
Aliquots of 50 µl of reconstituted CM, containing 50 U/ml heparin, were added to unpolymerized Matrigel at 4°C at a final volume of 0.6 ml. The Matrigel suspension was injected subcutaneously into the flanks of C57/BL6 male mice (Charles River, Calco [Lecco], Italy) using a cold syringe. At body temperature, the Matrigel polymerizes to a solid gel, which becomes vascularized within 4 days in response to angiogenic substances. Pellets were removed, photographed, minced, and diluted in water to measure the hemoglobin content with a Drabkin reagent kit (Sigma).
In Vivo Tumor Growth and Histology
Breast tumors were obtained by subcutaneous injection of 2.5 x 10⁶ MDA cells or 4 x 10⁶ MCF-7 cells transfected with various plasmids, mixed with liquid Matrigel (final volume, 300 µl), in the flanks of 6-week-old nude nu/nu (CD-1) BR mice (Charles River). Four mice were treated with empty plasmid-transfected cells, four mice with cells encoding MMP12 (pMMP12), and four mice with cells encoding PTX3 (pPTX3). The last four mice were inoculated with cell mix composed of the two groups (pMMP12 + pPTX3). Tumor growth was monitored at regular intervals by measuring two tumor diameters with calipers and calculating the tumor volumes with the following formula: length x width2 / 2. On day 23, animals were killed, and the tumors were removed, weighed, and processed for histologic analysis performed using the Azan-Mallory trichromic stain. The method couples a nuclear staining obtained by carbofuchsine with a cytoplasm staining obtained with Orange G, whereas connective tissue is revealed by aniline blue. Control Matrigel samples stained from orange to orange-red. A single tumor enucleated from each treated animal was paraffin-embedded, and serial sections of each tumor were prepared and stained with the Azan-Mallory stain. Three slides for each tumor were subjected to image analysis by using a Leica DMR-DC200 light microscope equipped with Leica DC200 digital imaging system (Leica Camera AG, Solms, Germany). After examining of three to six fields/slide, we determined the percentage of tumor cells within the tumor mass compared with Matrigel and necrosis.
Statistical Analysis
Results are expressed as means ± SD for (n) experiments. Multiple comparisons were performed by the Student-Newman-Keuls test after demonstration of significant differences among medians by nonparametric variance analysis according to Kruskal-Wallis.
Results
Characterization of Target Molecules in Human Normal and Breast Carcinoma Cells and Evaluation of Differential Angiogenic Properties In Vitro
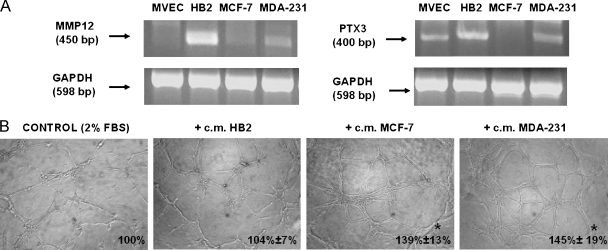
MMP12 and PTX3 expression was evaluated by reverse transcription-PCR in two lines of mammary carcinoma cells (MCF-7 and MDA-MB-231) and HB2 normal mammary epithelial cells. Figure 1A shows that both breast carcinoma lines expressed lower amounts of MMP12 with respect to normal mammary cells. In particular, MMP12 was strongly downregulated in MCF-7 cells. PTX3 expression exhibited a similar pattern. CM-challenged capillary morphogenesis assay indicated that breast carcinoma lines were more efficient than normal ones in stimulating capillary-like tube formation of target MVEC (Figure 1B).
Figure 1.
Expression of MMP12 and PTX3 in MVECs, in breast normal cells, and carcinoma cells and capillary morphogenesis activity of their CM. (A) Semiquantitative PCR of MMP12 and PTX3 complementary DNA in the indicated cells. Numbers on the left indicate the size of PCR products in base pairs (bp). GAPDH indicates glyceraldehyde-3-phosphate dehydrogenase. (B) Constitutive capillary morphogenesis activity of normal and breast epithelial cells (HB2) and of breast cancer cells at 6 hours after seeding. Pictures show the results of a typical experiment of three experiments performed in triplicate. Numbers on the lower right side of each picture indicate the percent field occupancy of capillary plexus as described in the Materials and Methods section. Quantification was performed only at 6 hours after seeding and was obtained by scanning of six to nine photographic fields for each condition.
Stable Transfection of Breast Carcinoma Cells and Evaluation of Target Proteins Expression
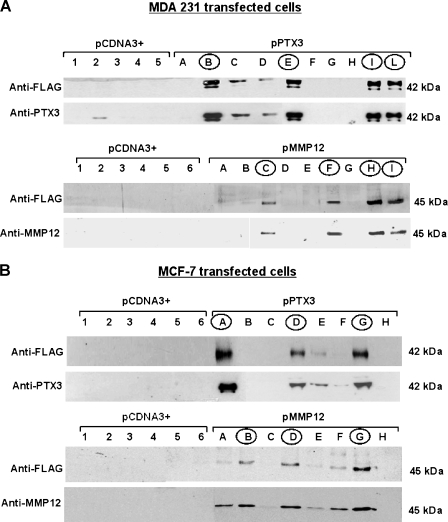
The MCF-7 and MDA-MB-231 lines were stably transfected with human MMP12 or PTX3 genes obtained by retrotranscription. Figure 2, A and B, shows the results in MDA-MB-231 and MCF-7 breast carcinoma cells, respectively. Western blot analysis of cell lysates of pCDNA3+ and transfected cells with anti-FLAG, anti-PTX3, and anti-MMP12 mAbs allowed us to identify several clones showing a high expression of the relevant molecules. Selected clones for each transfection were indicated with capital roman letters (circled in the figures) and used in vitro and in vivo to evaluate their angiogenic abilities compared with control pCDNA3+ clones.
Figure 2.
Stable transfection of breast carcinoma cellswithMMP12 and PTX3. (A and B) Western blot analysis ofMDA-MB-231 and ofMCF-7 cells, respectively, to identify transfected clones. Each panel shows Western blot analysis for PTX3 and MMP12 expressed by transfected clones, identified either with anti-PTX3 and anti-MMP12 mAbs or with anti-FLAG antibodies. pCDNA3+ clones are marked with numbers, whereas pPTX3 and pMMP12 clones are indicated with capital letters. pPTX3 and pMMP12 clones selected on the basis of relevant protein expression of the transfected plasmid are encircled. Numbers on the right indicate molecular weights expressed in kilodaltons.
New Angiogenic Properties In Vitro Acquired by Breast Cancer Cells after Transfection
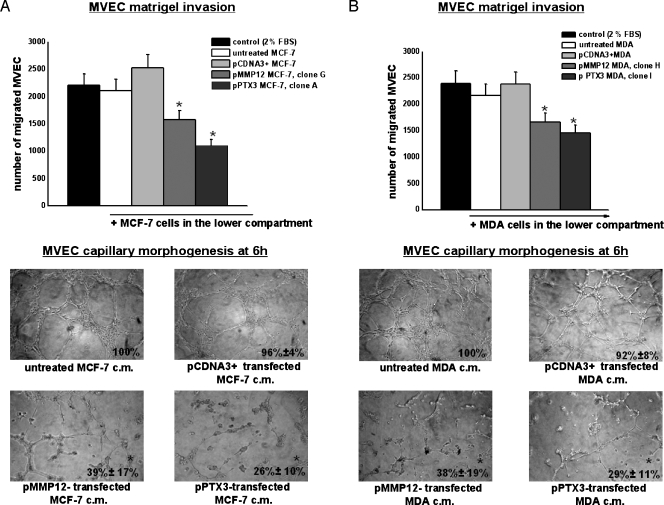
We measured in vitro angiogenesis by evaluating the ability of cells to induce invasion and capillary morphogenesis of MVEC. Control or transfected cells were placed in the lower well of the Boyden chamber (10 x 103 cells per well) to investigate their ability to stimulate MVEC invasion of Matrigel-coated porous filters. As shown in the upper part of Figure 3A, transfected MCF-7 (clone A-PTX3 and clone G-MMP12) induced a decrease of MVEC invasion. The lower part of the same figure shows capillary morphogenesis performed with MVEC in the presence of CM of MCF-7 clone G for MMP12 and clone A for PTX3. Similar results (not shown) were obtained with all selected MCF-7 clones (the ones encircled in Figure 2B). Figure 3B shows the results obtained in the same experiments performed with transfected MDA-MB-231 in Matrigel invasion and capillary morphogenesis (clone H for MMP12 and clone I for PTX3). Similar results (not shown) were obtained with all selected MDA-MB-231 clones (the ones encircled in Figure 2A). The treatment drastically inhibited MVEC ability to invade Matrigel and to form capillary-like tubes. Cell proliferation was also evaluated in both cell lines and related clones. Growth kinetics of control, pCDNA3+, pMMP12, and pPTX3 clones did not substantially differ within each cell line (not shown).
Figure 3.
MMP12- and PTX3-transfected breast carcinoma cells-dependent Matrigel invasion and capillary morphogenesis of MVEC. (A) Upper part of the figure shows Matrigel invasion of MVEC added to the upper compartment of the migration chamber in the presence of MCF-7 cells transfected with pMMP12 (clone G) and with pPTX3 (clone A). Results are the mean of three different experiments performed in triplicate. Similar results were also obtained with MCF-7 clones B and D for pMMP12 and with MCF-7 clones D and G for pPTX3. The lower part of the figure shows capillary morphogenesis at 6 hours with CM of MCF-7 clone G for pMMP12, and clone A for pPTX3. Similar results were obtained with other MCF-7 clones. Pictures show the results of a typical experiment of three experiments performed in triplicate. For quantification of capillary morphogenesis, refer to the legend of Figure 1. *P < .05, significantly different from control. (B) Same experiments as in panel A performed by using transfected MDA-MB-231 clones. Results of Matrigel invasion obtained with MDA-MB-231 clone H for pMMP12 and clone I for pPTX3 are shown. CM from the same clones was used in the capillary morphogenesis experiments shown in the lower part of the figure. All other MDA clones gave similar results. The numbers of experimental replicas were the same reported for panel A. Pictures show the results of a typical experiment of three experiments performed in triplicate. *P < .05, significantly different from control.
Evidences of Anti-FGF2 Activity and of uPAR Cleavage of PTX3 and MMP12 Clones
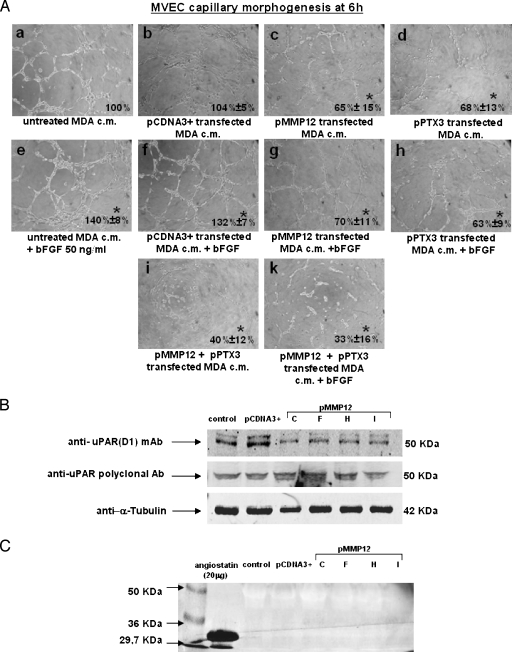
In these studies, we used MDA-MB-231 clone E-PTX3 and clone H-MMP12 and MCF-7 clone A-PTX3 and clone G-MMP12. Figure 4A shows the results obtained with MDA clones. Whereas exogenous addition of FGF2 (50 ng/ml) increased MVEC capillary morphogenesis of both control (subpanel e compared with subpanel a) and pCDNA3+-transfected MDA cells (subpanel f compared with subpanel b), CM of PTX3-transfected MDA cells reduced MVEC capillary morphogenesis with respect to both control (subpanel d compared with subpanel a) untreated and pCDNA3+-transfected MDA cells (subpanel d compared with subpanel b). An FGF2-dependent increase of capillary morphogenesis (subpanels e and f) was completely reverted when FGF2 was added to CM of PTX3-transfected MDA cells (subpanel h). These data are in agreement with the reported anti-FGF2 activity of PTX3 [13] and suggest that the antiangiogenic activity of PTX3 produced by transfected MDA is related to FGF2 inhibition. Similarly, MMP12 transfection induced a decrease of capillary morphogenesis either alone (subpanel c) or on addition of FGF2 (subpanel g). Mixed CM (a combination of CM from MMP12- and PTX3-transfected MDA), produced a strong inhibition of MVEC capillary morphogenesis under both control (subpanel i) and FGF2 stimulation conditions (subpanel k). MCF-7 clones gave similar results (not shown).
Anti-uPAR D1 mAb, which recognizes the three-domain native form of uPAR [9,10], indicated a striking decrease of uPAR-D1 in MVEC incubated with MDA clones producing high amounts of MMP12 (Figure 4B), whereas a polyclonal antibody, which recognizes both native and truncated uPAR, did not show any difference between control and MMP12-transfected clones.
Figure 4.
Activity on MVEC capillarymorphogenesis of transfected MDA clones in the presence or absence of FGF2. MVEC uPAR cleavage and angiostatin production. (A) MVEC capillary morphogenesis in the conditions reported in the legend of each picture. In the experiments shown in this panel, the MDA-MB-231 clones used were clone H for pMMP12 and clone E for pPTX3. Pictures show the results of a typical experiment of three experiments performed in triplicate bFGF, basic fibroblast growth factor. For quantification, refer to the legend of Figure 1. *P < .05, significantly different fromcontrol. Similar results were obtained withMCF-7 clones (not shown). (B) Western blot analysis of MVEC with uPAR anti-D1 mAb after incubating with CM from all the selected clones of pMMP12-transfected MDA-MB-231 breast carcinoma cells. α-Tubulin indicates loading control. Numbers on the right indicate molecular weights expressed in kilodaltons. MCF-7 clones gave similar results (not shown). (C) Western blot analysis of aliquots of pMMP12-transfected MDA-MB-231 clones medium incubated with standard plasminogen and probed with antiangiostatin mAb. Ten milliliters of CM from each clone was dialyzed against distilled water, lyophilized, and reconstituted in 200 µl of distilled water. Reconstituted samples were incubated overnight at 37°C with plasminogen (final concentration, 10 µg/ml). Aliquots containing 50 µg of proteins, showing similar Ponceau Red densitometric patterns, were applied to each lane. The figure shows the results of a typical experiment of three different experiments that gave similar results (not shown). MCF-7 clones gave similar results.
Angiostatin, previously shown in the blood of mice grafted with melanoma cells overexpressing MMP12 [17], has been considered the effector of the antiangiogenic activity of MMP12. We have evaluated angiostatin production from plasminogen exogenously added to CM of MMP12-transfected MDA (clones C, F, H, I; Figure 4C). We did not reveal any angiostatin production, and similar results were also obtained with MCF-7 clones overexpressing MMP12 (not shown).
Matrigel Sponge Assay
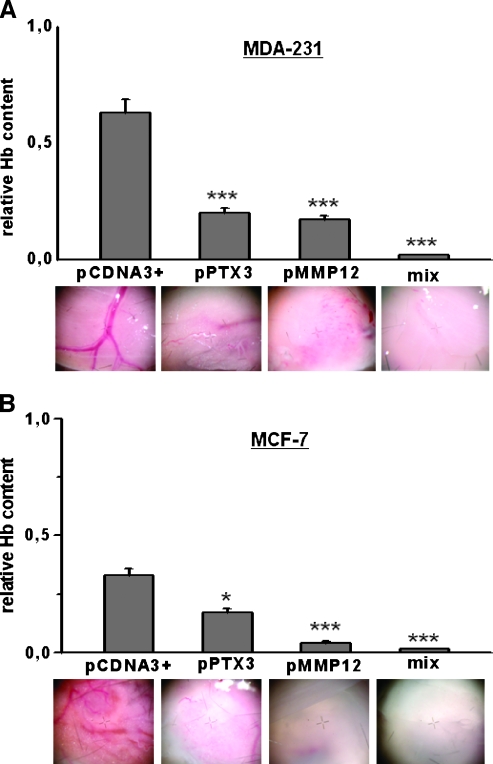
To measure in vivo angiogenesis, we performed a Matrigel sponge assay. Vascularization was evaluated in samples recovered from injected Matrigel sponges containing aliquots of 50 µl of reconstituted CM from control (pCDNA3+ alone) and MMP12 or PTX3 clones of MDA-MB-231 (Figure 5A) and MCF-7 cells (Figure 5B) in addition to heparin (50 U/ml). Groups of four to eight pellets were injected for each treatment. Individual Matrigel sponges were recovered at autopsy 5 days after implants. Whereas angiogenesis was stimulated by control cells culture medium, it was inhibited by both MMP12- and PTX3-expressing clones, as shown also by decreases in hemoglobin content. The effect was particularly relevant when a mixture of media obtained from MMP12- and PTX3-transfected clones was used.
Figure 5.
Matrigel sponge assay (in vivo angiogenesis). Angiogenesis in a Matrigel sponge assay by the addition of Matrigel containing heparin (50 U/ml) and aliquots of 50 µl of reconstituted CM, evaluated by hemoglobin (Hb) content. (A) Results obtained with MDA-321 CM. For PTX3, we used CM prepared from clone B (Figure 2A); for MMP12, we used CM prepared from clone I (Figure 2A); the mix was a CM composed of 50% clone B and 50% clone I. Graphs are shown as mean ± SE; ***P < .001 (Student's t test). At the bottom of each column, a representative photograph, taken at the stereomicroscope, of individual Matrigel sponges recovered at autopsy for the corresponding condition is shown. Clone I for PTX3 and clone H for MMP12 gave similar results (not shown). (B) Results obtained with MCF-7CM. For PTX3, we used CM prepared from clone A (Figure 2B); for MMP12, we used CM prepared from clone G (Figure 2B); the mix was a CM composed of 50% clone A and 50% clone G. Graphs are shown as mean ± SE; ***P < .001, *P < .05 (Student's t test). At the bottom of each column, a representative photograph, taken at the stereomicroscope, of individual Matrigel sponges recovered at autopsy for the corresponding condition is shown. Clone G for PTX3 and clone D for MMP12 gave similar results (not shown).
Tumor Development in the nu/nu Mice
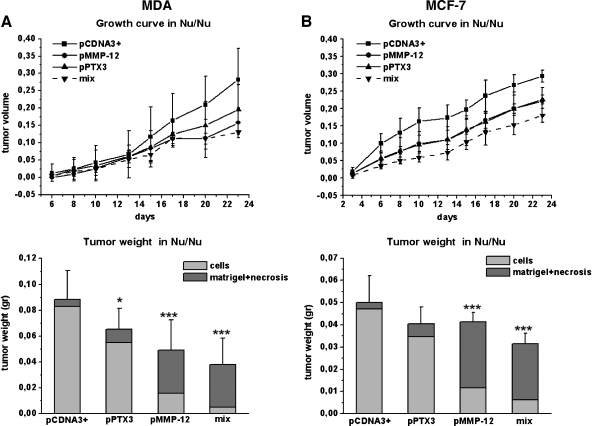
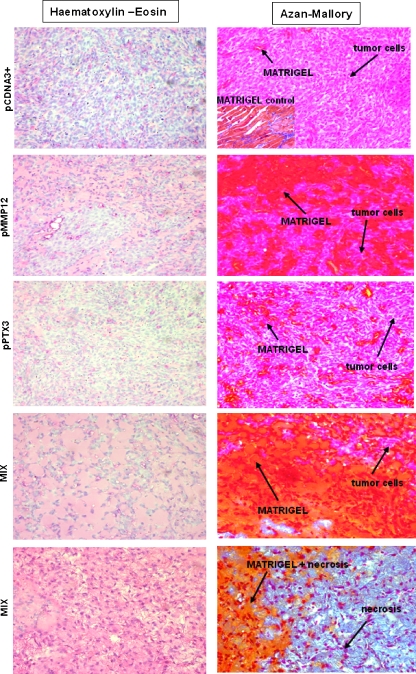
Figure 6 shows the MDA (A) and MCF-7 (B) growth curve and final tumor size in nu/nu (CD-1) BR mice. Reduction of tumor volume was observed with both MMP12- and PTX3-transfected clones. Injection of mixed cell populations, each one expressing a single transfected gene (MMP12 and PTX3), resulted into an almost complete impairment of tumor growth as shown by histologic analysis of tumor samples stained with Azan-Mallory stain (Figure 7). The Azan-Mallory stain allowed to identify epithelial cells (red nuclei and pale red cytoplasm), Matrigel (from orange to orange-red), and tissue necrosis (a few pale red nuclei within a blue collagen large meshwork, which is the chief component of the necrotic tissue). By the image analysis equipment described under Materials and Methods, we determined the percentage of tumor cells within the tumor mass. MDA-pCDNA3 cells represented 93.7 ± 8% of the total tumor size, MDA-MMP12 cells represented 32.6 ± 6% of the total tumor size, and MDA-PTX3 cells represented 84.2 ± 11% of the total tumor size, whereas the mixture of MDA-MMP12/MDA-PTX3 cells resulted into a real tumor cell burden representing only 13.5 ± 4% of the total tumor size. MCF-7 cells gave similar results as shown in the lower graph of panel B in Figure 6.
Figure 6.
Tumor growth in vivo. Breast tumors were obtained by subcutaneous injection of 2.5 x 10⁶ MDA cells (A) and 4 x 10⁶ MCF-7 cells (B) mixed with liquid Matrigel (final volume, 300 µl) in the flanks of 6-week-old nude nu/nu (CD-1) BR mice. MDA and MCF-7 cells were transfected with different plasmid as shown. The 16 animals used for each cell line were treated as described in the Materials and Methods section. Briefly, four mice were injected with control pCDNA3+ cells (MDA or MCF-7), four mice with a pPTX3 clone (clone I for MDA and clone A for MCF-7), four mice with a pMMP12 clone (clone H for MDA and clone G for MCF-7), and four mice with a cell mix of both clones of MDA and MCF-7. Tumor growth was monitored at regular intervals by measuring two tumor diameters with calipers and calculating the tumor volumes with the following formula: length x width2 / 2. On day 23, the animals were killed, and the tumors were removed, weighed, and fixed in formalin. On the basis of image analysis of Azan-Mallory-stained tumor slices, the percent amount of cells over the whole mass recovered at autopsy (cell, Matrigel, and necrosis, when present) was calculated. Statistical analysis was therefore performed only for the cellular content (see the lower graphs of panels A and B). Graphs are shown as mean ± SE; ***P < .001, *P < .05 (Student's t test).
Figure 7.
Histologic diagnosis of the tumors recovered at autopsy. Tumor slices were stained with hematoxylin-eosin and with Azan-Mallory stain. Owing to the intense differential dye affinity of breast cancer cells, Matrigel, and necrosis, it was possible to subject stained slices to image analysis by using a Leica DMR-DC200 light microscope equipped with Leica DC200 digital imaging system (Leica Camera AG) and to determine the percentage of tumor cells within the tumor mass obtained at autopsy. The figure shows the results obtained with MDA cells. MCF-7 cells provided similar images. Pictures shown were taken at a magnification of x40. Experimental conditions are reported on the left of each line of pictures. The inset in the upper right panel shows the staining affinity of a cell-free Matrigel mass recovered at autopsy.
Discussion
We have shown that overexpression of MMP12 and PTX3 by stable transfection in human mammary carcinoma cells reduced their ability to stimulate angiogenesis both in vitro and in vivo. The choice of the two molecules to be overexpressed by cancer cells through transfection of the relevant complementary DNA was based on previous demonstrations of their antiangiogenic role in MVEC isolated from skin biopsies of patients affected by the diffuse form of SSc [9–11], basically relying on the working hypothesis that antiangiogenic molecules released by cancer cells could confer an SSc-like antiangiogenic pattern on target MVEC. MMP12 released from stably transfected breast cancer cells cleaved MVEC uPAR. uPAR cleavage-dependent decrease of MVEC angiogenesis has to be related to the loss of the well-known properties of native full-length uPAR to interact with integrins [18] as well as to the parallel reduction of uPAR and integrins' abilities to interact with extracellular matrix molecules [19,20]. Further, uPARD1 cleavage cancels uPA binding to uPAR, thereby eliminating uPAR-driven pericellular proteolysis that enables endothelial cells to move within tissues. Taken together, such new features result into the loss of MVEC “grip-and-go” properties required to perform a complete angiogenesis program. Antiangiogenic properties of MMP12 transfection into murine melanoma cells, eventuating into a reduction of tumor growth in grafted animals, were shown in a previous study [20]. In this study, the loss of tumor vasculature was related to the property of MMP12 to give origin to angiostatin by cleavage of plasminogen precursor molecule. Under our experimental conditions, we did not observe any angiostatin generation, even in plasminogen-enriched culture medium of breast cancer cells overproducing MMP12, in line with results previously obtained in other experimental model systems [21–23]. PTX3 belongs to the superfamily of “pattern-recognition receptors” involved in innate immunity. PTX3 also has an antiangiogenic activity, which has been shown to depend on its ability to inhibit FGF2 [12,13]. We have shown that, also under our experimental conditions, PTX3, overproduced by transfected mammary carcinoma cells, inhibits FGF2-dependent stimulation of capillary morphogenesis by MVEC in vitro. Furthermore, we have shown that simultaneous use of CM prepared from breast cancer clones overexpressing MMP12 and PTX3 produced dramatic inhibition of vascular tube formation both in vitro and in vivo. Interestingly, the CM of cells overproducing MMP12 also inhibited the proangiogenic effects of exogenous FGF2 as revealed by capillary morphogenesis experiments. This observation is in line with the reported uPAR requirement on endothelial cells stimulated to enter an angiogenic program by FGF2 [24,25]. One may in fact consider that the uPAR cleavage activity of MMP12 is equally exerted either on unstimulated or in FGF2-challenged MVEC. Our data show a weaker effect of PTX3 in vivo with respect to its activity in vitro. In in vitro experiments, we have observed that the presence of exogenously added FGF2 fully discloses the antiangiogenic activity of PTX3. Therefore, one may reasonably suppose that the FGF2 concentration within the tumor microenvironment is not sufficient to make the antiangiogenic activity of PTX3 completely evident. Finally, the remarkable effect on angiogenesis of the combination of MMP12 and PTX3 is an attractive approach to delivery in vivo of antiangiogenic genes to improve the treatment outcome in aggressive tumors. The results of this study suggest that such an approach may provide a novel strategy for cancer gene therapy by targeting tumor vasculature.
Footnotes
This work was supported by grants from Ministero Italiano dell'Università e della Ricerca (Progetti di Ricerca di Interesse Nazionale), Ente Cassa di Risparmio di Firenze, Fondazione Cassa di Risparmio di Lucca, Toscana Life Sciences (Siena), AIRC, and Ministero Salute Progetto Integrato. Dr. Francesca Margheri and Dr. Agostina Ventura developed this study in the frame of a Federazione Italiana Ricerca sul Cancro fellowship.
References
- 1.Wittekind C, Neid M. Cancer invasion and metastasis. Oncology. 2005;69:14–16. doi: 10.1159/000086626. [DOI] [PubMed] [Google Scholar]
- 2.Carmeliet P, Collen D. Transgenic mouse models in angiogenesis and cardiovascular disease. J Pathol. 2000;190:387–405. doi: 10.1002/(SICI)1096-9896(200002)190:3<387::AID-PATH595>3.0.CO;2-R. [DOI] [PubMed] [Google Scholar]
- 3.Ferrara N. VEGF: an update on biological and therapeutic aspects. Curr Opin Biotechnol. 2000;11:617–624. doi: 10.1016/s0958-1669(00)00153-1. [DOI] [PubMed] [Google Scholar]
- 4.Maxwell PH. The HIF pathway in cancer (2005) Semin Cell Dev Biol. 2005;16:523–530. doi: 10.1016/j.semcdb.2005.03.001. [DOI] [PubMed] [Google Scholar]
- 5.Cutolo M, Grassi W, Matucci-Cerinic M. Raynaud's phenomenon and the role of capillaroscopy. Arthritis Rheum. 2003;48:3023–3030. doi: 10.1002/art.11310. [DOI] [PubMed] [Google Scholar]
- 6.LeRoy EC. Systemic sclerosis: a vascular perspective. Rheum Dis Clin North Am. 1996;22:675–694. doi: 10.1016/s0889-857x(05)70295-7. [DOI] [PubMed] [Google Scholar]
- 7.Distler O, Distler JH, Scheid A, Acker T, Hirth A, Rethage J, Michel BA, Gay RE, Muller-Ladner U, Matucci-Cerinic M, et al. Uncontrolled expression of vascular endothelial growth factor and its receptors leads to insufficient skin angiogenesis in patients with systemic sclerosis. Circ Res. 2004;95:109–116. doi: 10.1161/01.RES.0000134644.89917.96. [DOI] [PubMed] [Google Scholar]
- 8.Kuwana M, Okazaki Y, Yasuoka H, Kawakami Y, Ikeda Y. Defective vasculogenesis in systemic sclerosis. Lancet. 2004;364:603–610. doi: 10.1016/S0140-6736(04)16853-0. [DOI] [PubMed] [Google Scholar]
- 9.D'Alessio S, Fibbi G, Cinelli M, Guiducci S, Del Rosso A, Margheri F, Serrati S, Pucci M, Kahaleh B, Fan P, et al. Matrix metalloproteinase 12-dependent cleavage of urokinase receptor in systemic sclerosis microvascular endothelial cells results in impaired angiogenesis. Arthritis Rheum. 2004;50:3275–3285. doi: 10.1002/art.20562. [DOI] [PubMed] [Google Scholar]
- 10.Margheri F, Manetti M, Serratì S, Nosi D, Pucci M, Matucci-Cerinic M, Kahaleh B, Bazzichi L, Fibbi G, Ibba-Manneschi L, et al. Domain 1 of the urokinase-type plasminogen activator receptor is required for its morphologic and functional, β2 integrin-mediated connection with actin cytoskeleton in human microvascular endothelial cells: failure of association in systemic sclerosis endothelial cells. Arthritis Rheum. 2006;54:3926–3938. doi: 10.1002/art.22263. [DOI] [PubMed] [Google Scholar]
- 11.Giusti B, Fibbi G, Margheri F, Serratì S, Rossi L, Poggi F, Lapini I, Magi A, Del Rosso A, Cinelli M, et al. A model of anti-angiogenesis: differential transcriptosome profiling of microvascular endothelial cells from diffuse systemic sclerosis patients. Arthritis Res Ther. 2006;8(4):R115. doi: 10.1186/ar2002. [DOI] [PMC free article] [PubMed] [Google Scholar]
- 12.Presta M, Camozzi M, Salvatori G, Rusnati M. Role of the soluble pattern recognition receptor PTX3 in vascular biology. J Cell Mol Med. 2007;11:723–738. doi: 10.1111/j.1582-4934.2007.00061.x. [DOI] [PMC free article] [PubMed] [Google Scholar]
- 13.Rusnati M, Camozzi M, Moroni E, Bottazzi B, Peri G, Indraccolo S, Amadori A, Mantovani A, Presta M. Selective recognition of fibroblast growth factor-2 by the long pentraxin PTX3 inhibits angiogenesis. Blood. 2004;104:92–99. doi: 10.1182/blood-2003-10-3433. [DOI] [PubMed] [Google Scholar]
- 14.Serratì S, Margheri F, Fibbi G, Di Cara G, Minafra L, Pucci-Minafra I, Lotta F, Annunziato F, Pucci M, Del Rosso M. Endothelial cells and normal breast epithelial cells enhance invasion of breast carcinoma cells by CXCR-4-dependent up-regulation of urokinase-type plasminogen activator receptor (uPAR, CD87) expression. J Pathol. 2008;214:545–554. doi: 10.1002/path.2309. [DOI] [PubMed] [Google Scholar]
- 15.Margheri F, D'Alessio S, Serratí S, Pucci M, Annunziato F, Cosmi L, Liotta F, Angeli R, Angelucci A, Gravina GL, et al. Effects of blocking urokinase receptor signaling by antisense oligonucleotides in a mouse model of experimental prostate cancer bone metastases. Gene Ther. 2005;12:702–714. doi: 10.1038/sj.gt.3302456. [DOI] [PubMed] [Google Scholar]
- 16.Stathakis P, Fitzgerald M, Matthias LJ, Chesterman CN, Hogg PJ. Generation of angiostatin by reduction and proteolysis of plasmin. J Biol Chem. 1997;272:29641–29645. doi: 10.1074/jbc.272.33.20641. [DOI] [PubMed] [Google Scholar]
- 17.Gorrin-Rivas MJ, Arii S, Furutani S, Mizumoto M, Mori A, Hanaki K, Maeda M, Furuyama H, Kondo Y, Imamura M. Mouse macrophage metalloelastase gene transfer into a murine melanoma suppresses primary tumor growth by halting angiogenesis. Clin Cancer Res. 2000;6:1647–1654. [PubMed] [Google Scholar]
- 18.Kugler MC, Wei Y, Chapman HA. Urokinase receptor and integrin interactions. Curr Pharm Des. 2003;9:1565–1574. doi: 10.2174/1381612033454658. [DOI] [PubMed] [Google Scholar]
- 19.Binder BR, Mihaly J, Prager GW. uPAR-uPA-PAI-1 interactions and signaling: a vascular biologist's view. Thromb Haemost. 2007;97:336–342. [PubMed] [Google Scholar]
- 20.Madsen CD, Sidenius N. The interaction between urokinase receptor and vitronectin in cell adhesion and signalling. Eur J Cell Biol. 2008;87:617–629. doi: 10.1016/j.ejcb.2008.02.003. [DOI] [PubMed] [Google Scholar]
- 21.Gately S, Twardowski P, Stack MS, Patrick M, Boggio L, Cundiff DL, Schnaper HW, Madison L, Volpert O, Bouck N, et al. Human prostate carcinoma cells express enzymatic activity that converts human plasminogen to the angiogenesis inhibitor, angiostatin. Cancer Res. 1996;56:4887–4890. [PubMed] [Google Scholar]
- 22.Stathakis P, Fitzgerald M, Matthias LJ, Chesterman CN, Hogg PJ. Generation of angiostatin by reduction and proteolysis of plasmin. Catalysis by a plasmin reductase secreted by cultured cells. Biol Chem. 1997;272:20641–20645. doi: 10.1074/jbc.272.33.20641. [DOI] [PubMed] [Google Scholar]
- 23.Stathakis P, Lay AJ, Fitzgerald M, Schlieker C, Matthias LJ, Hogg PJ. Angiostatin formation involves disulfide bond reduction and proteolysis in kringle 5 of plasmin. J Biol Chem. 1999;274:8910–8916. doi: 10.1074/jbc.274.13.8910. [DOI] [PubMed] [Google Scholar]
- 24.Billottet C, Janji B, Thuery JP, Jouanneau J. Rapid tumor development and potent vescularization are independent events in carcinoma producing FGF-1 or FGF-2. Oncogene. 2002;21:8128–8139. doi: 10.1038/sj.onc.1205935. [DOI] [PubMed] [Google Scholar]
- 25.Cavallaro U, Wu Z, Di Palo A, Montesano R, Pepper MS, Maier JA, Soria MR. FGF-2 stimulates migration of Kaposi's sarcoma-like vascular cells by HGF-dependent relocalization of the urokinase receptor. FASEB J. 1998;12:1027–1034. doi: 10.1096/fasebj.12.11.1027. [DOI] [PubMed] [Google Scholar]


