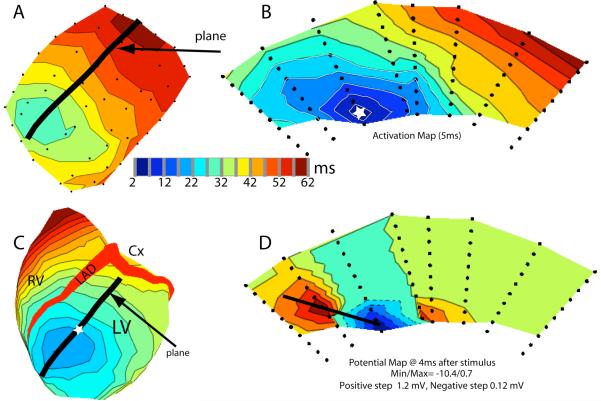
Abstract
Published studies show that ventricular pacing in canine hearts produces three distinct patterns of epicardial excitation: elliptical isochrones near an epicardial pacing site, with asymmetrical bulges; areas with high propagation velocity, up to 2 or 3 m/s and numerous breakthrough sites; lower velocity areas (< 1 m/s) where excitation moves across the epicardial projection of the septum. With increasing pacing depth the magnitude of epicardial potential maxima becomes asymmetrical. The electrophysiological mechanisms that generate the distinct patterns have not been fully elucidated. In this study we investigated those mechanisms experimentally. Under pentobarbital anesthesia epicardial and intramural excitation isochrone and potential maps have been recorded from 22 exposed or isolated dog hearts, by means of epicardial electrode arrays and transmural plunge electrodes. In 5 experiments, a ventricular cavity was perfused with diluted Lugol solution.
Results
The epicardial bulges result from electrotonic attraction from the helically shaped subepicardial portions of the wave front. The high velocity patterns and the associated multiple breakthroughs are due to involvement of the Purkinje network. The low velocity at the septum crossing is due to the missing Purkinje involvement in that area. The asymmetric magnitude of the epicardial potential maxima and the shift of the breakthrough sites provoked by deep stimulation are a consequence of the epi-endocardial obliqueness of the intramural fibers. These results improve our understanding of intramural and epicardial propagation during PVCs and paced beats. This can be useful for interpreting epicardial maps recorded at surgery or inversely computed from body surface ECGs.
Keywords: Ventricular pacing, propagation patterns, Excitation mapping
INTRODUCTION
Knowledge of the mechanisms that govern the spread of excitation in the heart is a necessary prerequisite for understanding and interpreting abnormal sequences that occur in conduction disturbances, cardiac arrhythmias, localized ischemia and myocardial infarctions. With the recent advancements in cardiac resynchronization therapy and other pacing strategies (15, 35) it is even more relevant to better understand the spread of excitation during paced ventricular beats, as affected by the architecture of myocardial fibers and their anisotropic electrical properties.
Experimental data published during the last 20 years show that epicardial and intramural ventricular pacing in canine hearts result in complex patterns of epicardial excitation, with multiple distinct areas of relatively slow and fast propagation (2, 4, 12, 23, 30, 32). Published computer simulations of the spread of excitation in the ventricles, mostly based on eiconal equations, propose possible electrophysiological mechanisms for many of these complex patterns (8, 9, 13, 33) but some of the suggested mechanisms have not yet received experimental confirmation.
In the present experimental study we observed three distinct patterns of epicardial propagation, elicited by ventricular pacing. During epicardial pacing, propagation on the ventricular surface was anisotropic and relatively slow near the pacing site (≈ 0.6 m/s along fibers, ≈ 0.3 m/s across fibers, with local accelerations); became very fast in neighboring regions, where large areas of tissue activated in a few ms, and became slow again (less than 1 m/s) where excitation spread across the epicardial projection of the septum. Subsequently, propagation became very fast again when excitation reached the non-paced ventricle. The three patterns were also observable during intramural pacing, with some variations. The purpose of this work was to investigate the mechanisms underlying the various patterns of epicardial propagation, in particular the role of myocardial anisotropy, fiber architecture and the conduction system.
First specific aim
Numerous experimental studies show that, in canine hearts, a family of concentric, quasi-elliptical isochrones appears on the ventricular surface in the vicinity of an epicardial pacing site (2, 4, 12, 22, 32). Arisi et al. referred to this region as the ”primary area” (2). The major axis of the elliptical isochrones was approximately parallel to the direction of the local subepicardial fibers and the minor axis was perpendicular to fiber direction. A previous study from our group also showed that, at 20–30 ms after the stimulus, the isochrone contours become asymmetrical because of the appearance of conspicuous bulges (32) in the elliptical shape of the isochrone maps. These features were observed on the left and right ventricles (LV and RV) (32). Simulation studies produced these epicardial bulges and attributed them to electrotonic attraction from the helix-shaped intramural portions of the wave front, resulting from the CCW epi-endocardial rotation of the intramural fiber direction (8, 16). To the best of our knowledge, however, this proposed mechanism has not been validated experimentally. The first specific aim of the present investigation was to provide experimental data that would confirm or disprove the mechanism suggested by the simulations.
Second specific aim
In 1992 Arisi et al. (2) studied the spread of excitation on the right ventricular surface of exposed dog hearts during right ventricular epicardial pacing. These authors observed an abrupt acceleration, up to 2 or more m/s, just outside of the “primary area”, in the regions toward which excitation moved across fibers away from the pacing site. Similar features were also observed on the left ventricle (29). Arisi et al. hypothesized that excitation, starting from the epicardial pacing site, reached the endocardium, traversed a Purkinje-ventricular junction (PVJ) in a retrograde direction, entered the Purkinje network and re-entered the ventricular muscle through one or more PVJs. From there, one or more excitation wave fronts moved in an endo-epicardial direction and reached the epicardium at one or more breakthrough sites. The second specific aim of this work was to test the hypothesis that the involvement of the Purkinje conduction system produces the observed abrupt increases in the epicardial apparent propagation speed and the appearance of breakthrough sites. We addressed this issue by recording epicardial and intramural isochrone maps before and after inactivating the conduction system in the relevant ventricle.
Third specific aim
Another observed distinct pattern of propagation consisted of a relative deceleration of propagation where the excitation wave front, elicited by ventricular pacing, crossed the epicardial projection of the interventricular septum, both anteriorly and posteriorly. The third specific aim of this investigation was to test the hypothesis that the slower propagation speed is due to the fact that in those regions the intramural excitation wave front is approximately perpendicular to the surface, whereas it is more parallel to the surface in the high velocity regions.
Fourth specific aim
In previous studies by our group (32), point stimulation at increasing intramural depths produced epicardial potential patterns at 10–14 ms after the stimulus with a central negative area and two peripheral maxima. The axis joining the two maxima was parallel to the orientation of the myocardial fibers near the pacing site for all pacing depths. However, the magnitude of the two maxima was asymmetrical. For an observer looking at the heart from the outside, the magnitude of the right maximum was invariably lower than that of the left maximum, and the difference increased with increasing pacing depth. Moreover, the distance between the right maximum and the epicardial projection of the pacing site increased as a function of pacing depth, except for subendocardial pacing. In the 1994 study we hypothesized that the asymmetry of the maxima was due to the “imbrication” angle (28), i.e., to the epi-endocardial obliqueness of fiber direction, whereby one end of the ellipsoidal intramural wave front points slightly toward the epicardium and the other end points toward the endocardium. We are not aware of any published experimental validation of this hypothesis. The fourth specific aim of the present investigation was to test this hypothesis, by recording intramural isochrone and potential maps, in an attempt to visualize the intramural obliqueness of the ellipsoidal wave front. An additional purpose was to ascertain whether some other predictable effects of the obliqueness of the intramural fibers, namely, the migration of the epicardial breakthrough sites as a function of pacing depths and pacing locations, could be demonstrated in epicardial maps.
To achieve these goals, we recorded between 500 and 1540 unipolar epicardial or intramural electrograms from 22 exposed or isolated dog hearts, using epicardial electrode arrays and/or intramural plunge electrodes, during ventricular pacing from epicardial or intramural sites. In 5 animals, recordings were made before and after inactivation of the conduction system. We then displayed the results as epicardial or intramural isochrone or potential maps.
METHODS
Experimental Procedures
All experimental procedures were approved by the Institutional Animal Care and Use Committee of the University of Utah and are in compliance with the Guide for the Care and Use of Laboratory Animals (10). Twenty-two mongrel dogs, weighing 15–30 kg, were anesthetized with 30 mg/kg sodium pentobarbital I.V., plus additional amounts as needed. The heart was exposed through a median sternotomy (13 dogs) or a left thoracotomy (5 dogs) and suspended in a pericardial cradle. An additional 4 hearts were rapidly excised and perfused with blood from a support dog in a modified Langendorff procedure as described previously (17) and suspended in a warm chamber at 37 C°.
Epicardial mapping
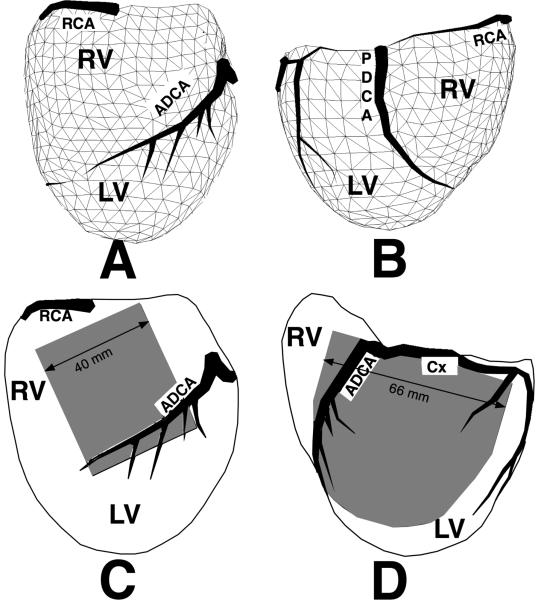
For epicardial mapping, flexible electrode arrays were applied to the ventricular surface. These arrays were constructed by attaching silver wires (0.003 in.), fully insulated except near the tip, to nylon stockings (sock arrays) or rectangular pieces of nylon cloth (grid arrays) as described previously (1, 29). The “sock” arrays were fabricated by marking 242, 490 or 630 regularly spaced points on a plaster cast of a medium size dog heart. The spatial coordinates of the points were digitized using a Microscribe® 3-D Digitizer (Immersion Corp. San Jose, CA). The foot of a nylon stocking was slipped over the cast and silver wires were attached at all the marked sites. Spacing between electrodes was ≈ 8, 5 and 4 mm respectively. Anatomical landmarks, such as the major coronary vessels, were permanently marked on the sock to provide alignment of the array when it was placed around a dog heart (Figure 1 A and B). The “grid” arrays carried 525 or 1200 wires spaced 2 mm along rows and columns of a regular grid and covered part of the ventricular surface (Figure 1C and D).
Figure 1.
A and B: Triangulated geometry of a sock electrode array containing 490 electrode sites covering both ventricles, anterior and posterior views respectively. C: A 21 by 25 uniform electrode array (2 mm interelectrode spacing) on the right ventricle. D: a 1200 electrode array (2 mm uniform spacing) on the lateral left ventricle. RCA= right coronary artery, ADCA= anterior descending coronary artery, PDCA= posterior descending coronary artery, Cx = circumflex branch of the left coronary, RV= right ventricle, LV= left ventricle
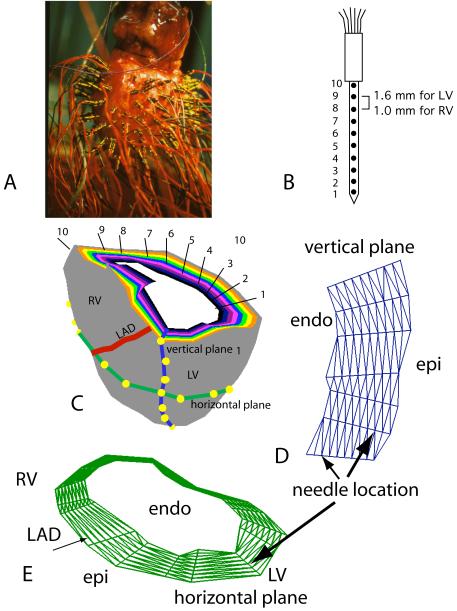
Up to 17 intramural needles, carrying 10 electrodes along each shank (20), were inserted into the ventricular walls for intramural pacing ( Figure 2 B). A total of 473 beats were investigated from 17 hearts stimulated from various sites throughout the myocardial volume. In three experiments we inactivated the Purkinje system in the right or left ventricle by perfusing its cavity with 70% Lugol solution for 30 sec. These experiments were performed in exposed hearts in situ as previously described (19).
Figure 2.
A: Isolated heart with transmural needle electrodes inserted in the left and right ventricular free walls. B: Diagram of a transmural needle electrode with 10 electrode sites along the shank, marked 1 through 10. C: Diagrammatic representation of 10 concentric ventricular surfaces constructed by triangulating all electrode sites with the same electrode numbers from needles distributed in both ventricular free walls. The interventricular septum is not represented. A transmural section close to the base of the ventricles shows, in different colors, the basal edges of 10 intramural surfaces parallel to the epicardium. The 10 surfaces pass through electrodes 10 (epicardial, gray) through 1 (endocardial, white) of each needle. D: Geometry mesh of a transmural plane generated by triangulating the electrode sites from needles inserted along a vertical line in the heart. E: Geometry mesh of a horizontal plane generated by triangulating electrode sites from needles inserted in a horizontal line around both ventricles. LV – left ventricle, RV – right ventricle, LAD – left anterior descending coronary artery.
Intramural Mapping
With a view to documenting the relationships between epicardial and intramural activation, we performed 5 experiments in which we inserted between 74 and 154 needles into the left and/or right ventricular walls of isolated dog hearts, prepared as described above (Figure 2). In one experiment we inserted 56 needles in the free wall of the left ventricle of an exposed dog heart after applying a 242-electrode sock on its surface. Each needle carried 10 electrodes along the shank, spaced 1.6 mm apart on the LV and 1.0 mm apart on the RV. In two of these experiments we recorded electrical signals from the needles before and after perfusing the left ventricular cavity with Lugol solution. In these experiments we did not insert needles in the internal portions of the septum.
Pacing Protocol
The right atrium was paced with a bipolar hook at a rate just above the spontaneous sinus rate. Ventricular stimulation was achieved by delivering unipolar cathodal stimuli to the ventricles via any electrode on the flexible epicardial array or with unipolar or bipolar stimuli delivered through intramural needle electrodes. The indifferent electrode for unipolar stimulation was placed subcutaneously in the chest cavity for in situ studies and at the aortic root for isolated hearts. Stimuli were 2 ms in duration, and their intensity was just above threshold. Pacing cycle lengths ranged from 330 to 430 milliseconds. Simultaneous stimulation of the ventricle and the right atrium was performed to prevent ventricular captures from the atria.
Data acquisition, analysis and display
Potential differences between groups of 192, 256 or 490 electrodes and a common reference electrode placed on the left hind leg for in situ experiments or on the aortic root of isolated hearts were simultaneously amplified, sampled at 1000 Hz per channel, digitized with a linear 12 bit A/D converter and stored on a MicroVax® or Macintosh® computer. These operations were repeated when necessary until signals were collected from all electrode sites (up to 1540). Signals from successive groups were time aligned and merged into a single data set. Unipolar electrograms of poor quality or low signal-to-noise ratio were eliminated from the data set. In addition, unipolar signals from needle electrodes with a QRS down-stroke with a substantially smaller modulus of the derivative than the other signals from the same needle, suggesting they were located at the tip of the needle and recording from within the ventricular cavity or outside the epicardium were not included for analysis.
Excitation times were estimated as the time of maximum negative slope of the unipolar electrogram (24, 27). Excitation time and isopotential maps were graphically displayed as sets of linearly interpolated contour lines (http://www.sci.utah.edu/map3d) (18). In potential maps, the position of the excitation wave front was taken as the location of the dense “band” of equiptential lines associated with the high potential gradient. For data relating to the entire epicardial surface, as explored by the 242- 490- or 630-electrode sock, excitation isochrones were displayed on planar, orthogonal projections of rotatable 3D images. For intramural data, excitation isochrones and potential distributions were displayed on 10 surfaces parallel to the epicardium (Figure 2C). The epicardial surface was generated by triangulating all of the electrode sites from the outermost electrode on each needle (marked #10 in Figure 2B). Likewise, 10 parallel surfaces were constructed (Figure 2C). Isochrone lines and potential contours were also mapped on transmural, horizontal (parallel to the AV groove) (Figure 2E), and vertical (apico-basal) (Figure 2D) sections.
Average estimates of conduction speeds were determined from 2-mm resolution epicardial maps by measuring the distance (mm) between electrodes located along a line perpendicular to isochronal lines and dividing it by the difference in activation time (ms). Epicardial propagation velocity vectors and their magnitude were estimated over very short distances using the computational technique described by Bayly et al. (3). Attempting to estimate propagation speed using activation times determined only on the surface of the heart presents limitations because the wave front(s) propagate(s) within the myocardial volume. Excitation coming from the depth may reach the epicardium at one or more sites and then propagate in all directions until it encounters an anatomical boundary or another wave front. If the interelectrode distance in the array is greater than 2 mm one or more epicardial breakthrough sites may be missed (1). Thus, in the areas where there are multiple wave fronts, estimating epicardial speed by dividing the normal distance between two successive isochrone lines by the time interval between them will yield inaccurate results, even falsely estimating an infinite local speed. Moreover, the angle with which an excitation wave coming from the depth reaches the epicardium will affect the estimated speed as determined on the surface. If an excitation wave reaches the surface parallel to the epicardium, the epicardial velocity may appear to be infinite. Finally, the curvature of a wave approaching the epicardium from the depth so that it hits the boundary at a 90° angle (6) will also affect the propagation speed as estimated on the surface. Because of these complex effects, we acknowledge that when we assess the epicardial propagation speed by either method the results are only the “apparent speed” as seen on the surface.
Fiber direction near the pacing site was deduced, for all pacing depths, from the direction of the axis connecting the two potential maxima in epicardial potential maps, at 5 – 10 ms after the stimulus. This method has been shown to be at least as accurate as histological studies in previous experiments (12, 25, 31) and computer simulations (7, 21). Limitations of this method include assessing the fiber direction too long after stimulation so that encountered fiber rotation begins to modify the orientation of the maxima or poor quality of the signals masking the true center of the maxima.
RESULTS
Epicardial Pacing
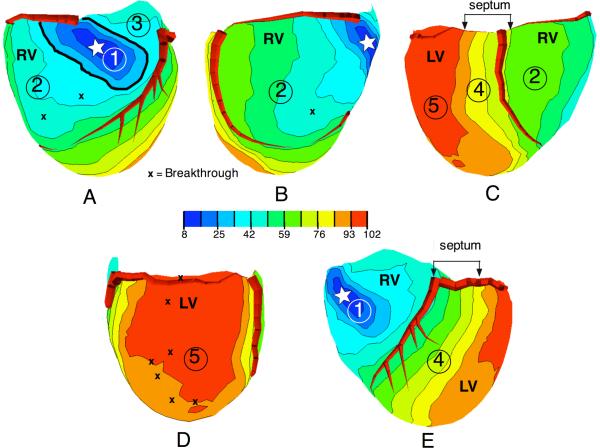
Epicardial excitation time maps, depicting the sequence of excitation over the entire ventricular surface after epicardial ventricular stimulation, showed 3 distinct patterns of propagation, which were consistently observed for 243 epicardial pacing sites in 17 dogs. Figure 3 illustrates a typical example of these patterns on planar orthogonal projections of three-dimensional isochronal epicardial maps recorded with a 490-lead sock during right ventricular pacing. The images in Figure 3 were obtained with the 490-electrode sock shown in Figure 1A and 1B, with an average interelectrode distance of ≈ 4–5 mm.
Figure 3.
Activation time maps from a 490 electrode “sock” array, with right ventricular pacing (white star indicates the pacing location). Panels A through E show views that are progressively rotated from left to right with 5 regions of propagation marked (see text).
Pattern 1 – “Primary Area”
The first propagation pattern was found in the region surrounding the pacing site, previously referred to as the “primary area” (2, 32). This region showed a family of elongated, concentric, quasi-elliptical isochrones. In the primary area, the major axis of the earliest ellipses was approximately parallel to the direction of the local subepicardial fibers and the minor axis was perpendicular to fiber direction. The primary area of conduction is shown in Figure 3A, where it is marked with the number 1 and enclosed by an accentuated isochronal line. Average velocities along fibers were 0.63 ± 0.10 m/s (longitudinal velocity) and 0.27 ± 0.05 m/s (n = 15 pacing sites) across fibers (transverse velocity). These values were obtained with grid arrays with 2 mm resolution from the RV and LV epicardium and are close to the published values of 0.6 m/s and 0.3 m/s, respectively (25).
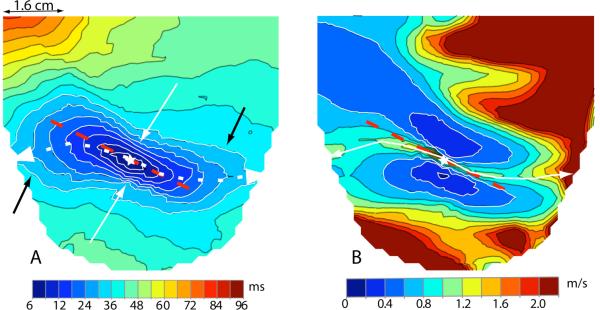
A characteristic feature of the primary area was a consistent deformation of the 20–30 ms isochrones from the symmetrical, quasi-elliptical shape of the early isochrones (10–20 ms) into an asymmetrical configuration with two “bulges”. A typical example is shown in Figure 4A, which was obtained with a spatial resolution of 2 mm. The figure demonstrates the outward, counterclockwise (CCW) stretching of the isochrones at 18–36 ms (black arrows). For an observer looking at the heart from the outside, the two bulges were located in the upper (basal) left and lower (apical) right quadrants of the isochronal pattern centered at the pacing site with axes along and across the major axis of the ellipse.
Figure 4.
A: Activation time map from 1200 electrode grid with left ventricular pacing (star indicates pacing site). Dashed red line indicates direction of epicardial fibers near the pacing site. Curved, dashed white line indicates the crest of magnitude of the velocity seen in panel B. White arrows point to “dimples”, black arrows point to “bulges”. B: Magnitude of velocity as computed from the excitation time distribution in panel A. Dashed red line indicates direction of epicardial fibers near the pacing site. Curved white line indicates crest of magnitude of the velocity in the primary area.
Two “dimples” in the contours (white arrows) marked the passage from a bulging quadrant to a non-bulging quadrant of the isochrones. The bulges resulted from a CCW acceleration of the wave front motion in the corresponding quadrants. The acceleration was documented and quantified by epicardial speed maps, which we constructed for 7 epicardial pacing sites in 3 dogs. Figure 4B shows a typical distribution of epicardial propagation speeds on the left ventricular surface during epicardial pacing from the site marked with a star. Two blue areas of relatively slow speed are located on both sides of the pacing site. These areas are asymmetrically elongated, with the right one expanding upward, the left one downward. The figure shows that the highest speeds in the primary area were not found along a straight line parallel to epicardial fiber direction and passing through the pacing site (the red dashed line in Figure 4A and 4B), but along a line shaped like an inverted “S” (white dashed line in Figure 4A and continuous line in Figure 4B) that was slightly shifted CCW relative to the fiber direction. The epicardial bulges were observed in both ventricles in the upper left and lower right quadrants of the primary area in all cases studied, irrespective of the location of the pacing site, and persisted after inactivation of the conduction system in the relevant ventricle (not shown).
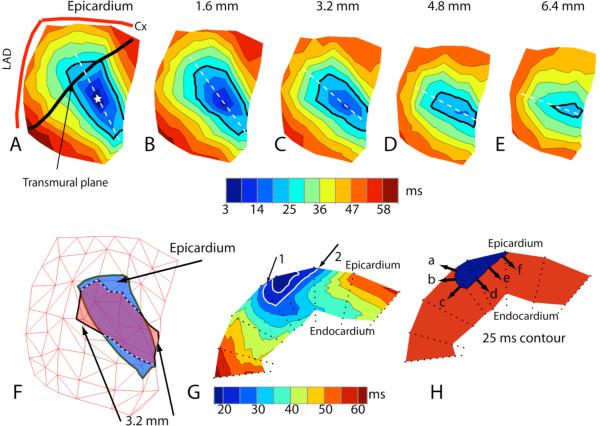
The helical CCW twist of the intramural wave front at 25 ms after the stimulus is demonstrated in Figure 5 panels A–E, where the isochrones over intramural surfaces parallel to the epicardium at 1.6, 3.2, 4.8 and 6.4 mm depth are shown and the 25 ms isochrone is accentuated with a heavy black line. Figure 5F shows that part of the 25 ms isochrone at 3.2 mm depth, protrudes beyond the same isochrone on the epicardial surface. This enables excitation to spread in an endo-epicardial direction in that region. This is better visualized in Figure 5, panel G, which shows the same isochrone (black arrows 1 and 2) in a transmural plane that intersects the epicardium along the black line shown in panel A. The plane does not pass through the epicardial pacing site (indicated by the star) but intersects the left bulge. Panel H shows that the wave front at 25 ms moves toward the epicardium in its left upper portion (arrows a and b) whereas it moves toward the endocardium in the remaining parts. In panel G, the left portion of the wave front associated with the 25 ms isochrone (noted by arrow #1) intersects the epicardium at an acute angle in the direction of propagation. The right intersection of the wave front with the epicardium (noted by arrow #2) forms an obtuse angle in the direction of propagation. This indicates that in the left (bulging) area the normal velocity of the wave front has a component directed toward the epicardium, that is, the wave front is moving toward the epicardium (arrow a, panel H), while in the opposite region, where there is no bulge, the wave front has a component moving in an endocardial direction (arrows d,e, and f, panel H). This epicardial and, respectively, endocardial direction of the wave front has been invariably detected in 14 cases of epicardial pacing in the RV and LV of 4 dogs.
Figure 5.
A: Epicardial isochronal map from 55 needle electrodes following epicardial stimulation (star indicates pacing location). Heavy black line indicates the location of the transmural plane shown in panel G. The 25 ms isochrone is accentuated in black. B–E: Isochronal maps of surfaces parallel to the epicardium at increasing depths indicated at the top of each map. The 25 ms isochrone is accentuated. F: Epicardial 25 ms isochrone (blue) overlaid with 3.2 mm deep 25 ms isochrone (red). G: Isochronal map of transmural plane marked in panel A. Arrows indicate the intersection of the 25 ms isochrone with the epicardium (see text). H: Same plane as in panel G with only the 25 ms isochrone. Black arrows indicate direction of propagation (see text).
The boundary of the primary area was marked by the transition from regular, quasi-elliptical isochrones to a region of distorted, widely spaced isochronal lines indicating high propagation velocities and with several breakthrough (BKT) sites, where excitation, coming from the depth, reached the epicardium earlier than at all surrounding sites. In Figure 3A the transition occurred near the 33.5 ms isochrone (thick line), which is quasi-elliptical in shape, whereas the next contour at 42 ms has lost this regular shape. To estimate the size of the primary area, we assumed that the electrodes were equally spaced on the 490-electrode sock array; hence each electrode represented a fixed area. We then estimated the size of the area by counting the number of electrodes contained within the isochrone that marked the abrupt passage to the high velocity areas (like the isochrone highlighted with a thick line in Figure 3 A). Expressed as a percentage of the total number of epicardial electrodes, the primary area was generally larger on the LV (14 ± 6 %) than on the RV (8 ± 3 %, p < 0.001, n = 49). The total time of activation for the primary area was shorter on the RV (31 ± 7 ms) than on the LV (48 ± 9 ms, n = 112, p < 0.0001).
Pattern 2 – High propagation velocities
The second pattern of propagation was distinguished by higher apparent propagation speeds (up to 2–3 m/s), an irregular shape of the isochrone lines and by the presence of BKT sites. It must be pointed out that the number of BKT sites observable in Figure 3 is smaller than the real number because many BKTs are missed when the distance between electrodes is more than 2 mm (1). This pattern of propagation was encountered by moving farther than 1 or 1.5 cm in either of the across fibers directions from the pacing site (see example in Figure 3A and 3E) and occurred on at least one side of the pacing site, for all epicardial pacing sites.
This pattern was observed over the epicardium of the paced ventricle outside the primary area and also on the opposite ventricle (see areas marked 2, 3, and 5 in Figure 3). An example of this pattern of high propagation velocity with breakthrough sites found on the epicardium of the non-paced ventricle, which was also the latest region reached by the excitatory process, is shown in figure 3D (area labeled #5). For the RV-paced beat in Figure 3D most of the left ventricular surface was excited in only 9 ms. This area with high velocities did not appear if the Purkinje network of the non-paced ventricle had been previously inactivated (not shown).
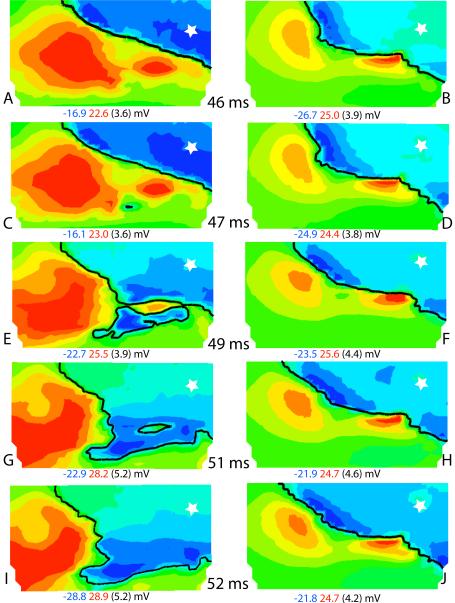
To assess if the high apparent velocity was attributable to the involvement of the conduction system, (specific aim 2) we mapped the epicardial potential distributions during ventricular activation using an electrode array with 2 mm interelectrode distances before and after Purkinje inactivation. Representative isopotential maps measured from epicardial stimulation of the right ventricle are shown in Figure 6. At 46 ms after stimulation, the wave front (black line) had moved from the pacing site (marked with a star) to the position shown in Figure 6A. Panel B shows the position of the wave front at 46 ms after pacing, but after Purkinje inactivation. Differences in the location of the wave front between panels A and B are due to the fact that the position of the epicardial sock moved slightly during the Lugol perfusion. One ms later, a distinct, small excited area of BKT appeared at ≈ 16 mm from the main wave front (Figure 6C, arrow). This and the subsequent BKT areas did not appear after Purkinje inactivation (Figure 6D). During the following instants, the new excited BKT area expanded in all directions, including toward the advancing main wave front, and the two wave fronts finally merged at 50–51 ms. In the meantime, additional breakthrough sites appeared in the surrounding regions (Figure 6 E, arrows). During the same time interval (46 to 51 ms), the main wave front barely moved in the maps obtained after Lugol (Figure 6B, D, F, H and J), thus demonstrating the marked effects of the RV Purkinje system on breakthrough sites.
Figure 6.
Isopotential maps relating to part of the 1200-electrode array at times indicated in the center column after the pacing stimulus (indicated by a star). Left column shows maps before inactivation of the Purkinje system and the right column shows maps after inactivation. The black isochronal line is drawn at the times indicated. The maximum (red) and minimum (blue) potential values and the step between isopotential lines (in parentheses) are indicated under each map. Arrows in panels C and E indicate breakthrough sites.
Intramural excitation during the transition to the high-speed propagation pattern. To establish the relationships between epicardial and intramural propagation in the transition between the primary and high-speed regions, and the role of the conduction system in determining the sequence of activation in those regions, we inserted 73 needle electrodes into the left ventricular wall of an isolated heart and recorded the intramural activity during ventricular pacing at various intramural depths, before and after perfusing the left ventricular cavity with Lugol solution.
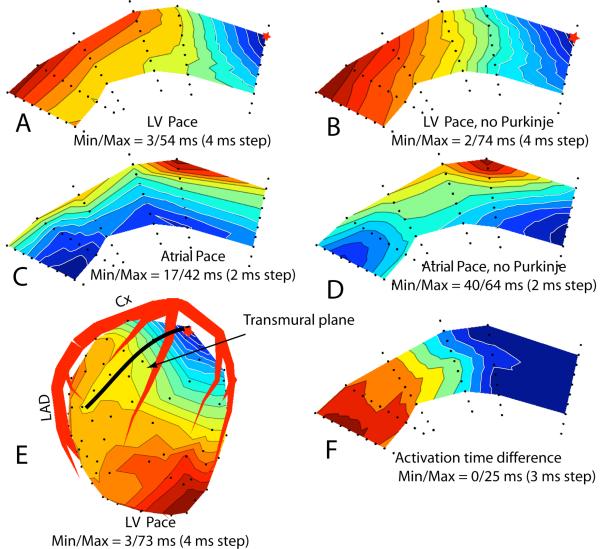
Figure 7A shows the sequence of activation before Lugol perfusion in a LV transmural plane that intersects the epicardium along the thick black line shown in Figure 7E. A red star marks the epicardial stimulation site. Excitation spread from epicardium to endocardium, underwent a fast acceleration along the deep and subendocardial layers and returned to the epicardium in the left portion of the section.
Figure 7.
Activation time maps from needles electrodes inserted in the LV, blue is early and red is late activation times. Red star indicates pacing site. A: Transmural plane intersecting the LV epicardium along black line indicated in panel E. Pacing site is indicated by red star. B: Same map as shown in panel A after inactivation of the Purkinje conduction system in the left ventricle. C: Isochronal map of the same transmural plane as panel A during atrial stimulation. D: Same plane as panel C after inactivation of the Purkinje conduction system. E: Epicardial isochronal map where heavy black line indicates the location of the transmural plane. F: Activation time difference map between the maps in panel B and A.
Figure 7B shows the same transmural section after inactivation of the Purkinje system in the left ventricle. The fast subendocardial acceleration was no longer present, but some moderate acceleration in the deeper and subendocardial layers still occurred and the excitation wave still returned from the endocardium to the epicardium in the left portion of the section (panel B). Before Purkinje inactivation, excitation of the entire plane took 54 ms, after inactivation it took 74 ms. Figures 7C and 7D show the sequence of activation in the same plane following atrial stimulation before and after inactivation of the LV Purkinje system, respectively.
The earliest areas of activation in Figure 7C (atrial drive) are close to the endocardium, appear at 17 ms after QRS onset, and most likely indicate early, Purkinje initiated, activation sites. After Purkinje inactivation the earliest excitation areas appear at 40 ms after QRS onset, in a different location (panel D). Panel F shows the activation time difference between Panels B (no Purkinje) and A (with Purkinje). All the values in Panel F are positive and increase from right to left. This showed that in the Purkinje-activated heart, excitation reached all sites in the transmural plane earlier than in the Purkinje inactivated heart, except in the area near the pacing site (primary area) where the differences are close to zero.
Pattern 3 – slowing across the septum
The third distinct pattern of propagation was found over the epicardial projection of the septum (Figures 3C and 3E, areas labeled with #4). This area was marked by isochronal lines that became more densely spaced as the wave front passed from one ventricle to the other on both the anterior (Figure 3E) and posterior (Figure 3C) epicardial projections of the septum. Average surface speeds of propagation across these regions were 0.7 ± 0.2 m/s (n = 42).
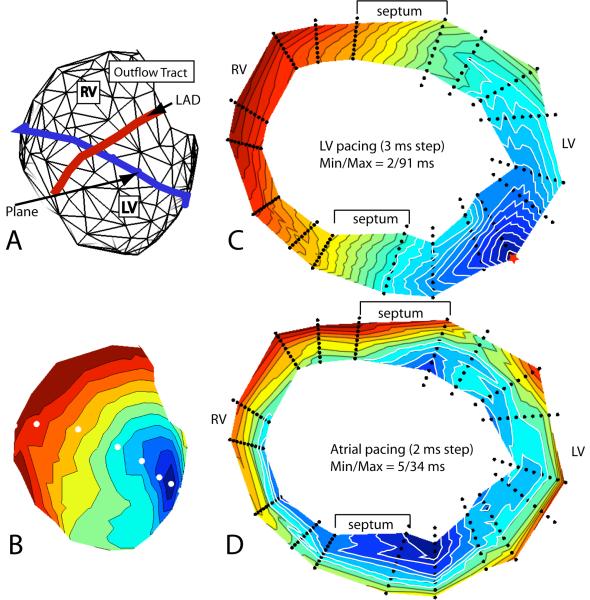
Figure 8C shows activation isochrones in a transmural cross-section of the heart during LV pacing (site marked with a red star). The internal portions of the interventricular septum are not represented because no needles were inserted there. The figure shows that the slowing of epicardial propagation where the wave front crossed the septum during ventricular pacing was the epicardial expression of an intramural, advancing wave front that was approximately perpendicular to the heart surface in the anterior crossing region, or at approximately 45° in the posterior crossing region, whereas it was more parallel to the epicardium in the remaining regions, except near the pacing site, where the propagation speed was also relatively low. This configuration of the wave front where it crossed the septum was observed for all pacing depths, whether pacing was initiated from the LV or the RV. The slower propagation across the septum was not observed during atrial drive. Figure 8D shows the distribution of excitation isochrones in the same section, but during atrial pacing. It demonstrates the presence of two subendocardial sites that become excited very early, at 5 ms from the onset of ventricular activation (arrows). The two early sites most probably reveal the presence of 2 PVJs, which are located near the junction of the left ventricular wall with the septum. Excitation spreading from these PVJs during atrial drive gave rise to two endo-epicardial waves that reached the septal epicardium at a narrow angle (posterior septum) or were quasi-parallel to the epicardium (anterior septum). Therefore, the apparent propagation speed at the epicardium was very high. In Figure 8 C (paced beat) excitation coming from the pacing site did not seem to reach these PVJs, but moved across the septum without Purkinje involvement.
Figure 8.
A) Geometry mesh of the needle locations on the surface of the heart. The blue line indicates the needle locations used to create the transmural plane in panels C and D. B) Isochronal map of the epicardial surface showing the individual needle locations (white dots) that make up the horizontal plane in panels C and D. C) Isochronal map of the sequence of excitation following left ventricular epicardial stimulation (red star) in the horizontal plane. D) Isochronal map in the same plane as panel C during atrial stimulation. Arrows indicate the early activation on the endocardium.
Intramural and Subendocardial Pacing; effects of epi-endocardial obliqueness of fibers
The three patterns of propagation were also observed in epicardial excitation time maps relating to intramural pacing. However, the boundary separating the primary area from areas of high propagation velocity became less clear-cut for deeper pacing. Areas showing relatively slow propagation across the septum and very fast propagation over the opposite ventricle were clearly present for all pacing depths.
Five differences were observed between epicardial primary areas produced by epicardial and deep pacing:
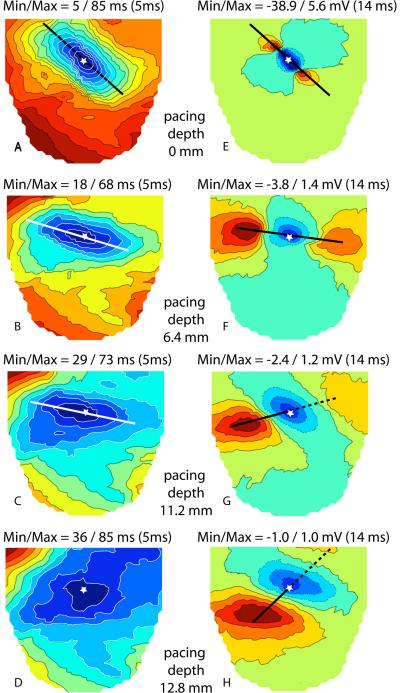
1) The major axis of the central elliptical isochrones was no longer parallel to the direction of epicardial fibers but progressively rotated counterclockwise with increasing pacing depth on both the RV and the LV. Figure 9, panels A–D, shows an example of this for pacing of the LV. The rotation of the epicardial isochrones was always significantly less than the rotation of the fibers near the increasingly deep pacing sites, as previously reported for the pulmonary conus (12). In our experiments, fiber direction near the pacing site was assessed from a straight line drawn through the positions of the two initial epicardial potential maxima produced by pacing at any intramural depth (Figure 9, panels E–H). For potential patterns where only a single potential maximum was visible on the epicardial area, a line connecting the site of insertion of the needle with the potential maximum indicates the fiber direction at the relevant pacing depth. At pacing depths 8 to 11 mm, the rotation of the isochrones was 50% of the rotation of fibers (32° ± 9° versus 64 ° ± 15°). Figure 9C shows an example for pacing at 11.2 mm deep where the line through the long axis of the earliest elliptical isochrone has rotated 29° CCW as compared to the earliest line in panel A. The line indicating fiber direction in panel G has rotated 59° relative to panel E. For more superficial pacing (3 to 6 mm) isochrone rotation was ~ 60% of fiber rotation. The amount of rotation could not be assessed for subendocardial pacing (Figure 9D) as the elliptical shape of the earliest isochrone was no longer observable and there was no clear-cut major axis.
Figure 9.
A through D: activation time maps (left ventricular surface) for increasing pacing depths. Heavy straight lines indicate the long axis of the early isochrones and stars indicate the site of insertion of the pacing needle. E through H: Epicardial potential distributions at 14 ms after the stimulus, for increasing pacing depths. Blue and red shades indicate positive and negative potential values, respectively. Stars indicate the site of insertion of the pacing needle in the LV. Heavy lines connecting the potential maxima indicate the fiber direction at the relevant pacing depth.
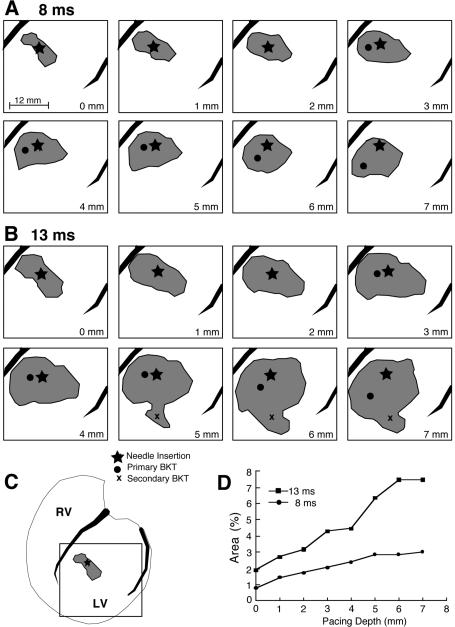
2) With increasing pacing depth, the epicardial isochrone lines were more sparsely distributed, indicating that the average propagation velocity on the epicardium increased as a function of pacing depth (Figure 9 B – D). As a consequence of the faster velocity, epicardial areas covered by the excitation wave in a fixed amount of time after earliest epicardial activation progressively increased as a function of pacing depth. For example at 8 ms after earliest epicardial activation (Figure 10A), the amount of excited surface area increased from less than 1% for epicardial pacing to 3% for pacing at a depth of 7 mm (Figure 10 D) of the total ventricular surface area, as measured by a 630-electrode sock array. The same figure shows that with increasing pacing depth the isochrone at 8 ms after earliest epicardial activation became more round than elliptical, that is, the ratio of the major to minor axis of the ellipses decreased. Maps depicting the areas at later times e.g., 13 ms after earliest epicardial activation (Figure 10 B) exhibited a similar behavior and, in addition, often showed one or more secondary BKTs (Figure 10 B, 5–7 mm indicated by an x). The appearance of BKTs contributed to a further increase of the surface area excited by deep pacing at a fixed time after the earliest epicardial activation (up to 7.5 % in Figure 10 D).
Figure 10.
A: area of excited epicardial tissue at 8 ms after primary BKT, for increasing pacing depths as indicated in lower right corner of each panel. B: same as A for 13 ms after primary BKT. C: location of pacing needle relative to entire ventricular surface covered by the 630-electrode sock array. The square indicates mapped regions shown in panels A and B. D: graph showing the amount of excited area expressed as a percentage of total epicardial area at 8 and 13 ms. Star = needle insertion site, filled circle = primary BKT, x = secondary BKT
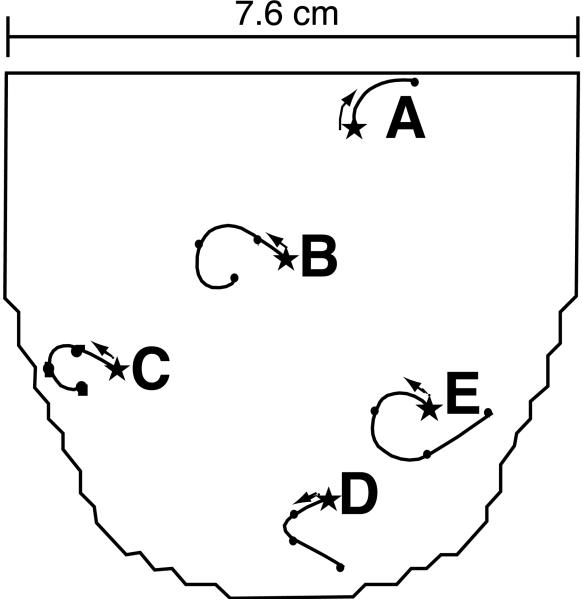
3) For pacing sites deeper than 3 mm, the location of the earliest (primary) BKT did not coincide with the site of insertion of the pacing needle, but progressively migrated away from it (Figure 10 A and 10 B). Figure 11 shows the migration pathways of the primary BKT site for 5 needle locations in a single heart as measured with a 2 mm resolution electrode grid. The star indicates the site of insertion of the pacing needle.
Figure 11.
Diagram of 1200 lead electrode array placed on the LV as shown in Figure 1 D. Five pacing needle locations are labeled A through E. Curved lines indicate the migration of the primary breakthrough from the site of insertion of the pacing needles (stars) for increased pacing depths. Note that location A, near the base of the heart, shows rotation and migration in opposite direction compared to the other pacing locations.
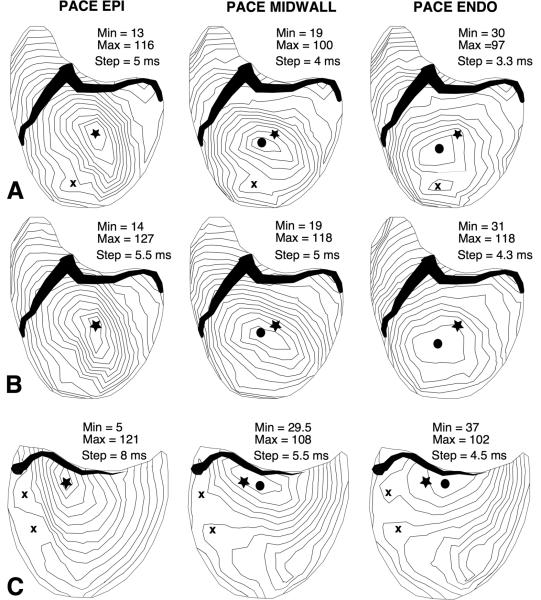
A consistent feature of these migration pathways of the BKT was that they depended on the site of insertion of the needle. When the needle was inserted in the lower (apical) 75% of the ventricular surface, the path of the BKT generally followed a CCW motion, to the left of the observer and toward the apex, with increasing pacing depth (Figures 11 B–E and 12 A). When inserted in the upper 25% (basal portion), the motion was generally to the right and often upward (Figures 11 A and 12 C). This migration to the right was observed on both ventricles. Migration of the BKT, whether to the left or right, persisted after inactivation of the Purkinje network (see example in Figure 12 B).
Figure 12.
Activation time maps for epicardial, midwall and endocardial LV pacing, showing that the site of earliest excitation moves away from the pacing needle location (star) as pacing depth increases. A: Normal heart. B: same heart and pacing needle insertion site as in panel A, after inactivation of the Purkinje conduction system in the left ventricle. C: normal heart, pacing needle location near the AV border. Closed circle = primary BKT, x = secondary BKTs.
Figure 13 relates to an experiment where we inserted 55 needles into a portion of the left ventricular wall of an exposed dog heart. In that experiment, we also applied a 242-electrode sock (Figure 13 C). In Panel A (needle data) the thick black line shows the intersection of a transmural plane with the LV epicardium. Figure 13 B shows the spread of excitation, elicited by endocardial stimulation, through the transmural plane. The activation sequence in the transmural plane (Figure 13 B) indicates that the main direction of propagation was oblique to the epicardial surface with the BKT site located to the left of the pacing needle. In the potential map (Figure 13 D) the line joining the two potential maxima just after stimulation was also oblique to the epicardial surface. These figures indicate that there is a preferential propagation direction that is not parallel to the ventricular surface.
Figure 13.
A) Epicardial isochronal map recorded from the outermost electrodes from 55 needles (black dots) following subendocardial stimulation. Black line indicates the epicardial intersection of the transmural plane depicted in panels B and D. B) Isochronal map after same subendocardial stimulation (white star). C) Isochronal map recorded from 242 sock electrodes on the epicardial surface. White star indicates site of insertion of needle used for subendocardial stimulation. Here again, heavy black line indicates transmural plane in panels B and D. D) Isopotential map recorded during the same subendocardial stimulation. Dashed lines indicate negative potentials and solid lines are positive potentials.
4) The time of arrival of excitation from an intramural pacing site to the epicardial site of insertion of the needle (measured from the stimulus artifact) increased as a function of pacing depth, and the average transmural velocity of propagation along the needle was estimated to be 0.36 m/sec ± 0.09 (n=58). The time of arrival of the earliest excitation to the epicardium, site of primary BKT, was shorter than the time of arrival of excitation to the site of needle insertion. In the left ventricle the time of arrival at the epicardium for the primary BKT was only 27 ± 6 ms, whereas it averaged 30 ± 6 ms for the needle insertion site (n=44). Corresponding values for the RV were 17 ± 6 ms versus 20 ± 5 ms, (n = 9). The 3 ms mean differences were small but significant (paired t-test, p < 0.0001). These values were measured using electrode arrays with 2 mm resolution.
5) For deep pacing, the early isochrone lines on the epicardium were no longer centered about the site of insertion of the pacing needle, as invariably occurred for epicardial pacing, but became progressively shifted, so that the site of insertion often was located outside of the earliest epicardial isochrone lines. Figure 12 A shows the shift of the center of the concentric elliptical isochrones, away from the site of insertion of the pacing needle, for midwall and endocardial LV pacing. This feature was observed on both ventricles even after inactivation of the Purkinje network (see example in Figure 12 B). The shift of the isochrones was consistent with the shift of the BKT, in the sense that it occurred to the left (of the observer) and toward the apex when the pacing site was in the lower hemisphere, to the right (and toward the base) when we paced in the upper 25% of the ventricular mass (Figure 12 C). Features described in points 3) through 5) are predictable effects of the epi-endocardial obliqueness of the fibers.
DISCUSSION
The purpose of this study was to describe the different epicardial patterns of excitation elicited by ventricular pacing, and to interpret those patterns in terms of intramural electrical events and myocardial architecture.
Epicardial pacing
Primary area
It has been well demonstrated that the elliptical shape of the concentric isochrone lines surrounding an epicardial pacing site is an expression of the anisotropic conduction velocity of the heart muscle (4, 5, 12). The asymmetrical bulges that appear in the elliptical isochrone contour maps (Figure 4 A) have been predicted by computer simulations (8, 16). Our results provide experimental confirmation of their origin and show that they coincide with relatively higher propagation speed in the relevant quadrants. The higher speed can be attributed to the epi-endocardial CCW rotation of fiber direction in the ventricular walls (28). The intramural wave front elicited by epicardial pacing assumes a helical shape in the thickness of the wall. This brings about a CCW rotation of the intersections between the 3-D helical wave front and the successive surfaces, parallel to the epicardium (Figure 5). One consequence of the CCW rotation of the wave front profiles at increasing depths is that some portions of the deep wave front overtake the epicardial wave front, in the regions where epicardial excitation spreads slowly across fibers. As a consequence, in these deep regions some protruding portions of the wave front can expand upwards, toward the epicardium while the remaining portions expand toward the endocardium. The results indicate that the intersection of the wave front with the epicardium in the area of the bulge forms an acute angle, in the direction of propagation (see example in Figure 5G arrow #1), whereas the right intersection of the same wave front with the epicardium (see example in Figure 5F arrow #2), will form an obtuse angle. In theory, both angles would result in the apparent epicardial speed of propagation being higher than the normal (perpendicular to the wave front), intramural velocity. However, Colli Franzone et al. demonstrated that the wave fronts must hit the boundary, in this case the epicardium, at a right angle (6). Thus, in the immediate vicinity of the ventricular surface, the left portion of the wave front will abruptly bend toward the epicardium. This will result in a highly positive curvature, entailing a higher speed, compared with a planar wave front (11). This relatively higher speed brings about the formation of epicardial bulges in the relevant quadrant.
Conversely, the obtuse intersection of the wave front with the epicardium acquires a negative curvature, giving rise to a slower speed, compared with a planar wave. This correlates with the absence of a bulge in the upper right epicardial quadrant, and a relatively shorter distance between successive isochrones on the epicardium. Thus, the presence of a subepicardial portion of the 3-D wave front, which is shifted CCW, relative to its epicardial intersection, accelerates the leftward expansion of the epicardial isochrone (bulge) and delays the right expansion (no bulge) (specific aim 1).
Boundary of primary area
In agreement with the hypothesis published by Arisi et al in 1992, our results show that in the “high velocity” areas, multiple excitation wave fronts come from subendocardial Purkinje-ventricular junctions (PVJ), because the high velocity areas and the multiple breakthrough sites disappear after Purkinje inactivation (specific aim 2). Thus, the boundary between pattern 1 of propagation (quasi-elliptical isochrones) and pattern 2 (high velocity) is the line along which an excitation wave front spreading directly from the pacing site encounters a wave front coming from one or more PVJs. However, this transition does not occur simultaneously along a specific isochrone line. For example, in the regions where excitation advances along fibers, the transition may occur later than across fibers. In this study we defined the boundary of the epicardial primary area as the isochrone line that first encounters a wave front coming from an epicardial breakthrough site, because, after that time instant, the excited area becomes a combination of regions activated directly by a wave coming from the pacing site and other regions activated through the conduction system. Thus, it can no longer be defined “primary area”.
The intramural events during the transition from the primary to “secondary” or “high speed”) regions showed that the marked subepicardial acceleration (with apparent speed reaching up to 3 m/s) disappears after Purkinje inactivation. The highest speed values are observed in regions where one or more PVJs are located. The map showing the time differences between excitation times before and after Purkinje inactivation (Figure 7 F) shows that, after Purkinje inactivation, excitation advancing through working myocardium reaches the entire section (except the primary area) later than propagation with Purkinje involvement. Thus, before Purkinje inactivation, the entire section, except the primary area, is activated by Purkinje-initiated excitation waves (specific aim 2).
Slowing across the septum
The results confirm our hypothesis that the slower propagation in the epicardial areas where the wave front crosses the epicardial projection of the septum is associated with an intramural wave front that is perpendicular to the epicardium, or moderately tilted, whereas it is rather parallel to the surface in most of the remaining regions (specific aim 3). We are not aware of any published mathematical simulation that reproduces this feature. The results suggest this difference is due to Purkinje involvement near the septal wall during normal activation sequences, whereas the PVJ near the septum are not activated during a paced beat, as shown in Figure 8C.
Intramural pacing: Effects of epi-endocardial obliqueness of fibers
Isochrone maps and equipotential contour maps traced on properly oriented transmural sections and recorded during endocardial pacing revealed the intramural epi-endocardial obliqueness of fiber direction (imbrication angle, (28)). The major axis of the elliptical isochrone lines was clearly tilted toward the epicardium in transmural planes and not parallel to the epicardial surface. Epicardial breakthrough sites were clearly shifted to the left or right relative to the site of insertion of the pacing needle depending on which hemisphere of the heart the needle was inserted. Streeter's diagrams (28) predict that in the apical “hemisphere” of the left ventricle, endocardial pacing should provoke a shift of the BKT site toward the apex and the left of the observer, whereas endocardial pacing in the upper (basal) hemisphere should result in a shift to the right. This prediction is confirmed by our experimental results. In Figure 13 D the left intramural potential maximum is closer to the epicardium than the right one and generates a stronger epicardial maximum, while the right epicardial maximum is weaker and not distinguishable from the background noise. This finding is consistent with our hypothesis that the asymmetry of the voltage of the maxima and the shift of the breakthrough sites are due to epi-endocardial obliqueness of the intramural direction of propagation (Specific aim 4).
In summary, this study provides new information on the intramural electrical events underlying the multiple patterns of excitation elicited by epicardial and intramural pacing in normal dog hearts. This study presents new results that provide an electrical propagation counterpart for the widely known purely anatomical work of Streeter (28) on normal ventricular fiber geometry. Consequently, this study shows that knowledge of the details of ventricular fiber structure are quite important for understanding the epicardial ventricular electrical events that occur following pacing at different locations throughout both ventricles and their intramural counterparts. This information has practical relevance because it is now possible to map epicardial electrical events noninvasively, in human patients and experimental animals, using electrocardiographic imaging (14, 34) or semi-invasively, using transthoracic epicardial mapping (26) in view of ventricular pacing therapy.
Acknowledgements
This research was supported by grants from the Nora Eccles Treadwell Foundation and the Richard A. and Nora Eccles Harrison Fund for Cardiovascular Research. Support for the development of the map3d software used in this study came from the NIH/NCRR Center for Integrated Biomedical Computing (CIBC), P41-RR12553. The authors wish to acknowledge Mr. Bruce Steadman for the design and development of the data acquisition hardware and Mr. Ted Dustman for his efforts in designing our data processing software. In addition we would like to acknowledge the technical expertise and support of Jayne Davis, Nancy Allen, Yonild Vyhmeister and Alicja Booth.
References
- 1.Arisi G, Macchi E, Baruffi S, Musso E, Spaggiari S, Stilli D, Taccardi B. Experimental studies on the diffusion of excitation on the right ventricular surface in the dog, during normal and stimulated beats. Boll Soc Ital Biol Sper. 1982;58:15–21. [PubMed] [Google Scholar]
- 2.Arisi G, Macchi E, Corradi C, Lux RL, Taccardi B. Epicardial excitation during ventricular pacing. Relative independence of breakthrough sites from excitation sequence in canine right ventricle. Circ Res. 1992;71:840–849. doi: 10.1161/01.res.71.4.840. [DOI] [PubMed] [Google Scholar]
- 3.Bayly PV, KenKnight BH, Rogers JM, Hillsley RE, Ideker RE, Smith WM. Estimation of conduction velocity vector fields from epicardial mapping data. IEEE Trans Biomed Eng. 1998;45:563–571. doi: 10.1109/10.668746. [DOI] [PubMed] [Google Scholar]
- 4.Burgess MJ, Steinhaus BM, Spitzer KW, Ershler PR. Nonuniform epicardial activation and repolarization properties of in vivo canine pulmonary conus. Circ Res. 1988;62:233–246. doi: 10.1161/01.res.62.2.233. [DOI] [PubMed] [Google Scholar]
- 5.Clerc L. Directional differences of impulse spread in trabecular muscle from mammalian heart. The Journal of physiology. 1976;255:335–346. doi: 10.1113/jphysiol.1976.sp011283. [DOI] [PMC free article] [PubMed] [Google Scholar]
- 6.Colli Franzone P, Guerri L, Rovida S. Wavefront propagation in an activation model of the anisotropic cardiac tissue: asymptotic analysis and numerical simulations. J Math Biol. 1990;28:121–176. doi: 10.1007/BF00163143. [DOI] [PubMed] [Google Scholar]
- 7.Colli Franzone P, Guerri L, Taccardi B. Potential distributions generated by point stimulation in a myocardial volume: simulation studies in a model of anisotropic ventricular muscle. J Cardiovasc Electrophysiol. 1993;4:438–458. doi: 10.1111/j.1540-8167.1993.tb01282.x. [DOI] [PubMed] [Google Scholar]
- 8.Colli Franzone P, Guerri L, Taccardi B. Spread of excitation in a myocardial volume: simulation studies in a model of anisotropic ventricular muscle activated by point stimulation. J Cardiovasc Electrophysiol. 1993;4:144–160. doi: 10.1111/j.1540-8167.1993.tb01219.x. [DOI] [PubMed] [Google Scholar]
- 9.Colli Franzone P, Pavarino LF, Taccardi B. Simulating patterns of excitation, repolarization and action potential duration with cardiac Bidomain and Monodomain models. Mathematical Biosciences. 2005;197:35–66. doi: 10.1016/j.mbs.2005.04.003. [DOI] [PubMed] [Google Scholar]
- 10.Council NR. Guide for the Care and Use of Laboratory Animals. National Academy Press; Washington DC: 1996. p. 125. [Google Scholar]
- 11.Fast VG, Kleber AG. Role of wavefront curvature in propagation of cardiac impulse. Cardiovasc Res. 1997;33:258–271. doi: 10.1016/s0008-6363(96)00216-7. [DOI] [PubMed] [Google Scholar]
- 12.Frazier DW, Krassowska W, Chen PS, Wolf PD, Danieley ND, Smith WM, Ideker RE. Transmural activations and stimulus potentials in three-dimensional anisotropic canine myocardium. Circ Res. 1988;63:135–146. doi: 10.1161/01.res.63.1.135. [DOI] [PubMed] [Google Scholar]
- 13.Henriquez CS, Muzikant AL, Smoak CK. Anisotropy, fiber curvature, and bath loading effects on activation in thin and thick cardiac tissue preparations: simulations in a three-dimensional bidomain model. J Cardiovasc Electrophysiol. 1996;7:424–444. doi: 10.1111/j.1540-8167.1996.tb00548.x. [DOI] [PubMed] [Google Scholar]
- 14.Jia P, Ramanathan C, Ghanem RN, Ryu K, Varma N, Rudy Y. Electrocardiographic imaging of cardiac resynchronization therapy in heart failure: observation of variable electrophysiologic responses. Heart Rhythm. 2006;3:296–310. doi: 10.1016/j.hrthm.2005.11.025. [DOI] [PMC free article] [PubMed] [Google Scholar]
- 15.Kass DA. Cardiac resynchronization therapy. J Cardiovasc Electrophysiol. 2005;16(Suppl 1):S35–41. doi: 10.1111/j.1540-8167.2005.50136.x. [DOI] [PubMed] [Google Scholar]
- 16.Keener JP. An eikonal-curvature equation for action potential propagation in myocardium. J Math Biol. 1991;29:629–651. doi: 10.1007/BF00163916. [DOI] [PubMed] [Google Scholar]
- 17.Khoury DS, Taccardi B, Lux RL, Ershler PR, Rudy Y. Reconstruction of endocardial potentials and activation sequences from intracavitary probe measurements. Localization of pacing sites and effects of myocardial structure. Circulation. 1995;91:845–863. doi: 10.1161/01.cir.91.3.845. [DOI] [PubMed] [Google Scholar]
- 18.MacLeod RS, Johnson CR. Map3d: Interactive scientific visualization for bioengineering data. IEEE Engineering in Medicine and Biology Society 15th Annual International Conference; IEEE Press; 1993. pp. 30–31. [Google Scholar]
- 19.Millar K, Burgess MJ, Abildskov JA, Eich RH. Dependence of intraventricular pressures on activation order before and after experimental purkinje net block. J Electrocardiol. 1970;3:51–56. doi: 10.1016/s0022-0736(70)80071-1. [DOI] [PubMed] [Google Scholar]
- 20.Moore KB, Kimball T, Steadman B. Silver-silver chloride plunge electrode needles and chloriding monitor. IEEE Trans Biomed Eng. 1990;37:532–535. doi: 10.1109/10.55651. [DOI] [PubMed] [Google Scholar]
- 21.Muzikant AL, Henriquez CS. Bipolar stimulation of a three-dimensional bidomain incorporating rotational anisotropy. IEEE Trans Biomed Eng. 1998;45:449–462. doi: 10.1109/10.664201. [DOI] [PubMed] [Google Scholar]
- 22.Muzikant AL, Henriquez CS. Paced activation mapping reveals organization of myocardial fibers: a simulation study. J Cardiovasc Electrophysiol. 1997;8:281–294. doi: 10.1111/j.1540-8167.1997.tb00791.x. [DOI] [PubMed] [Google Scholar]
- 23.Pollard AE, Spitzer KW, Burgess MJ. Contributions of the specialized conduction system to the activation sequence in the canine pulmonary conus. Am J Physiol. 1997;273:H446–463. doi: 10.1152/ajpheart.1997.273.1.H446. [DOI] [PubMed] [Google Scholar]
- 24.Punske BB, Ni Q, Lux RL, MacLeod RS, Ershler PR, Dustman TJ, Allison MJ, Taccardi B. Spatial methods of epicardial activation time determination in normal hearts. Annals of biomedical engineering. 2003;31:781–792. doi: 10.1114/1.1581877. [DOI] [PubMed] [Google Scholar]
- 25.Roberts DE, Hersh LT, Scher AM. Influence of cardiac fiber orientation on wavefront voltage, conduction velocity, and tissue resistivity in the dog. Circ Res. 1979;44:701–712. doi: 10.1161/01.res.44.5.701. [DOI] [PubMed] [Google Scholar]
- 26.Sosa E, Scanavacca M, D'Avila A, Antonio J, Ramires F. Nonsurgical transthoracic epicardial approach in patients with ventricular tachycardia and previous cardiac surgery. J Interv Card Electrophysiol. 2004;10:281–288. doi: 10.1023/B:JICE.0000026925.41543.7c. [DOI] [PubMed] [Google Scholar]
- 27.Spach MS, Heidlage JF, Darken ER, Hofer E, Raines KH, Starmer CF. Cellular Vmax reflects both membrane properties and the load presented by adjoining cells. Am J Physiol. 1992;263:H1855–1863. doi: 10.1152/ajpheart.1992.263.6.H1855. [DOI] [PubMed] [Google Scholar]
- 28.Streeter D. Gross morphology and fiber geometry of the heart. In: Berne RM, editor. Handbook of Physiology. Williams & Wilkins; Baltimore, MD: 1979. pp. 61–112. [Google Scholar]
- 29.Taccardi B, Lux R, Ershler P, MacLeod R, Zabawa C, Vyhmeister Y. Computers in Cardiology 1992. IEEE Computer Society Press, Los Alamitos, CA; Durham, NC: 1992. Potential distributions and excitation time maps recorded with high spatial resolution from the entire ventricular surface of exposed dog hearts; pp. 1–4. [Google Scholar]
- 30.Taccardi B, Lux RL, Ershler PR, MacLeod RS, Vyhmeister Y. Effect of myocardial fiber direction on 3-D shape of excitation wave fronts and associated potential distributions in ventricular walls. Circulation. 1992;86:752. [Google Scholar]
- 31.Taccardi B, Lux RL, Ershler PR, MacLeod RS, Vyhmeister Y. Modern views on the spread of excitation in anisotropic heart muscle. Jpn Heart J. 1994;35(Suppl):31–35. [Google Scholar]
- 32.Taccardi B, Macchi E, Lux RL, Ershler PR, Spaggiari S, Baruffi S, Vyhmeister Y. Effect of myocardial fiber direction on epicardial potentials. Circulation. 1994;90:3076–3090. doi: 10.1161/01.cir.90.6.3076. [DOI] [PubMed] [Google Scholar]
- 33.Tranquillo JV, Burwell DO, Henriquez CS. Analytical model of extracellular potentials in a tissue slab with a finite bath. IEEE Trans Biomed Eng. 2005;52:334–338. doi: 10.1109/TBME.2004.840467. [DOI] [PubMed] [Google Scholar]
- 34.Varma N, Jia P, Rudy Y. Electrocardiographic imaging of patients with heart failure with left bundle branch block and response to cardiac resynchronization therapy. J Electrocardiol. 2007;40:S174–178. doi: 10.1016/j.jelectrocard.2007.06.017. [DOI] [PubMed] [Google Scholar]
- 35.Yu C-M, Hayes DL, Auricchio A, editors. Cardiac Resynchronization Therapy. Blackwell Futura; 2006. p. 344. [Google Scholar]


