

Abstract
Synaptic loss underlies the memory deficit of Alzheimer's disease (AD). The molecular mechanism is elusive; however, excitatory synapses organized by the postsynaptic density (PSD) have been used as targets for AD treatment. To identify pathological entities at the synapse in AD, synaptic proteins were screened by quantitative proteomic profiling. The critical proteins were then selected for immunoblot analysis. The glutamate receptors N-methyl-d-aspartate (NMDA) receptor 1 and α-amino-3-hydroxy-5-methyl-4-isoxazolepropionic acid (AMPA) receptor 2 (GluR2) were substantially lost; specifically, the loss of GluR2 was up to 40% at PSD in AD. Shank proteins, the organizers of these glutamate receptors at excitatory synapses, were dramatically altered in AD. The level of Shank2 was increased, whereas the protein level of Shank3 was decreased. Further, the Shank3 protein was modified by ubiquitin, indicating that abnormal activity of the ubiquitin–proteasome system may lead to Shank3 degradation in AD. Our findings suggest that disruption of glutamate receptors at the Shank-postsynaptic platform could contribute to destruction of the PSD which underlies the synaptic dysfunction and loss in AD.
Keywords: Alzheimer's, Glutamate receptor, Synapse, Postsynaptic density, Shank, Proteomic
1. Introduction
Alzheimer's disease (AD) is a progressive neurodegenerative disorder characterized by memory loss. The pathological lesion of AD includes three hallmark changes: amyloid plaques, neurofibrillary tangles and synaptic loss (Haass and Selkoe, 2007). Of the three, synapse loss is the strongest anatomical correlate of the degree of clinical impairment (Selkoe, 2002). However, the molecular pathological entity of synaptic loss remains elusive.
The accumulating evidence from cell biological experiments and clinical treatment shows that excitatory synapses are involved in the development of AD (Snyder et al., 2005). Glutamate receptors are targeted and anchored at excitatory synapses through a network of scaffolding proteins (Boeckers, 2006). The pathological change of glutamate receptors, including N-methyl-d-aspartate (NMDA) receptor, alpha-amino-3-hydroxy-5-methyl-4-isoxazolepropionic acid (AMPA) receptor, and metabotropic glutamate (mGlu) receptor on excitatory synapses, have been widely explored with regard to protein level (Thorns et al., 1997), gene expression (Hynd et al., 2003), channel activity (Shemer et al., 2006), and trafficking (Snyder et al., 2005) in vivo and in vitro from human AD postmortem tissue, transgenic AD mouse models and neuronal culture. Additionally, other typical synaptic proteins such as synaptophysin (Lippa, 2004; Ishibashi et al., 2006), dynamin (Yao et al., 2003), drebrin (Shim and Lubec, 2002) and PSD95 (Gylys et al., 2004, Leuba et al., 2008, Dewachter et al. 2009) have also been shown to change in the AD brain. Currently, the NMDA receptor is used as a target for clinical AD treatment (Robinson and Keating, 2006), which implies that the protein network of NMDA receptor is involved in synaptic dysfunction in AD.
Glutamate receptors along with other postsynaptic proteins in PSD form an integrated protein network (Kennedy, 2000). The number of proteins in PSD was estimated to be up to one thousand (Sheng and Hoogenraad, 2007). To understand these molecular pathological entities, we first used isobaric tags for relative and absolute quantitation (iTRAQ) proteomic analysis to screen for the pathological levels of proteins in PSD. This methodology overcomes the limitations of standard proteomics using two dimensional gels for PSD proteins (Lubec et al., 2003). After iTRAQ quantitative screening, the critical components of the glutamate receptor network were selected and confirmatory analysis by immunoblot was completed at the same synaptic level between AD and control middle frontal gyrus cortical tissues.
Dramatic changes in Shank proteins, which form the postsynaptic platform in PSD and integrate NMDA, AMPA and mGlu receptors (Boeckers, 2006, Baron et al., 2006), were demonstrated in AD human tissue by iTRAQ and immunoblot analyses. In contrast to an increase in Shank2 protein, we found that Shank3 protein was dramatically lost and obviously modified by ubiquitin, which implies that an abnormal activity of ubiquitin–proteasome system (UPS) may lead to Shank3 degradation in AD. These pathological changes could lead to the disorganization of glutamate receptors at the postsynaptic Shank-platform, contributing to the dysfunction of NMDA receptors and AMPA receptors at postsynaptic density in AD. These findings shed light on a little studied pathological change — the destruction of Shank-postsynaptic platform leading to the structural and functional changes of PSD in AD.
2. Results
2.1. The proteins of synaptic markers were enriched in synaptic fractions from surviving synapse in human AD brain
Synaptic loss leads to lower levels of many synaptic proteins in AD. To control for these overall losses, the synaptic proteins at surviving synapses in AD and control were first isolated and enriched into a synaptosome fraction; the synaptosomes were further used to enrich postsynaptic proteins in PSD. Equal protein amounts of synaptosome or PSD from AD and control were then used to identify or screen the change of synaptic proteins in AD by immunoblot or proteomic analysis. To indicate whether the synaptic proteins were enriched in both fractions from human postmortem brain tissues for our further analyses, we selected synaptophysin as a presynaptic marker and PSD95 and synGap as postsynaptic markers in western blot (Fig. 1). These synaptic proteins were all enriched in the synaptosome fraction; and the postsynaptic markers PSD95 and synGap were clearly enriched in the PSD fraction. PSD95 and SynGap, both critical proteins found exclusively at the glutamate receptor network at excitatory synapses, were enriched in PSD fraction. This enriched PSD fraction may be helpful to screen for pathological changes of postsynaptic proteins by proteomic analysis (Fig. 1). The markers PSD95 and synGap are critical components at the glutamate receptor network, and the change of PSD95 has previously been reported in AD brain (Gylys et al., 2004, Leuba et al., 2008, Dewachter et al. 2009), but these results are not consistent.
Fig. 1.
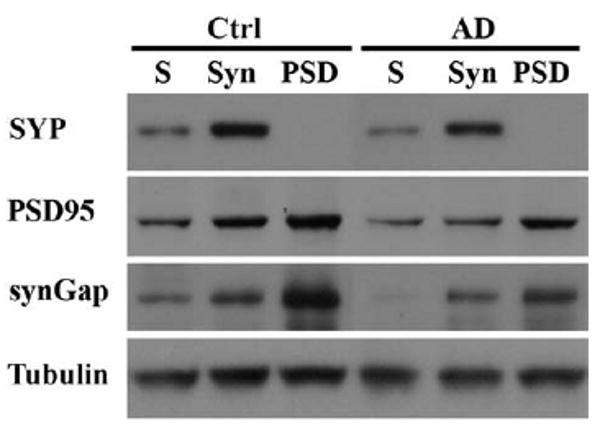
Synaptosome and PSD were isolated from human postmortem cortical tissues. Equivalent protein amounts of the isolated synaptosome and PSD were separated by 4–20% SDS-PAGE and transferred to nitrocellulose membrane. Immunoblot shows synGap and PSD95, excitatory postsynaptic markers, were enriched in PSD fraction. Synaptophysin, a presynaptic marker, was enriched in synaptosome fraction, but not in PSD fraction. S: the supernatant for synaptosome preparation in method; Syn: synaptosome; PSD: postsynaptic density; Ctrl: normal control middle frontal gyrus cortical tissue, and AD: AD frontal gyrus cortical tissue.
2.2. Pathological change of glutamate receptors and their associated proteins at surviving synapse in AD brain
To identify the pathological changes of proteins at the glutamate receptor network in synapse, we selected typical subtypes of glutamate receptor, NMDA receptor 1 (NR1), AMPA receptor 2 (GluR2), and mGlu receptor 1a (mGluR1a), as markers to observe whether their protein levels changed in our prepared synaptosomes. In addition, several critical proteins associated with these receptors' protein network were also selected for analysis, such as PSD95 postsynaptic marker associated with NMDA and AMPA receptor as positive markers (Gylys et al., 2004; Kennedy, 2000), and Homer associated with mGlu receptor (Guhan, and Lu, 2004). We found that the levels of NR1 and GluR2, at the isolated synapses with equivalent synaptic protein levels between AD and control, were significantly lost in AD (p<0.001); however, the level of PSD95, the organizer of these receptors, was significantly increased in AD synaptosome. The level of mGluR1a and its binding protein homer showed no significant difference in the synaptosome between AD and control (Fig. 2). At the synapse of AD, the high level of PSD95 protein did not normalize the levels of its binding receptors NR1 and GluR2, which suggests more factors are involved in the de-organization of glutamate receptors at synapse in AD.
Fig. 2.
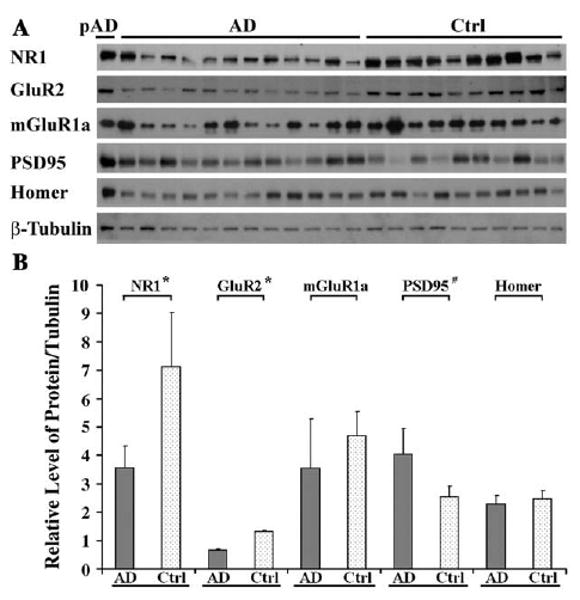
Pathological level of proteins relevant to glutamate receptors were shown in synaptosome from AD brains (mean±SEM). (A) Western blot: the synaptosomes from 12 AD and 1 preclinical AD and 10 control middle frontal gyrus cortical tissues were separated by 4–20% SDS-PAGE, and transferred to a nitrocellulose membrane. The primary antibodies were selected as indicated. (B) Graph of protein relative levels with y axis as the relative densities of protein bands normalized by the relative densities of β-tubulin bands: NMDA receptor NR1 and AMPA receptor GluR2 were significantly lost 50±10.7% and 49.5±3% in AD, respectively (*P<0.001); however, PSD95 was significantly increased 58.3±36.6% in AD (#P<0.05). mGluR 1a and Homer showed no significant change between AD and control (P>0.05). pAD (preclinical AD) showed normal levels of these proteins.
2.3. Pathological changes of glutamate receptors and Shank at PSD were screened by iTRAQ analysis and verified by immunoblot
The glutamate receptor network at the synapse is complex and it is, therefore, impossible to identify pathological protein changes at this network by traditional biochemical analysis methods. To understand the pathological synaptic entities other than NMDA receptor: NR1 and AMPA receptors, GluR2, and their associated PSD95 in AD, we used iTRAQ proteomic analysis to screen for the pathological changes of synaptic proteins in the same synaptosomes described above. In the synaptosome proteomic data, 532 proteins were identified and 92 were changed in AD compared with controls (data not shown). However, we found only the critical protein synGap at the glutamate receptor network to be significantly lost. Based on the rank number of relative protein abundance for synGap of 355, it appears that synaptic proteins are not enriched much in synaptosome fractions for iTRAQ proteomics analysis.
We then screened the postsynaptic-enriched PSD fraction by iTRAQ proteomics. As expected, we found that synGap was enriched at the rank number 34 in PSD, and shifted from a rank number 355 in the synaptosome. A total of 565 proteins were identified in PSD fraction; 133 were changed in AD compared to control (data not shown). Besides synGap, several other interesting synaptic proteins at the glutamate receptor network were identified and changes were observed in AD (Table 1). These proteins include Shank3, an organizer of PSD and glutamate receptors; NSF, a regulator of AMPA receptor trafficking located at presynaptic and postsynaptic sites; and IRSp53, a binding protein of Shank regulating morphological changes of neurons. Among these proteins, the Shank proteins play a key role to directly or indirectly organize the NMDA receptors, AMPA receptors, and mGlu receptors at PSD. Twenty-seven peptide fragments of Shank3 were identified (data not shown), and only the 5 fragments of Shank3 were automatically quantified by iTRAQ analysis and were shown to be lost (Table 2). Here, we selected Shank3, NR1, GluR2 and mGluR1a for further detection at postsynaptic density by western blot. The level of Shank3 was found to be significantly lower, and the NR1 and GluR2 were also obviously lost at PSD in AD (Fig. 3). Shank3 showed multiple bands in western blot, which was confirmed by LC-MS/MS (data not shown; Tu et al., 1999).
Table 1. Proteins at glutamate receptor network in PSD were quantified by iTRAQ analysis.
| Gene name | Accession | N | AD 116:Ctrl 114 | AD 117:Ctrl 114 | % Cov | Peptide used for ratio | Peptide unused for ratio | ||||
|---|---|---|---|---|---|---|---|---|---|---|---|
| Ratio | P | EF | Ratio | P | EF | ||||||
| Shank3 | IPI00019794.10 | 107 | 0.55 | <0.01 | 1.13 | 0.53 | <0.01 | 1.1 | 13.16 | 5 | 21 |
| SynGAP1 | IPI00796859.1 | 34 | 0.61 | <0.01 | 1.37 | 0.59 | <0.01 | 1.33 | 22.12 | 12 | 26 |
| BAIAP2 | IPI00647603.1 | 164 | 0.46 | <0.01 | 1.18 | 0.45 | <0.01 | 1.24 | 10.35 | 2 | 3 |
| NSF | IPI00006451.6 | 12 | 0.70 | <0.01 | 1.15 | 0.71 | <0.01 | 1.17 | 33.2 | 16 | 19 |
N: the rank in the data of iTRAQ; Ctrl: Control; Ratio: protein level between AD and Control, P: p-value indicating protein significant expression in samples for identification (more explanation in Experimental procedures); EF: error factor; Cov: coverage.
Table 2. Shank3 fragment sequences were identified and quantified in PSD by iTRAQ analysis.
| Fragment sequence | Ratio | ||
|---|---|---|---|
| Ctrl 115:Ctrl 114 | AD 116:Ctrl 114 | AD 117:Ctrl 114 | |
| DDFVELGVTR | 0.82 | 0.51 | 0.51 |
| ITPAEISSLFER | 0.99 | 0.66 | 0.58 |
| SMTAELEELASIR | 1.12 | 0.63 | 0.53 |
| SPAWIPVPAR | 0.55 | 0.42 | 0.43 |
| VGIPDLQQTK | 0.97 | 0.49 | 0.48 |
Ratio expresses the levels of these fragments released from Shank3 between AD and control. Ctrl: control.
Fig. 3.
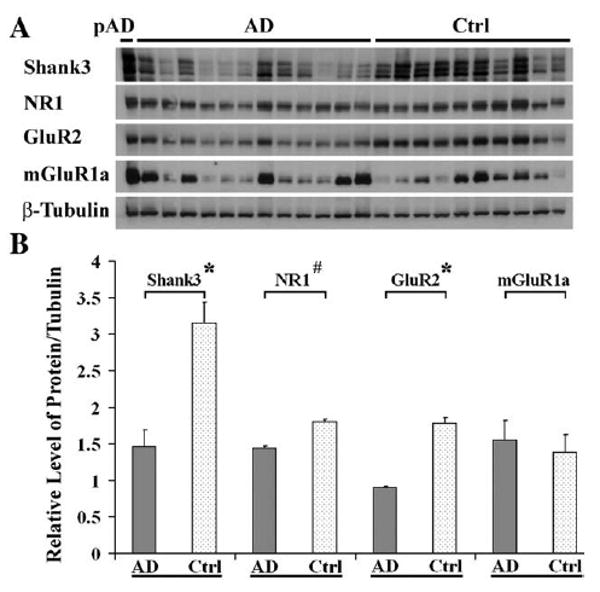
The proteins of NR1, GluR2 and Shank3 were dramatically lost in the PSD of AD (mean±SEM). (A) Western blot: equivalent protein amounts of PSDs from 12 AD, one preclinical AD and 10 control middle frontal gyrus cortical tissues were separated by 4–20% SDS-PAGE and transferred to nitrocellulose membrane. The primary antibodies to NR1, GluR2 and Shank3 were used for immunoblot. (B) Graph of protein relative levels: NR1, GluR2, and Shank3 proteins were significantly decreased 20±1.7%, 43±1.1%, and 54±7.3% in AD, respectively (*P<0.001, #P<0.05). The y axis is the same as in Fig. 2. pAD (preclinical AD) showed normal levels of these proteins.
2.4. Shank-postsynaptic platform was altered at synapse in AD
Shank plays a central role in the formation of the postsynaptic platform, in the integration of the protein network of glutamate receptors at PSD, and in the maintenance of synaptic structures (Boeckers, 2006). The Shank protein family has three members: Shank1, Shank2 and Shank3. In the previous results, we found Shank3 protein was obviously lost in AD; the next question is whether other members, Shank1 and Shank2, are also changed in AD? Antibodies to Shank1, 2 and 3 were used to detect their protein levels in synaptosomes by immunoblot, and the neuronal receptor α3-Na+, K+-ATPase was used as the plasma membrane marker (Hilgenberg et al., 2006). The protein level of Shank3 was significantly decreased in the AD synaptosome fraction consistent with the PSD fraction results; however, Shank2 was significantly increased (p<0.001) and Shank1 showed a nonsignificant change. The neuronal plasma membrane marker α3-Na+, K+-ATPase was also unchanged in AD (Fig. 4).
Fig. 4.
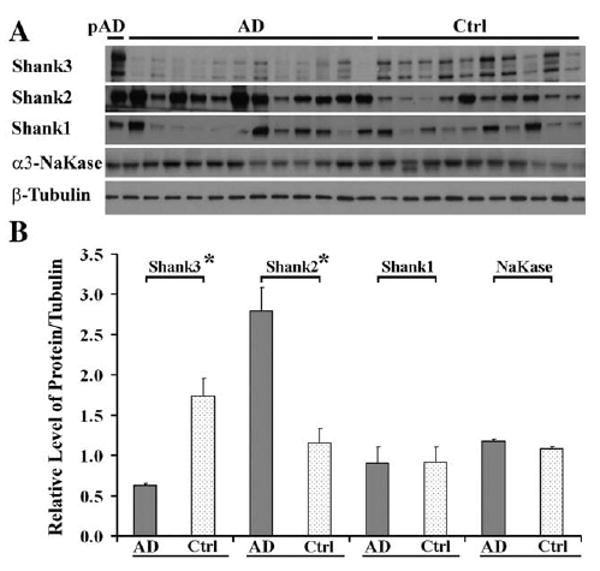
In contrast to Shank3 loss, Shank2 protein level was increased in synaptosome from AD middle frontal gyrus cortical tissues (mean±SEM). (A) Western blot: equivalent protein amounts of synaptosomes from 12 AD, one preclinical AD and 10 control middle frontal gyrus cortical tissues were separated by 4–20% SDS-PAGE and transferred to nitrocellulose membrane. The primary antibodies to Shank3, Shank2, Shank1 and α3-Na+, K+-ATPase (NaKase) were used for immunoblot. (B) Graph of protein relative levels: Shank3 protein level was significantly decreased 64 ±1.7% (*P<0.001) in synaptosome of AD, however, Shank2 was obviously increased 140±25.2% (*P<0.001). The y axis is the same as in Fig. 2. The mean value of Shank1 protein levels was also increased, but was not significant. The membrane marker neuronal receptor α3-Na+, K+-ATPase was at the same levels between AD and control (P>0.05). pAD (preclinical AD) showed normal levels of these proteins.
2.5. Shank-postsynaptic platform was altered by ubiquitin–proteasome system in AD
Shank proteins form the postsynaptic platform in PSD which is regulated by UPS in the normally functioning synapse (Ehlers, 2003). Pathological change of UPS has been previously shown in AD (Oddo, 2008). Here, we further detected whether the degradation of Shank3 was related to the abnormal activity of UPS in AD. The synaptic proteins in synaptosome fractions of human AD and control middle frontal gyrus cortex were tested and the ubiquitinated-proteins were pulled down by polyubiquitin enriched kit. The proteins were eluted from polyubiquitin affinity beads for Shank3 western blot. Fig. 5 shows the higher density of smear Shank3 bands in AD sample compared with that in control, indicating the increase of polyubiquitination of Shank3 in AD. The Shank1 and Shank2 antibodies were used to detect the ubiquitinated pulled fraction; we did not find obvious immunoreactivity, which could be due to the low sensitivity of Shank1 and Shank2 antibodies (data not shown). These results imply that the abnormal function of the ubiquitin–proteasome system may play a critical role in the degradation of Shank3 in human AD brain, leading to destruction of PSD.
Fig. 5.
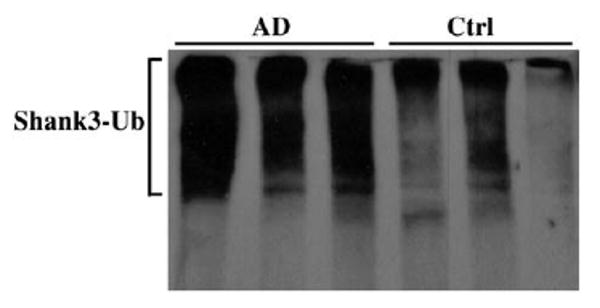
Ubiquitinated Shank3 was increased in AD brain. The proteins of synaptosomes from AD and control brain tissues were solubilized in TBS buffer with 0.1% SDS. Ubiquitinated-proteins were pulled down by polyubiquitin enriched kit (Pierce Biotechnology) and detected by Shank3 immunoblot. Shank3 proteins were displayed as a smear band which indicated Shank3 proteins were ubiquitinated in synaptosomes of 3 AD brain tissues respectively, and not in 3 control brain tissues. Shank3-Ub: Shank3 modified by ubiquitin, Ctrl: control middle frontal gyrus tissue, AD: AD middle frontal gyrus tissue.
3. Discussion
In this study, iTRAQ proteomic analysis was used to screen for pathological change of synaptic proteins at the PSD from human AD brain tissues. We found that Shank proteins, forming postsynaptic platform to integrate subunits of glutamate receptor on the postsynaptic membrane and to organize the PSD structure and to maintain synaptic function (Baron et al., 2006), were dramatically altered in AD. These results were confirmed by immunoblot. Further, Shank3 was modified by polyubiquitin at surviving synapses in AD, indicating that abnormal activity of UPS may be involved in Shank3 degradation. In contrast Shank2 was significantly increased at PSD in AD. These pathological changes of Shank proteins implicate the destruction of Shank-postsynaptic platform as a component of the dysfunction of glutamate receptors and the destruction of PSD, ultimately contributing to synaptic loss in AD. Glutamate receptors have been implicated in the excitotoxic neuronal death involved in the pathogenesis of AD (Shemer et al., 2006). The levels of the subunits of glutamate receptors have been shown to change in human AD brain at the total tissue level using different methods (Thorns et al., 1997; Bernareggi et al., 2007). Because of the synaptic loss in AD, the results from total brain tissue could differ based on the unequal total synaptic level between AD and control. Here, we isolated synapses as synaptosome and PSD from human brain tissues to compare the possible pathological changes at the same synaptic levels. Indeed, NR1 and GluR2 were obviously lost at synaptosome and PSD in AD. The protein levels of GluR2 and NR1 were decreased 49.5% and 50% in synaptosome of AD compared with that in controls, respectively. However, the level of GluR2 was decreased up to 43% and the level of NR1 was only decreased 20% in PSD of AD compared with that in control, which implies the AMPA receptors are more vulnerable than NMDA receptors at PSD in AD. The protein level of mGluR1a at synaptosome and at PSD showed large deviations among the AD and control cases. We do not know what factors lead to this change of mGluR1a and what function this change has in the human brain. Based on the large change of AMPA receptor GluR2 compared to that of NR1 at PSD in AD, we believe AMPA receptor at PSD could be another more effective target beside NR1 for AD treatment. The use of NMDA receptor and other glutamate receptors, such as AMPA, as targets for AD clinical treatment (Robinson and Keating, 2006) or in clinical trials (Chappell et al., 2007) further supports this.
Shank proteins form the postsynaptic platform in PSD and play a critical role in integrating various postsynaptic membrane proteins including NMDA receptor complex, AMPA receptor complex and mGlu receptor complex (Boeckers, 2006). Shanks may cross-link Homer and PSD-95 to form complexes in the PSD and regulate the signaling pathways of NMDA, AMPA and mGlu receptors. Shank proteins and the associated glutamate receptors participate in a concerted manner to form spines and functional synapses (Roussignol et al., 2005). The dynamic rearrangement of PSD induced by UPS seems to be the structural basis for the synaptic regulation and synaptic plasticity that may be involved in long-term memory formation (Hering and Sheng, 2001). In AD, UPS function is abnormal (Oddo, 2008); our results indicated Shank3 was modified by ubiquitin in AD, implying Shank3 degradation could be related to abnormal function of UPS in AD. In contrast, the protein level of Shank2 was increased at the synapse, and the protein level of Shank 1 did not show significant change in AD. Recently, reduced size of dendritic spines, smaller, thinner PSDs and weaker basal synaptic transmission as a result of altered PSD protein composition were found in Shank1 knockout mice (Hung et al., 2008). In AD brain, the loss of presynaptic structure could also lead to the changes in the postsynaptic structures, and oligomers of β-amyloid attack the postsynaptic region (Gong et al., 2003; Lacor et al., 2004) and associate PSD (Koffie et al., 2009). All these pathological changes could lead to the disruption of glutamate receptors at postsynaptic platform in AD. The change of Shank at PSD in human AD may directly affect the structure of Shank-postsynaptic platform in PSD, which is known to be lost in memory damaged brains (Nyffeler et al., 2007). This pathological change of Shank in PSD could also contribute to the disorganization of glutamate receptors at PSD.
Shank proteins play critical roles in the maintenance of normal structure and function of excitatory synapses. The machinery of the Shank-postsynaptic platform is significantly changed in AD brain, which implies that the destruction of this platform may lead to the destruction of normal PSD and disorganization of glutamate receptors at PSD underlying synaptic dysfunction and loss in AD. These findings provide new insights into the molecular pathological mechanisms behind the synaptic loss in AD.
4. Experimental procedures
4.1. Human AD brain tissues
Brain tissues were obtained at autopsy from 12 patients diagnosed clinically and histopathologically with AD (70–93 years, postmortem period 6.9±2.4 h) and one preclinical familial AD (known PS1 mutation without clinical symptoms and with amyloid pathological changes, 51 years, postmortem period 7 h) (Lippa et al., 1998), and from 10 age matched controls (54–86 years, postmortem period 7.3±3.3 h) with no clinical or morphologic evidence of brain pathology. The description of cases and pathological analysis in the middle frontal gyrus cortex are listed in Supplemental data (Table S1). In this manuscript, we focused on excitatory synapses; therefore, we considered potential effects of medications on the level of glutamate receptors. Currently, the drug, most relevant to the glutamate receptor, is memantine, an antagonist of NMDA receptor. None of our control or AD subjects were on memantine or other NMDA receptor modulators. All tissues were obtained from the DUCOM Memory Disorders brain bank.
4.2. Synaptosome and PSD isolation
Synaptosome and PSD were isolated from human AD and control middle frontal gyrus cortical tissues (Carlin et al., 1980). Briefly, tissues were homogenized in Buffer A (0.32 M Sucrose–5 mM HEPES pH 7.4, 1 mM MgCl2, 0.5 mM CaCl2 and protease inhibitors 200 μg/ml PMSF, 2 μg/ml pepstatin A, 4 μg/ml leupeptin, and 30 μg/ml benzamidine hydrochloride) with a Teflon homogenizer. The resultant homogenates were centrifuged at 1400 g×10 min. The pellets were re-homogenized in the same Buffer A and centrifuged at 700 g×10 min. The combined supernatants (starting material S for analysis) were centrifuged at 13,800 g×10 min. The pellets were used as total membrane (P1) and resuspended in Buffer B (0.32 M sucrose–6 mM Tris–HCl, pH 8.0 with the same inhibitors), loaded onto sucrose gradient (0.85/1/1.15 M in 6 mM Tris–HCl, pH 8.0) and centrifuged at 82,500 g×120 min. The synaptosomes were collected from the interface between 1 M and 1.15 M for analysis and PSD preparation.
4.3. Quantitative proteomic analysis
The proteomic analysis was performed according to previously described methods (Snelling et al., 2007), and is briefly described here. Protein Trypsin Digestion and iTRAQ™ Isobaric Labeling: equal amounts (200 μg) of sample were used for trypsin digestion and labeled with iTRAQ reagents [iTRAQ-114 and iTRAQ-115 (Control) or iTRAQ-116 and iTRAQ-117 (AD), Applied Biosystems, CA]. Off-Line Strong Cation Exchange Chromatography: iTRAQ labeled peptides were concentrated, mixed, and acidified, followed by injection into an Agilent 1100 HPLC system with a Zorbax 300-SCX column (4.6 ID×250 mm) (Agilent, Waldbronn, Germany). A total of 30 fractions were collected and samples were dried by a speed-vac prior to LC-MS/MS analysis. On-Line Nano-LC ESI QqTOF MS Analysis: a nanobore LC system (Dionex, Sunnyvale, CA) which was interfaced to a QSTAR XL QqTOF mass spectrometer with a NanoSpray ion source (Applied Biosystems, Forst City, CA) was used for tandem mass spectrometry. The Magic C18 100 A pore 75 μm ID×150 mm (Michrom Bioresources Inc. Auburn, CA, USA) was packed in-house.
Protein identification and quantitation were performed using a ProteinPilot 2 software (Applied Biosystems, CA) integrated with IPI-human database (version 3.24) (68020 entries). Quantification was based upon the signature peak areas (m/z: 114, 115, 116, 117) and corrected according to the manufacturer's instructions to account for isotopic overlap. Statistically significant changes were defined by the error factor and p-value. The p-value is used to assess whether the protein is significantly expressed for identification. p-value is determined by calculating Student's t-factor by dividing the weighted average of log ratios–log bias by the weighted standard deviation, allowing determination of the p-value, with n–1 degrees of freedom, again where n is the number of peptides contributing to protein relative quantification. p-value and 95% confidence interval were defined a range in which the true average iTRAQTM ratio 95% was likely to fall. For instance, for a ratio of 1.0 (indicating no change in the expression level between AD and control), with an error factor of 2 (the corresponding 95% confidence interval of 0.5–2.0), the protein expression ratio and error were reported as 1.0 (p<0.05 with an error factor of 2). Proteins with ratios >1.1 and <0.9 for AD and control respectively are considered significantly up-and down-regulated.
4.4. Ubiquitinated-protein affinity isolation
Synaptosomes were isolated from AD and control middle frontal gyrus, and equal amounts of synaptic proteins from AD and control synaptosomes were solubilized in TBS buffer (10 mM Tris–HCl, 100 mM NaCl) with 0.1% SDS at 70 °C for 15 min. The ubiquitinated-proteins in supernatants at 100,000 g for 30 min were pulled down by ubiquitin-interacting motif affinity gel (polyubiquitin enrich kit, Pierce Biotechnology) according to manufacturer's instruction. The gels were washed by TBS buffer with 0.1% SDS for three times. 1% SDS Laemmli sample buffer was used to elute ubiquitinated-proteins for western blot.
4.5. Western analysis
Western analysis was based on published procedures (Gong et al., 2003). Briefly, protein samples were dissolved in 1× Laemmli sample buffer and separated by SDS-Polyacrylamide gel electrophoresis, and were transferred to nitrocellulose membrane. The proteins were recognized by specific antibodies and visualized with enhanced chemiluminescence. The antibodies to Shank3 (rabbit 1:1000), Shank2 (goat 1:200) and Shank1 (goat 1:100), synGap (goat 1:500), NMDA receptor 1 (rabbit 1:500), GluR-2 (goat, 1:500); PSD95 (goat 1:500), Homer (mouse 1:500), and β-Tubulin (rabbit 1:500), α3-Na+, K+-ATPase (goat 1:500) were purchased from Santa Cruz. Synaptophysin antibody (mouse 1:500) was from DAKO. Anti-metabotropic glutamate receptor 1a (rabbit 1:1000) was purchased from Affinity Bioreagents.
4.6. Statistical analysis
All reported results were analyzed by two-tailed t-tests in Microsoft Excel. Results are expressed as means±SEM.
Supplementary Material
Acknowledgments
We would like to thank Robert A. Nichols and Guillermo M. Alexander for their kind help with the experiments, and Matthew R. Myerson and Erin Reichenberger for help in manuscript preparation. The QSTAR XL mass spectrometer used in this work was supported through NIH under grant 1S10RR01782-01A1. Other work was supported by the Potamkin Foundation for Lippa and NIH1R21AG031388 for Gong.
Abbreviations
- AD
Alzheimer's disease
- PSD
postsynaptic density
- NR1
N-methyl-d-aspartate (NMDA) receptor 1
- mGlu
metabotropic glutamate
- GluR2
α-amino-3-hydroxy-5-methyl-4-isoxazolepropionic acid (AMPA) receptor 2
- NSF
N-ethylmaleimide-sensitive fusion protein
- iTRAQ
isobaric tags for relative and absolute quantitation
- UPS
ubiquitin–proteasome system
- IRSp53
insulin receptor substrate protein 53 (BAIAP2)
Footnotes
Appendix A. Supplementary data: Supplementary data associated with this article can be found, in the online version, at doi:10.1016/j.brainres.2009.07.056.
References
- Baron MK, Boeckers TM, Vaida B, Faham S, Gingery M, Sawaya MR, Salyer D, Gundelfinger ED, Bowie JU. An architectural framework that may lie at the core of the postsynaptic density. Science. 2006;311(5760):531–535. doi: 10.1126/science.1118995. [DOI] [PubMed] [Google Scholar]
- Bernareggi A, Dueñas Z, Reyes-Ruiz JM, Ruzzier F, Miledi R. Properties of glutamate receptors of Alzheimer's disease brain transplanted to frog oocytes. Proc Natl Acad Sci U S A. 2007;104(8):2956–2960. doi: 10.1073/pnas.0611513104. [DOI] [PMC free article] [PubMed] [Google Scholar]
- Boeckers TM. The postsynaptic density. Cell Tissue Res. 2006;326(2):409–422. doi: 10.1007/s00441-006-0274-5. [DOI] [PubMed] [Google Scholar]
- Carlin RK, Grab DJ, Cohen RS, Siekevitz P. Isolation and characterization of postsynaptic densities from various brain regions: enrichment of different types of postsynaptic densities. J Cell Biol. 1980;86(3):831–845. doi: 10.1083/jcb.86.3.831. [DOI] [PMC free article] [PubMed] [Google Scholar]
- Chappell AS, Gonzales C, Williams J, Witte MM, Mohs RC, Sperling R. AMPA potentiator treatment of cognitive deficits in Alzheimer disease. Neurology. 2007;68(13):1008–1012. doi: 10.1212/01.wnl.0000260240.46070.7c. [DOI] [PubMed] [Google Scholar]
- Dewachter I, Filipkowski RK, Priller C, Ris L, Neyton J, Croes S, Terwel D, Gysemans M, Devijver H, Borghgraef P, Godaux E, Kaczmarek L, Herms J, Van Leuven F. Deregulation of NMDA-receptor function and down-stream signaling in APP[V717I] transgenic mice. Neurobiol Aging. 2009;30(2):241–256. doi: 10.1016/j.neurobiolaging.2007.06.011. [DOI] [PubMed] [Google Scholar]
- Ehlers MD. Activity level controls postsynaptic composition and signaling via the ubiquitin–proteasome system. Nat Neurosci. 2003;6(3):231–242. doi: 10.1038/nn1013. [DOI] [PubMed] [Google Scholar]
- Gong Y, Chang L, Viola KL, Lacor PN, Lambert MP, Finch CE, Krafft GA, Klein WL. Alzheimer's disease-affected brain: presence of oligomeric A beta ligands (ADDLs) suggests a molecular basis for reversible memory loss. Proc Natl Acad Sci U S A. 2003;100(18):10417–10422. doi: 10.1073/pnas.1834302100. [DOI] [PMC free article] [PubMed] [Google Scholar]
- Guhan N, Lu B. Homer–PIKE complex: a novel link between mGluRI and PI 3-kinase. Trends Neurosci. 2004;27(11):645–648. doi: 10.1016/j.tins.2004.08.011. [DOI] [PubMed] [Google Scholar]
- Gylys KH, Fein JA, Yang F, Wiley DJ, Miller CA, Cole GM. Synaptic changes in Alzheimer's disease: increased amyloid-beta and gliosis in surviving terminals is accompanied by decreased PSD-95 fluorescence. Am J Pathol. 2004;165(5):1809–1817. doi: 10.1016/s0002-9440(10)63436-0. [DOI] [PMC free article] [PubMed] [Google Scholar]
- Haass C, Selkoe DJ. Soluble protein oligomers in neurodegeneration: lessons from the Alzheimer's amyloid beta-peptide. Nat Rev Mol Cell Biol. 2007;8(2):101–112. doi: 10.1038/nrm2101. [DOI] [PubMed] [Google Scholar]
- Hering H, Sheng M. Dendritic spines: structure, dynamics and regulation. Nat Rev Neurosci. 2001;2(12):880–888. doi: 10.1038/35104061. [DOI] [PubMed] [Google Scholar]
- Hilgenberg LG, Su H, Gu H, O'Dowd DK, Smith MA. α3-Na+/K+-ATPase is a neuronal receptor for agrin. Cell. 2006;125(2):359–369. doi: 10.1016/j.cell.2006.01.052. [DOI] [PubMed] [Google Scholar]
- Hung AY, Futai K, Sala C, Valtschanoff JG, Ryu J, Woodworth MA, Kidd FL, Sung CC, Miyakawa T, Bear MF, Weinberg RJ, Sheng M. Smaller dendritic spines, weaker synaptic transmission, but enhanced spatial learning in mice lacking Shank1. J Neurosci. 2008;28(7):1697–1708. doi: 10.1523/JNEUROSCI.3032-07.2008. [DOI] [PMC free article] [PubMed] [Google Scholar]
- Hynd MR, Scott HL, Dodd PR. Quantitation of alternatively spliced NMDA receptor NR1 isoform mRNA transcripts in human brain by competitive RT-PCR. Brain Res Brain Res Protoc. 2003;11(1):52–66. doi: 10.1016/s1385-299x(03)00015-1. [DOI] [PubMed] [Google Scholar]
- Ishibashi K, Tomiyama T, Nishitsuji K, Hara M, Mori HJ. Absence of synaptophysin near cortical neurons containing oligomer Abeta in Alzheimer's disease brain. J Neurosci Res. 2006;84(3):632–636. doi: 10.1002/jnr.20952. [DOI] [PubMed] [Google Scholar]
- Kennedy MB. Signal-processing machines at the postsynaptic density. Science. 2000;290(5492):750–754. doi: 10.1126/science.290.5492.750. [DOI] [PubMed] [Google Scholar]
- Koffie RM, Meyer-Luehmann M, Hashimoto T, Adams KW, Mielke ML, Garcia-Alloza M, Micheva KD, Smith SJ, Kim ML, Lee VM, Hyman BT, Spires-Jones TL. Oligomeric amyloid beta associates with postsynaptic densities and correlates with excitatory synapse loss near senile plaques. Proc Natl Acad Sci U S A. 2009;106(10):4012–4017. doi: 10.1073/pnas.0811698106. [DOI] [PMC free article] [PubMed] [Google Scholar]
- Lacor PN, Buniel MC, Chang L, Fernandez SJ, Gong Y, Viola KL, Lambert MP, Velasco PT, Bigio EH, Finch CE, Krafft GA, Klein WL. Synaptic targeting by Alzheimer's-related amyloid beta oligomers. J Neurosci. 2004;24(45):10191–10200. doi: 10.1523/JNEUROSCI.3432-04.2004. [DOI] [PMC free article] [PubMed] [Google Scholar]
- Leuba G, Savioz A, Vernay A, Carnal B, Kraftsik R, Tardif E, Riederer I, Riederer BM. Differential changes in synaptic proteins in the Alzheimer frontal cortex with marked increase in PSD-95 postsynaptic protein. J Alzheimers Dis. 2008;15(1):139–151. doi: 10.3233/jad-2008-15112. [DOI] [PubMed] [Google Scholar]
- Lippa CF. Synaptophysin immunoreactivity in Pick's disease: comparison with Alzheimer's disease and dementia with Lewy bodies. Am J Alzheimers Dis Other Demen. 2004;19(6):341–344. doi: 10.1177/153331750401900606. [DOI] [PMC free article] [PubMed] [Google Scholar]
- Lippa CF, Nee LE, Mori H, St George-Hyslop P. Abeta-42 deposition precedes other changes in PS-1 Alzheimer's disease. Lancet. 1998;352(9134):1117–1118. doi: 10.1016/s0140-6736(05)79757-9. 3. [DOI] [PubMed] [Google Scholar]
- Lubec G, Krapfenbauer K, Fountoulakis M. Proteomics in brain research: potentials and limitations. Prog Neurobiol. 2003;69(3):193–211. doi: 10.1016/s0301-0082(03)00036-4. [DOI] [PubMed] [Google Scholar]
- Nyffeler M, Zhang WN, Feldon J, Knuesel I. Differential expression of PSD proteins in age-related spatial learning impairments. Neurobiol Aging. 2007;28(1):143–155. doi: 10.1016/j.neurobiolaging.2005.11.003. [DOI] [PubMed] [Google Scholar]
- Oddo S. The ubiquitin–proteasome system in Alzheimer's disease. J Cell Mol Med. 2008;12(2):363–373. doi: 10.1111/j.1582-4934.2008.00276.x. [DOI] [PMC free article] [PubMed] [Google Scholar]
- Robinson DM, Keating GM. Memantine: a review of its use in Alzheimer's disease. Drugs. 2006;66(11):1515–1534. doi: 10.2165/00003495-200666110-00015. [DOI] [PubMed] [Google Scholar]
- Roussignol G, Ango F, Romorini S, Tu JC, Sala C, Worley PF, Bockaert J, Fagni L. Shank expression is sufficient to induce functional dendritic spine synapses in aspiny neurons. J Neurosci. 2005;25(14):3560–3570. doi: 10.1523/JNEUROSCI.4354-04.2005. [DOI] [PMC free article] [PubMed] [Google Scholar]
- Selkoe DJ. Alzheimer's disease is a synaptic failure. Science. 2002;298(5594):789–791. doi: 10.1126/science.1074069. [DOI] [PubMed] [Google Scholar]
- Shemer I, Holmgren C, Min R, Fülöp L, Zilberter M, Sousa KM, Farkas T, Härtig W, Penke B, Burnashev N, Tanila H, Zilberter Y, Harkany T. Non-fibrillar beta-amyloid abates spike-timing-dependent synaptic potentiation at excitatory synapses in layer 2/3 of the neocortex by targeting postsynaptic AMPA receptors. Eur J Neurosci. 2006;23(8):2035–2047. doi: 10.1111/j.1460-9568.2006.04733.x. [DOI] [PubMed] [Google Scholar]
- Sheng M, Hoogenraad CC. The postsynaptic architecture of excitatory synapses: a more quantitative view. Annu Rev Biochem. 2007;76:823–847. doi: 10.1146/annurev.biochem.76.060805.160029. [DOI] [PubMed] [Google Scholar]
- Shim KS, Lubec G. Drebrin, a dendritic spine protein, is manifold decreased in brains of patients with Alzheimer's disease and Down syndrome. Neurosci Lett. 2002;324(3):209–212. doi: 10.1016/s0304-3940(02)00210-0. [DOI] [PubMed] [Google Scholar]
- Snelling WJ, Lin Q, Moore JE, Millar BC, Tosini F, Pozio E, Dooley JS, Lowery CJ. Proteomics analysis and protein expression during sporozoite excystation of Cryptosporidium parvum (Coccidia, Apicomplexa) Mol Cell Proteomics. 2007;6(2):346–355. doi: 10.1074/mcp.M600372-MCP200. [DOI] [PubMed] [Google Scholar]
- Snyder EM, Nong Y, Almeida CG, Paul S, Moran T, Choi EY, Nairn AC, Salter MW, Lombroso PJ, Gouras GK, Greengard P. Regulation of NMDA receptor trafficking by amyloid-β. Nat Neurosci. 2005;8(8):1051–1058. doi: 10.1038/nn1503. [DOI] [PubMed] [Google Scholar]
- Thorns V, Mallory M, Hansen L, Masliah E. Alterations in glutamate receptor 2/3 subunits and amyloid precursor protein expression during the course of Alzheimer's disease and Lewy body variant. Acta Neuropathol. 1997;94(6):539–548. doi: 10.1007/s004010050748. [DOI] [PubMed] [Google Scholar]
- Tu JC, Xiao B, Naisbitt S, Yuan JP, Petralia RS, Brakeman P, Doan A, Aakalu VK, Lanahan AA, Sheng M, Worley PF. Coupling of mGluR/Homer and PSD-95 complexes by the Shank family of postsynaptic density proteins. Neuron. 1999;23(3):583–592. doi: 10.1016/s0896-6273(00)80810-7. [DOI] [PubMed] [Google Scholar]
- Yao PJ, Zhu M, Pyun EI, Brooks AI, Therianos S, Meyers VE, Coleman PD. Defects in expression of genes related to synaptic vesicle trafficking in frontal cortex of Alzheimer's disease. Neurobiol Dis. 2003;12(2):97–109. doi: 10.1016/s0969-9961(02)00009-8. [DOI] [PubMed] [Google Scholar]
Associated Data
This section collects any data citations, data availability statements, or supplementary materials included in this article.