Abstract
It is well established that the cysteinate-coordinated [Fe4S4] cluster of the Fe-protein of nitrogenase from A. vinelandii (Av2) can attain the all-ferrous core oxidation state. Mössbauer and EPR studies have shown that the all-ferrous cluster has a ground state spin S = 4 and an effective 3:1 site symmetry in the spin structure and 57Fe quadrupole interactions. Recently Deng and Holm reported the synthesis of [Fe4S4(Pri2NHCMe2)4],2 1, (Pri2NHCMe2 = 1,3-diisopropyl-4,5-dimethylimidazol-2-ylidene) and showed that the all-ferrous carbene-coordinated cluster is amenable to physico–chemical studies. Mössbauer and EPR studies of 1, reported here, reveal that the electronic structure of this complex is strikingly similar to that of the protein-bound cluster, suggesting that the ground state spin and the 3:1 site ratio are consequences of spontaneous distortions of the cluster core. To gain insight into the origin of the peculiar ground state of the all-ferrous clusters in 1 and Av2, we have studied a theoretical model that is based on a Heisenberg–Dirac–Van Vleck Hamiltonian whose exchange-coupling constants are a function of the Fe–Fe distances. By combining the exchange energies with the elastic deformation energies in the harmonic approximation, we obtain for a T2 distortion a minimum with spin S = 4 and a C3v core structure in which one iron is unique and three irons are equivalent. This minimum has all the spectroscopic and structural characteristics of the all-ferrous clusters of 1 and Av2. Our analysis maps the unique spectroscopic iron site to a specific site in the X-ray structure of the [4Fe-4S]0 core both in complex 1 and in Av2.
1. Introduction
The recent syntheses and structural determinations of [Fe4S4(CN)4]4- 1 and the carbene-ligated cluster [Fe4S4(Pri2NHCMe2)4],2 1, complete the set of accessible cubane-type clusters having core oxidation levels [Fe4S4]z with charge z ranging from 0 to 3+.3 The cluster with z = 0 is of particular current interest because its all-ferrous core is isoelectronic with that present in the iron protein of A. vinelandii nitrogenase (called Fe-protein or Av2) when reduced with Ti(III) citrate.4-6 Furthermore, the synthetic cluster cores are nearly isostructural with the [Fe4S4]0 core of the fully reduced [Fe4S4(SCys)4] cluster of the iron protein.2,7 The carbene cluster, whose structure is depicted in Figure 1, is far more amenable to experimentation than the cyanide cluster because of its lesser tendency toward oxidation. The compound crystallizes in the monoclinic space group Cc; the cluster has the familiar cubane-type stereochemistry with no imposed symmetry and Fe–S bond lengths and other structural features consistent with the all-ferrous formulation.2
Figure 1.
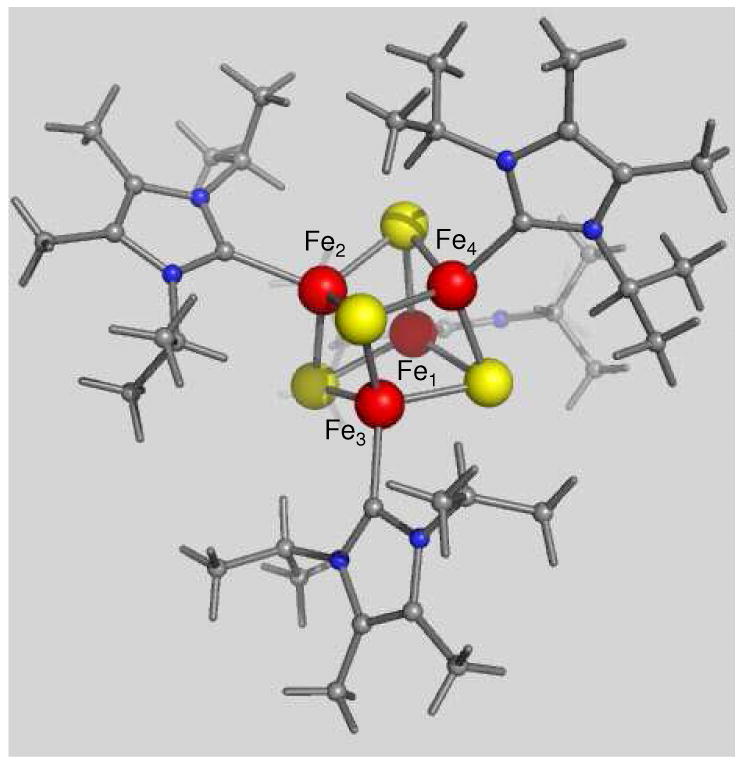
Structure of [Fe4S4(Pri2NHCMe2)4].2 Ranges and mean values (A) of core distances: Fe-S 2.291(1)-2.338(1), 2.33(2); Fe-Fe 2.603(1)-2.764(1), 2.68(6). The irons labeled Fe1, Fe2, Fe3, and Fe4 correspond with the irons Fe(1), Fe(3), Fe(4), and Fe(2) of ref 2.
For the all-ferrous [Fe4S4]0 cluster of Av2 a parallel mode EPR and Mössbauer spectroscopic study of the fully reduced native cluster demonstrated an effective 3:1 symmetry of iron sites that afford an S = 4 cluster ground state, rather than an S = 0 state as expected for a symmetric cubane core.6 This state is unique amongst protein-bound metal sites of any nuclearity, and thus raises the issue of the effect of protein structure and environment on stabilizing this state. The cluster is bound between two identical subunits of the Fe-protein and is potentially susceptible to the influence of both protein structure and solvent. Further attention is directed toward native cluster properties by the report of an [Fe4S4]0 cluster with a probable S = 4 state in the activator protein of a dehydratase,8 and the claim of an S = 0 all-ferrous cluster in the A. vinelandii Fe-protein when reduced with flavodoxin hydroquinone.9 A detailed EPR and Mössbauer analysis of the carbene cluster, presented here, revealed that 1 has an S = 4 ground state like the Av2 [Fe4S4]0 cluster. Moreover, the analysis indicates striking similarities between the 57Fe hyperfine parameters. Given that the two clusters have different external coordination, these findings suggested to us that the S = 4 ground state and the observed 3:1 site ratios reflect intrinsic properties of the cluster core rather than a perturbing influence of the environment. For small variations, the Fe–Fe distances, Δri,j, are linearly related to changes of the exchange-coupling constants, ΔJi,j. Using this correlation we have investigated the energy surfaces of the combined actions of elastic and exchange forces, finding that a global minimum is attained for a T2 mode acting in the S = 4 manifold that yields a 3:1 pattern of magnetic hyperfine interactions, as observed experimentally.
Elsewhere we have provided a perspective of the carbene cluster in relation to the protein-bound all-ferrous cluster.10
2. Materials and Methods
[Fe4S4(Pri2NHCMe2)4], 1, was prepared as described.2 To avoid orientation of the polycrystalline material in the Mössbauer spectrometer by the applied magnetic field, the sample was stirred into 0.3 mL Paraton-N oil before freezing. For EPR studies solid 1 was dissolved in toluene to yield a 7.9 mM solution.
Mössbauer spectra were collected with constant acceleration spectrometers, using two cryostats that allowed studies at 4.2 K in applied fields up to 8.0 T. Isomer shifts are quoted relative to Fe metal at 298 K. Spectra were analyzed with the WMOSS software package (WEB Research Co., Edina, MN). X-band EPR spectra were recorded at on a Bruker EMX spectrometer, using a Hewlett-Packard 5352B microwave frequency counter, the ER4102 ST cavity, and the Oxford Instruments ESR 900 Cryostat. Spectra were analyzed with the program SpinCount written by M. P. Hendrich at Carnegie Mellon University.
3. Results
3.1. Mössbauer studies of polycrystalline 1
We have studied a polycrystalline sample of all-ferrous 1 with Mössbauer spectroscopy between 2 K and 140 K in applied magnetic fields up to 8.0 T. An EPR study of the polycrystalline material was unsuccessful, for two reasons. First, the observed resonances were very broad and, second, at low temperatures the uniaxial electronic system led to partial alignment of crystallites by the applied field. We therefore decided to study the EPR spectra of 1 in toluene, a glassing solvent that produced well resolved spectra. We discuss the Mössbauer spectra first, using from EPR the information that 1 has an S = 4 ground state with zero-field splitting (ZFS) parameters D = −1.9 cm-1 and E/D ≈ 0.07. Figure 2 shows a series of 4.2 K spectra, recorded in applied field as indicated, and Figure 3 features a zero field and an 8.0 T spectrum, both recorded at 100 K.
Figure 2.
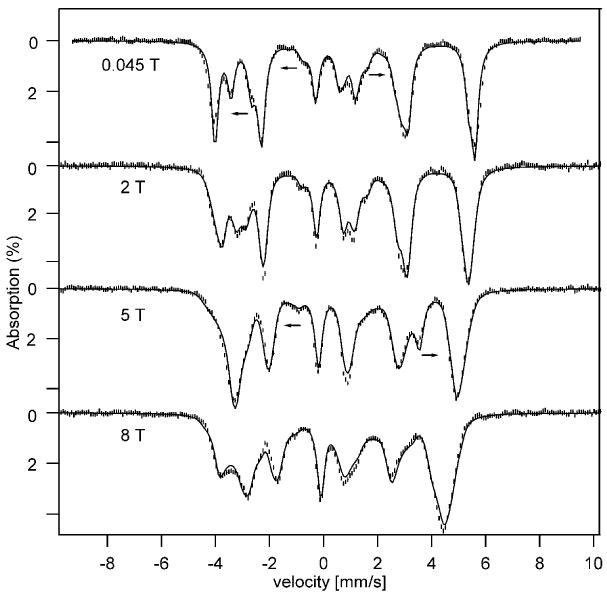
4.2 K Mössbauer spectra of complex 1 recorded in the parallel applied magnetic fields indicated. The solid lines are simulations using the parameters quoted in Table 1. The arrows indicate the line displacements of the unique site upon increasing the magnetic field.
Figure 3.
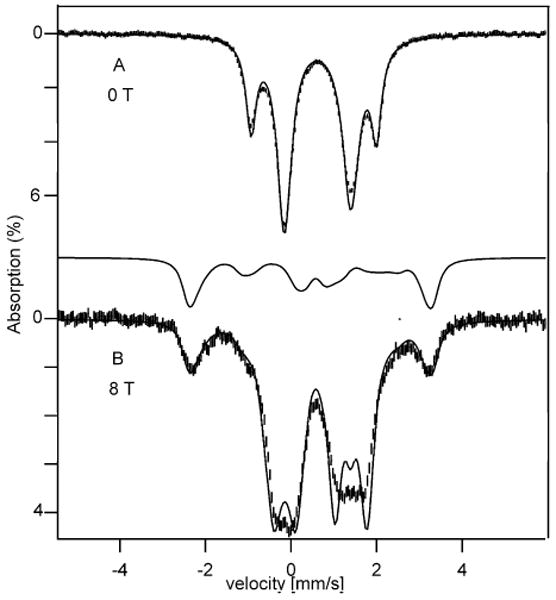
100 K Mössbauer spectra of complex 1 recorded in zero field (A) and an 8.0 T field applied parallel to the γ beam (B). The solid lines are simulations using the parameters quoted in Table 1.
The Mössbauer and EPR spectra were analyzed with the S = 4 spin Hamiltonian
| (1) |
| (2) |
| (3) |
| (4) |
where all the parameters have their conventional meaning. In eq 2 we have written the ZFS term in its principal axis system {x,y,z}, which we will use as our frame of reference. For our Mössbauer analysis we have used an isotropic g-tensor and set g = 2 (gz = 2.02 from EPR, see below). Complex 1 has C1 symmetry, implying that all tensors in eqs 1 - 4 may have different principal axis systems. In the following we discuss the main features of the Mössbauer spectra and indicate how the various parameters can be extracted.
The 4.2 K spectra of the four subsites of 1 exhibit simple 6-lines pattern. The intensities of the absorption lines did not depend on whether the applied 45 mT field was oriented parallel or perpendicular to the observed γ-radiation. This observation implies that the electronic ground state is magnetically uniaxial, i. e. the expectation value of the electron spin is non-zero only in one direction, implying that the axial parameter of the zero-field splitting tensor D is negative, D < 0. As shown in Fig. 4A and B, the same Mössbauer spectrum was observed for B = 0 and B = 45 mT. In general, the electronic levels of systems with integer electronic spin are singlets, unless degeneracies occur as a consequence of symmetry. In the absence of an applied magnetic field an electronic singlet does not yield a Mössbauer spectrum exhibiting magnetic hyperfine structure, in contrast to what is observed for 1. It follows that the spin ground state of 1 must be degenerate. It was shown in ref 11 that 57Fe magnetic hyperfine structure is observed for B = 0 if the splitting Δ of the MS = ±S levels (here MS = ± 4) fulfills the condition Δ < |Ai;z| where Ai;z is the component of the magnetic hyperfine tensor of site i along the z-axis of the ZFS tensor. Typically, A-values of [Fe4S4] clusters are of the order 10 MHz, implying that Δ has to be smaller than 10-3 cm-1. For an S = 4 system the splitting of the MS = ±4 doublet is given by Δ = 2.2 D(E/D)4 and thus the condition Δ < 10-3 cm-1 may often be fulfilled for E/D ≤ 0.1 as long as D is only a few wavenumbers.
Figure 4.
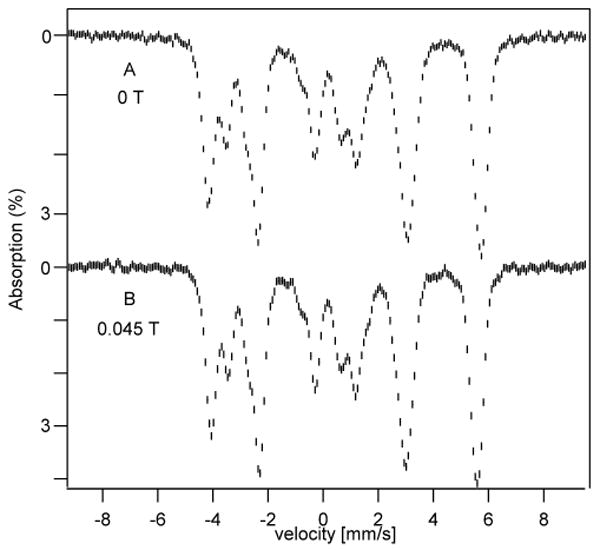
4.2 K Mössbauer spectra of complex 1 recorded in zero field (A) and an 0.045 T field applied parallel to the γ beam (B).
For small D values the MS = ±4 multiplet is readily magnetized along the z-axis, yielding for βB/|D| ≪ 1 a large disparity in the components of the spin expectation values of the ground state, <Sx> = <Sy> ≈ 0 and <Sz> = −4 (see Figure S1). The magnetic hyperfine field at the 57Fe nucleus can be written as12
| (5) |
For small applied fields Bint,i assumes a fixed orientation relative to the EFG tensor, described by the polar angles θi and φi. The low field spectra then depend on ΔEQ,i, ηi, Bint,i, θi and φi. It has been shown that there exists an infinite manifold of {ηi, θi, φi} values that yield identical Mössbauer spectra (This so-called ambiguity problem has been described in the literature, refs 13, 14). In strong applied magnetic fields, where <Sx> and <Sy> compete with <Sz>, and each set {ηi, θi, φi} may yield unique spectra. Thus, a parameter set that fits at low field may fail to do so at high field. The low temperature spectra of Figure 2 depend on as many as 50 parameters: namely D, E/D, together with four sets of {Ax′, Ay′, Az′, ΔEQ, η, δ, αA, βA, γA, αEFG, βEFG, γEFG}i. Here {x′, y′, z′} denotes the principal axis system of the A-tensor and αA, βA, γA are the Euler angles that rotate {x′, y′, z′} into the principal axis system {x, y, z} of the ZFS tensor, our system of reference; αEFG, βEFG, γEFG rotate the EFG tensor into {x, y, z}. All rotations are those used in WMOSS; note that WMOSS uses the “x”-convention for the Euler angles. D, E/D, ΔEQ, and δ are reasonably well determined from considerations given below. In the following we describe how the various parameters were determined.
At 4.2 K the electronic spin of 1 relaxes slowly on the time scale of Mössbauer spectroscopy (ca. 10 MHz). As the temperature is raised above 4.2 K the absorption features broaden in a way characteristic of intermediate relaxation rates. At T = 100 K the spin system is nearly in the fast relaxation limit, and consequently quadrupole doublets are observed. Figure 3A shows a zero field spectrum recorded at 100 K. This spectrum exhibits two doublets in a 3:1 intensity ratio, similar to what has been reported for the all-ferrous Av2 cluster. The most noteworthy differences between the two clusters are the smaller isomer shifts of 1, namely δ = 0.62 mm/s for sites 1-3 and δ = 0.54 mm/s for site 4 (ΔEQ,4 = 2.92 mm/s at 100 K). The quadrupole splittings of sites 1-3 are quite similar and not resolved, ΔEQ ≈ 1.5 - 1.6 mm/s, but distinctly smaller than that of site 4. The spectrum in Figure 3B was recorded in a parallel field of 8.0 T. Matching the splittings of the theoretical curves with the experimental data requires Bint,1,2,3 < 0 and Bint,4 > 0, suggesting that the local S = 2 spins of the four high-spin ferrous sites are coupled similarly as in the protein-bound cluster, namely the spins of sites 1, 2, and 3 are aligned parallel to the cluster spin and that of site 4 antiparallel.
Analysis of the spectra of Figure 2 shows that at 4.2 K only the MS = ±4 doublet is populated; for D = −1.9 cm-1 (see below) the MS = ±3 quasi-doublet is at energy E/kB ≈ 19 K. The quasi-degenerate ground state has geff = 16 and the system is essentially in the MS = − 4 level for B > 1 T. Inspection of the applied field spectra in Figure 2 shows that most absorption lines move towards the center with increasing applied fields, implying that they belong to sites with negative Bint while some, namely those belonging to site 4 (arrows), move outward and have Bint > 0. From the 100 K data it follows that the outward moving lines in Figure 3B belong to site 4. Outward and inward moving lines must belong to different iron sites. Figure 5 shows the 45 mT Mössbauer spectrum of Figure 4B together with the theoretical spectra of the subsites (the sum of these spectra is shown in Figure 2). We believe that this decomposition is essentially correct. In searching for a decomposition of the spectra we observed that two sites, 2 and 3, gave essentially identical spectra, and thus we have treated them henceforth as one site accounting for 50% of the spectral intensity.
Figure 5.
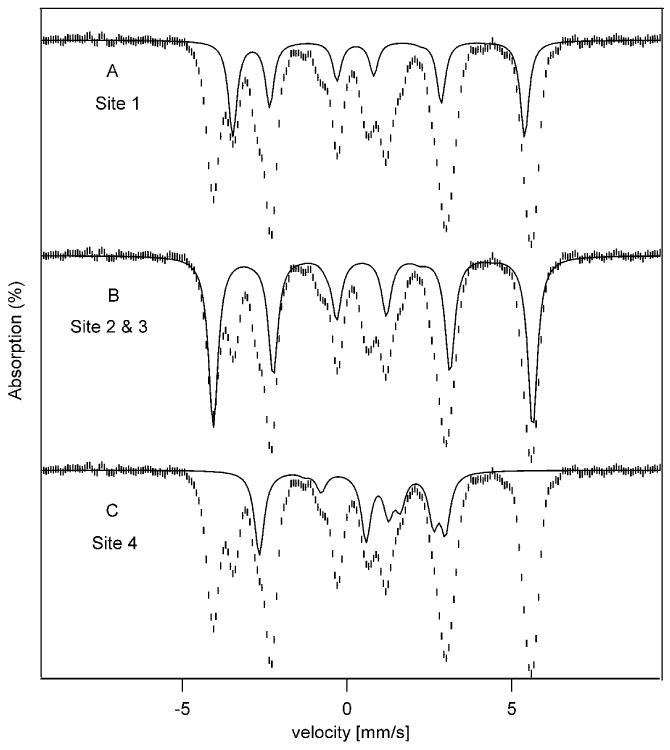
4.2 K Mössbauer spectrum of complex 1 recorded in 0.045 T parallel applied magnetic field (same as in Fig. 2). Solid lines drawn through the data show the contributions of site 1 (A), site 2 & 3 (B) and site 4 (C).
We mentioned above that the parameter set obtained at low applied fields is not unique. For 1 one has to apply fields larger than 5 T to induce sizable expectation values <Sx> and <Sy>. We have used the 8.0 T spectrum of Figure 2 for reducing the ambiguities of the low field spectra, using the following procedure. Starting with the parameters obtained at low field, we have least-squares fitted all spectra of Figure 2 as a group, allowing all parameters except D, E/D, ΔEQ, and δ to vary freely. This procedure produced a set of parameters (Table 1) that represented the set of spectra quite well. Interestingly, for this parameter set the A-tensors of sites 1 and 4 were found to be aligned with {x, y, z}, implying that, at low field, Bint,1 and Bint,4 are along the easy axis of magnetization, the z axis of eq 2. For sites 2, 3 the z′ axis of A2,3 is tilted by βA = 15 ° relative to the z axis.
Table 1.
| sitec | δd (mm/s) |
ΔEQd (mm/s) |
η | αefg (°) |
βefg (°) |
γefg (°) |
Ax (KG) |
Ay (KG) |
Az (KG) |
αA (°) |
βA (°) |
γA (°) |
|
|---|---|---|---|---|---|---|---|---|---|---|---|---|---|
| 1e | 1 | 0.61 | -1.6 | 0 | 0 | 90 | 0 | -74 | -65 | -66.5 | 0 | 0 | 0 |
| Av2 | 0.68 | -1.24 | 0.54 | 0 | 90 | 90 | -98 | -79 | -70 | 0 | 0 | 0 | |
| 2 & 3 | 1 | 0.62 | -1.5 | 0.1 | 0 | 105 | 0 | -98 | -57 | -70 | 0 | 15 | 0 |
| 2 | Av2 | 0.68 | -1.72 | 0 | 0 | 56.6 | 4.6 | -86 | -76 | -81 | 0 | 0 | 0 |
| 3 | Av2 | 0.68 | -1.48 | 0 | 0 | 92.3 | 0 | -100 | -73 | -73 | 0 | 0 | 0 |
| 4e | 1 | 0.54 | 2.96 | 0.59 | 0 | 90 | 90 | 7.7 | 57 | 29 | 0 | 0 | 0 |
| Av2 | 0.68 | 3.08 | 0.59 | 90 | 90 | 52.8 | 22 | 25 | 63 | 0 | 150 | 0 |
D = − 1.9 cm-1 and E/D = 0.07 was used for the simulation.
D = − 0.75 cm-1 and E/D = 0.33 was used for the simulation.
The Fe sites of the Av2 labeled 1, 2, 3 and 4 corresponds with the sites 4, 2, 3 and 1 in ref 6, respectively.
At 4.2 K.
For the site 1 and 4 of the Av2 the coordinate frame {x′, y′, z}′ was adopted to fulfill the convention 0 ≤ η ≤ 1.
We mentioned above that, at low field, there exists an infinite manifold of {ηi, θi, φi} values yielding the same Mössbauer spectrum (for sites 1 and 4 the polar angles θ and φ correspond to βEFG and γEFG; for sites 2, 3 they relate the EFG tensor to Bint,2,3). However, the ranges of these three parameters can often be narrowed considerably. In order to explore the allowed ranges, we have used the following procedure: We have taken the simulated spectra of Figure 2 and added random noise to treat them in WMOSS as an “experimental” spectrum. We have least-squares fitted these “experimental” spectra by fixing one of the three parameters and exploring whether a good fit could be obtained. The ranges of allowed {ηi, θi, φi} are indicated in Table S1.
The zero-field splitting parameters D and E/D differ substantially for the all-ferrous Av2 cluster and the synthetic model 1. The former has D = −0.7 cm-1 and E/D = 0.33 whereas 1 has D = −1.9 cm-1 and E/D = 0.07. The larger D value of 1 implies that the electronic levels are less mixed at 8.0 T, rendering the Mössbauer spectra less sensitive to components of the magnetic hyperfine tensors perpendicular to the electronic z axis. On the other hand, the spectra of the Av2 cluster are poorly resolved at high fields, a fact that severely limits the data analysis.
Using the parameters of Table 1 and assuming that the electronic system relaxes fast on the Mössbauer time scale, we have generated the theoretical curves of Figure 3B. Site 4 is well represented by these simulations. The simulation for sites 1-3 gives the right splitting but not quite the correct shape, probably because for these sites the spin system is only approximately near the fast fluctuation limit, a conclusion supported by the observation that the high-energy lines of doublets 1, 2 and 3 are broadened in the zero field spectrum of Figure 3A. We did not record an 8.0 T spectrum above 100 K because ΔEQ,4 decreased rapidly above 100 K, leading to a lack in resolution.
Finally, as the electron spin is in the slow fluctuation limit at 4.2 K, each populated electronic level will contribute its own Mössbauer spectrum. Our spectral simulations give no evidence for the presence of spectral components originating from the MS = ± 3 levels, yielding |D| > 1.6 cm-1, consistent with the EPR data obtained in toluene, D = −1.9 cm-1.
3.2. EPR studies
We have studied parallel-mode X-band EPR spectra of 1 dissolved in toluene between 2 K and 50 K. Two spectra are shown in Figure 6. The 8 K spectrum exhibits a resonance near geff = 12, which originates from an excited state, as the intensity of this feature declines upon lowering the temperature and nearly disappears at 2 K. At 2 K a sharp resonance, belonging to the ground state, is observed at geff = 16.08. We assign these resonances to an S = 4 system with D < 0. Thus, the geff = 16.08 features originates from the MS = ±4 ground doublet whereas the geff = 12 feature reflects a transition between the MS = ± 3 levels. As discussed for the S = 4 system of the all-ferrous cluster of the nitrogenase Fe-protein,6 the energy separation for each quasi-doublet is predicted from eq 2 to be
Figure 6.
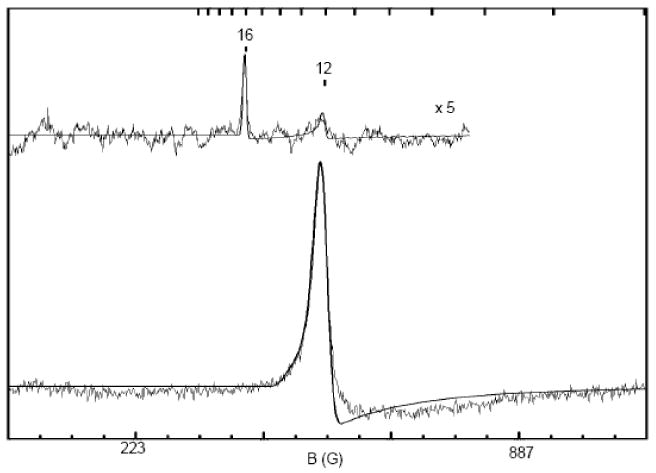
X band parallel mode EPR spectra of complex 1 recorded at 2 K (top) and 8 K (bottom). Conditions: Frequency 9.27 GHz; microwave power 2 mW (top) and 0.2 mW (bottom); modulation 0.3 mT (top) and 1 mT (bottom). The solid lines drawn through the data are simulations, using SpinCount, for an S = 4 system with D = −1.9 cm-1, E/D = 0.07 cm-1, σE/D = 0.03, gx = gy = 2 and gz = 2.015.
| (6) |
where Δ is the zero-field splitting of the doublet. From the Mössbauer analysis of 1 we know that Δg = 2.2 |D| (E/D)4 < 10-3 cm-1 for the MS = ±4 ground doublet, and thus δE = 2βgeffBz. For this quasi-doublet geff = 2Sgz, yielding gz = 2.015 (gz is defined in eq 2). With the Mössbauer estimate D ≈ −2 cm-1, it follows that E/D < 0.12.
The solid lines in Figure 6 are spectral simulations performed with SpinCount, using the parameters quoted in the caption. The line shape of the geff ≈ 12 feature was simulated by assuming that E/D has a Gaussian distribution with (E/D)avg = 0.07 and σE/D = 0.03. Although the spectral shape is reasonably well represented by the simulations, there are small discrepancies, indicating perhaps that the assumption of a Gaussian distribution for E/D is only approximately correct.
We have studied the geff = 12 resonance over a wide range of temperatures. This feature maximizes near T = 12 - 14 K and broadens steadily as the temperature is increased. By using the amplitude of the geff = 12 feature between 10 K and 25 K and fitting with variable packet linewidth (1 mT - 2 mT), we obtained D = −1.9 ±0.3 cm-1. We also found that we get a good estimate for D and E/D by noting that the intensity of the geff = 12 resonance is proportional to D(E/D)6. Thus, for E/D = 0.07 and D = 1.9 cm-1 we obtain a good amplitude match by assuming a concentration of 7.5 mM of 1, which compares well with the actual concentration of 7.9 mM.
3.3. Comparison of Mössbauer spectra of complex 1 with those of all-ferrous Av2
There are interesting spectroscopic similarities between the Mössbauer spectra of the all-ferrous cluster of Av2 and the carbene-coordinated model complex (Figure 7). Both systems have a ground state with cluster spin S = 4. It is instructive to compare the 4.2 K Mössbauer spectra of complex 1 with the 1.5 K spectra of the protein observed in weak applied magnetic fields. Given that D is larger in 1, we can use for this complex a higher temperarure without noticeably populating excited doublets. For this purpose we present the theoretical spectra. Not only do these represent the experimental data quite well, they can easily be manipulated to facilitate comparison of the relevant features. Thus, the lower isomer shifts of 1 compared to Av2, by ∼0.08 mm/s, are consistent with the poorer electron donation of the terminal carbene ligands to the iron sites compared to the cysteine sulfurs. All Fe sites of the Av2 cluster have δ = 0.68 mm/s at 4.2 K, and therefore we have set, for the sake of comparison, the isomeric shift for each iron site of 1 equal to 0.68 mm/s. There is a subtle point that should be mentioned: since Δg < 10-3 cm-1 for 1 and 30 · 10-3 cm-1 for the Av2 cluster,6 one needs a field of at least B = 0.15 T to fulfill the condition geffβB ≫ Δg to obtain fully developed magnetic spectra in both the systems (Figure 7). Thus we have simulated the spectra of Figure 7 for B = 0.15 T.
Figure 7.
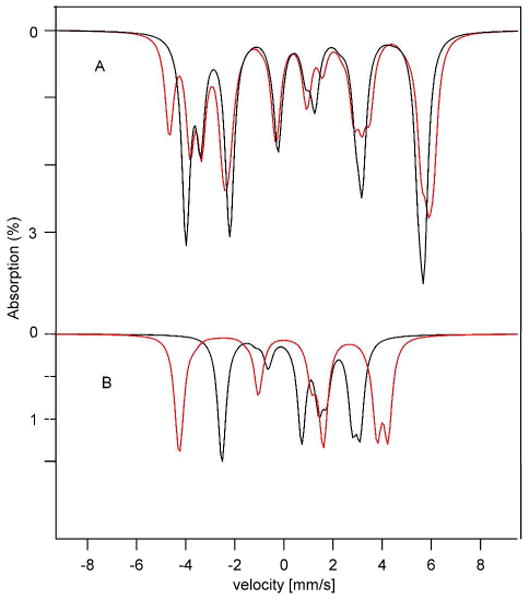
(A) Simulated Mössbauer spectra (sum of sites 1-3) at 1.5 K, 0.045 T for the Av2 protein (red line) and at 4.2 K, 0.045 T complex 1 (black line). (B) Simulated Mössbauer spectra of site 4 at 1.5 K, 0.045 T for the Av2 protein (red line) and at 4.2 K, 0.045 T complex 1 (black line).
Figure 7A shows that the spectra of sites 1, 2, and 3 are strikingly similar, the major difference being that the spectral sites 2 and 3 of the carbene model are indistinguishable whereas those of the Av2 cluster are slightly nonequivalent. In contrast, the spectra of site 4 exhibit quite different magnetic splittings (Figure 7B). We wondered whether the Av2 spectra would admit a solution with substantially different A-values for site 4. However, reexamination of the spectra confirmed that the assignments of Yoo et al.6 are essentially correct. It should be noted that the principal values of A4 do not differ by much in the two systems; however, the tensors are differently oriented relative to the easy axis of magnetization, z.
4. Theoretical model for the all-ferrous cluster
4.1. Formulation of model
The following analysis rests on the assumption that the exchange interactions between the paramagnetic iron sites of the all-ferrous cluster are described by the Heisenberg– Dirac–Van Vleck Hamiltonian
| (7) |
where the Ŝi are the spin operators of the high-spin ferrous iron sites of the cluster (Si = 2, i = 1 – 4) and Jij are the exchange-coupling constants between them. In general, including the case that the exchange-coupling constants have different values, the eigenstates of eq 7 are eigenfunctions of the square of the total spin operator, Ŝ2, with . For Td symmetry of the cluster all exchange-coupling constants are equal, Jij = J°, and the energies for each value of the total spin are degenerate and given by (see Table 2)
Table 2.
Spin quantum numbers, numbers of spin multiplets, spin state energies, and relative energies for all-ferrous cluster with six equal exchange-coupling constants between the four irons
| S | # multiplets | E°(S)/J° | [E°(S) − E°(0)]/J° |
|---|---|---|---|
| 0 | 5 | −12 | 0 |
| 1 | 12 | −11 | 1 |
| 2 | 16 | −9 | 3 |
| 3 | 17 | −6 | 6 |
| 4 | 15 | −2 | 10 |
| 5 | 10 | 3 | 15 |
| 6 | 6 | 9 | 21 |
| 7 | 3 | 16 | 28 |
| 8 | 1 | 24 | 36 |
| (8) |
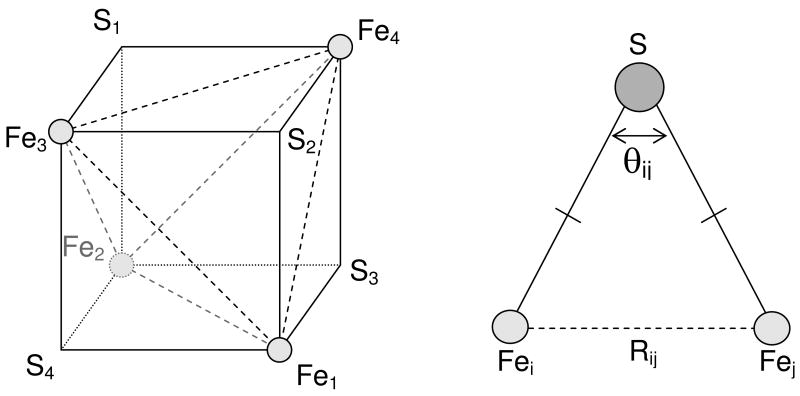
Exchange-coupling constants are known to be sensitive functions of structure, in particular of bridging bond angles and associated metal–metal distances, Jij = J(Rij) (θij and Rij in Figure 8).15 Small variations in the distances, Rij = R° + ΔRij, yield linear changes in the exchange-coupling constants
Figure 8.
(left) Schematic representation of the core of an iron–sulfur cluster, showing the labeling of the core atoms and the six iron-iron distances considered in the theoretical model. The sulfur atoms are located outside the cube spanned by the irons. (right) One of the iron–sulfur–iron bridges in the cluster, showing an iron–iron distance and the related bond angle.
| (9) |
where J(R°) = J° is the exchange-coupling constant for the undistorted cluster. The elastic deformation energies can be expressed as
| (10) |
K is a force constant for stretching the iron–iron distances. These distances stand in linear relation with the variations in the exchange-coupling constant (eq 9), allowing us to express the elastic energy as in the third term of eq 10, using the pseudo force constant k.
| (11) |
Combining the exchange and elastic energies yields the Hamiltonian
| (12a) |
By introducing the dimensionless parameters δJij = ΔJij/J° and κ = J°k, eq 12a can also be written as
| (12b) |
The space spanned by the six variables δJij can be decomposed into irreducible representations of the Td group, A1 {a1} + E {eε, eθ} + T2 {t1, t2, t3}. The basis vectors (in curly brackets) are given by the combinations
| (13) |
| (14a) |
| (14b) |
| (15a) |
| (15b) |
| (15c) |
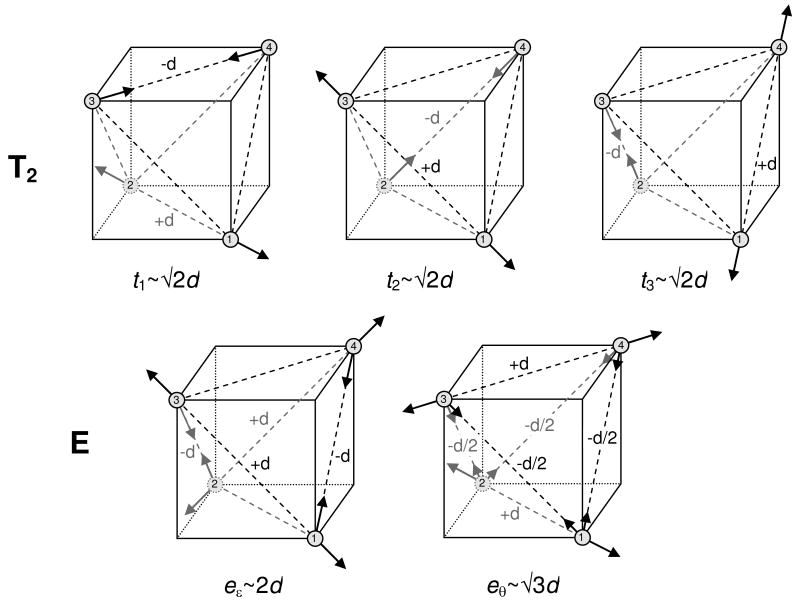
The symmetry breaking T2 and E distortions are illustrated in Figure 9. We have determined the eigenvalues and corresponding eigenstates of eq 12b by numerical diagonalization and studied the lowest of the resulting energies as a function of the distortion coordinates for each allowed value S. The resulting potential energy surfaces for S = 0 in the E space and S = 4 in a two-dimensional section of the T2 space are shown in Figure 10. Both the E and T2 modes are Jahn–Teller active in the S = 1, 2, …, 7 spaces. The space of maximum spin, S = 8, is inactive with respect to both the E and T2 distortions, and the S = 0 space exhibits only E distortions. The minima for a given distortion symmetry are degenerate, three-fold for E and four-fold for T2. Depending on their relative energies, these minima are either global or local minima of the potential energy surfaces defined in the six dimensional distortion space. The minima correspond to core structures with symmetry lower than Td. The symmetry breaking is spontaneous and results from first-order interactions between the degenerate states of given spin S that are generated by changes in the exchange parameters induced by geometrical distortions of the cluster. In the following two sections we discuss the structures, spin states, and energies at the minima of the potential energy surfaces for T2 and E.
Figure 9.
Symmetrized distortion coordinates of T2 and E symmetry, defined in eqs 14, 15, describing the changes in the iron–iron distances. The iron positions have been superimposed on a cube for visual guidance.
Figure 10.
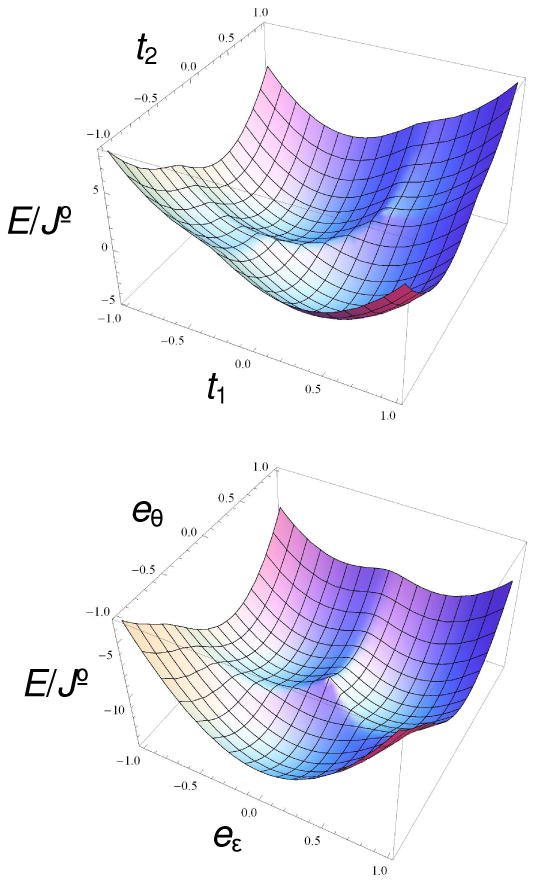
(top) Two-dimensional section at t3 = −13√2/60 ≈ 0.3064 of the potential energy surface of the cluster for S = 4 and κT = 10 defined on the three-dimensional T2 space, containing two of the four degenerate minima (see also Figure 11, left). (bottom) Potential energy surface of the cluster for S = 0 and κE = 10 defined on the two-dimensional E space, showing three degenerate minima (see also Figure 11, right).
4.2. T2 distortions
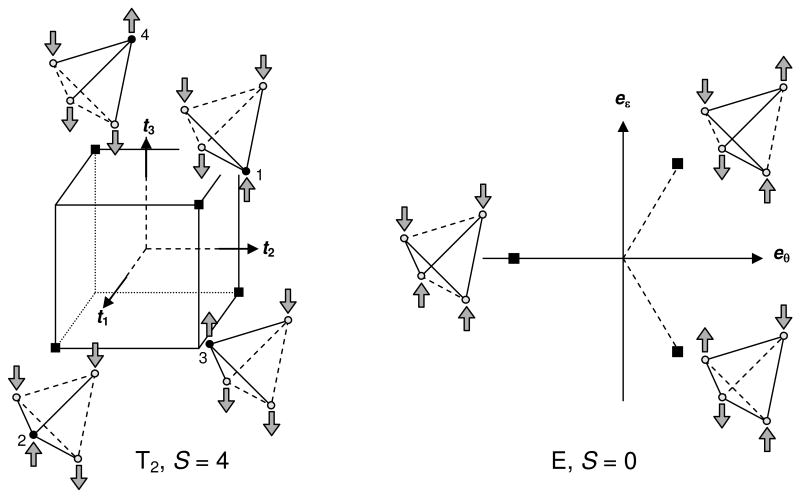
The four degenerate minima of the potential energy surface for the ground state in the T2 space are located at the vertices of a equilateral tetrahedron (Figure 11, left). The symmetry of the cluster at the minima is C3v. The three-fold axis runs through one of the four irons (called here the unique site); the remaining three sites are interchangeable by the C3 operation. The six exchange-coupling constants at the T2 minima are partitioned in two sets of three. For example, in the minimum for which Fe4 is the unique site, there are two exchange-coupling constants, namely J = J14 = J24 = J34 and J′ = J12 = J13 = J23 with J′ < J. The latter three coupling constants provide strong antiferromagnetic interactions between the unique site and the other three sites, which among themselves are coupled by weaker antiferromagnetic exchange or, perhaps, even by ferromagnetic exchange-coupling constants.15 For S = 4, these exchange interactions yield a spin state in which the spins of the three equivalent sites are aligned antiparallel to the spin of the unique site, as observed experimentally. The spin ordering for each minimum is shown in Figure 11. Thus, for the S = 4 state, our theoretical model correctly predicts the 3:1 ratio as well as the ordering of the iron spins, resulting from spontaneous symmetry breaking. The energies and states at the minima can be expressed analytically for any value of S. Let us consider the case for which Fe4 is the unique site. For J14 = J24 = J34 = J and J12 = J13 = J23 = J′ the spin Hamiltonian in eq 7 can be diagonalized by first coupling the spins of the three equivalent sites to composite spin S123 (Ŝ123 = Ŝ1 + Ŝ2 +Ŝ3), followed by a coupling of S123 to spin S4 of the unique site to give total spin S. The spin quantum numbers fulfill the following triangular inequalities: |S1 − S2| ≤ S12 ≤ S1 + S2, |S12 − S3| ≤ S123 ≤ S12 + S3, and |S123 − S4| ≤ S ≤ S123 + S4. As an example, we have listed in Table 3 the allowed values for S123 for S = 4, together with the number of multiplets for each value.
Figure 11.
(left) Schematic representation of the positions of the four degenerate energy minima (black squares) of the potential energy surface for the cluster in the three-dimensional T2 space. The cube containing the equilateral tetrahedron with the locations of the minima has been indicated. The spin ordering of the irons for S = 4 is shown for each minimum. The solid and dashed lines in each cartoon connect iron pairs for which the exchange interactions are increased and decreased, respectively, as a result of the distortion. The unique site for each minimum has been indicated by a filled circle. (right) Schematic representation of the positions of the three degenerate energy minima (black squares) of the potential energy surface for the cluster in the two-dimensional E space. The minima are located on the vertices of an equilateral triangle. The spin ordering of the irons for S = 0 has been shown for each minimum. The solid and dashed lines in each cartoon connect iron pairs in which the exchange-coupling constants are increased and decreased, respectively, as a result of the distortion.
Table 3.
Subcluster spins in S = 4 states
| S | S12 | S123 | # multiplets |
|---|---|---|---|
| 4 | 0 – 4 | 2 | 5 |
| 4 | 1 – 4 | 3 | 4 |
| 4 | 2 – 4 | 4 | 3 |
| 4 | 3, 4 | 5 | 2 |
| 4 | 4 | 6 | 1 |
By using J and J′ in eq 7 we obtain for the eigenstates the exchange energy
| (16) |
Substitution of J = J° + ΔJ and J′ = J° − ΔJ into eq 16 and addition of the elastic energies for the six Fe–Fe pairs then yield the total energy
| (17) |
Given that the S123 (S123 + 1) term has a negative sign, the lowest energy is attained for maximum value of S123 that is allowed for the given value of S ( , see Table 4).
Table 4.
Size and energy of T2 distortiona
| S | 12 κT | 48 κT ΔET (S)/J° | ||
|---|---|---|---|---|
| 0 | 2 | 0 | 0 | |
| 1 | 3 | 5 | −50 | |
| 2 | 4 | 11 | −242 | |
| 3 | 5 | 18 | −648 | |
| 4 | 6 | 26 | −1352 | |
| 5 | 6 | 21 | −882 | |
| 6 | 6 | 15 | −450 | |
| 7 | 6 | 8 | −128 | |
| 8 | 6 | 0 | 0 |
The values listed for follow from the triangular inequalities for the coupling of S123 (0 ≤ S123 ≤ 6) and S4 to resultant spin S: |S123 − S4| ≤ S ≤ S123 + S4.
The energy minimum of ET(S, , δJ) as a function of δJ is obtained for
| (18) |
The values of the numerator of eq 18 are listed as a function of S in the third column of Table 4. The corresponding minimum in T2 space is located at . The expression for the energy at the minimum is obtained by substitution of eq 18 into eq 17
| (19) |
In the third part of eq 19, the energy is expressed as the sum of the exchange energy of the undistorted cluster (eq 8) and a distortion-related energy
| (20a) |
In units of J°, the energy in eq 20a can be expressed as
| (20b) |
The values of the numerator of the energy in eq 20b are listed as a function of S in the fourth column of Table 4. While S = 0 and S = 8 are T2 inactive, the largest activity for this mode is found for S = 4, which allows this state to become the ground state (see below). In our treatment the spin ordering of the T2 minimum for S = 4 is a consequence of the theoretical model and is not imposed as in the pioneering broken-symmetry DFT calculations for MS = 4 state of the all-ferrous cluster by Torres et al.16 Our results differ further in that the structure of the Fe–S core is predicted to have a three-fold axis while this symmetry is absent in the DFT optimized structure.
4.3 E distortion
The three degenerate minima of the potential energy surface for the ground state in the E space are located at the vertices of an equilateral triangle (Figure 11, right). The symmetry of the cluster at the minima is D2d. The six exchange-coupling constants at the E minima are partitioned in two sets. For example, J13 = J14 = J23 = J24 = J and J12 = J34 = J′ with J > J′ at the minimum on the eθ axis. The latter two coupling constants provide weaker antiferromagnetic interactions (or ferromagnetic) interactions inside two disjoint pairs and stronger antiferromagnetic interactions between the two pairs. The Hamiltonian in eq 7 can be diagonalized analytically by first coupling the spins of the disjoint pairs to give pairs with spin S12 and S34 (Ŝ12 = Ŝ1 +Ŝ2 and Ŝ34 = Ŝ3 +Ŝ4), followed by a coupling of the pair spins to give resultant spin S. The spin quantum numbers fulfill the following triangular inequalities: |S1 − S2| ≤ S12 ≤ S1 + S2, |S3 − S4| ≤ S34 ≤ S3 + S4, and |S12 − S34| ≤ S ≤ S12 + S34. The energies of the eigenstates of eq 7 can be written as
| (21) |
Substitution of and J′ = J° − ΔJ into eq 21 and addition of the elastic energies for the six Fe–Fe pairs gives for the total energy the expression
| (22a) |
For any value of S, the lowest energy is obtained for the maximum value of the intermediate spins, S12 = S34 = 4. Substitution of these values into eq 22a yields eq 22b
| (22b) |
The energy minimum of EE (S, δJ) is obtained at
| (23) |
The corresponding minimum in E space is located at and δeε = 0. The expression for the energy at the minimum is obtained by substitution of eq 23 into eq 22b
| (24) |
where we have used the definition
| (25a) |
In units of J°, the energy in eq 25a can be expressed as
| (25b) |
The values of the numerators of eqs 23 and 25b have been listed as a function of S in Table 5. The E activity is largest for S = 0, decreases with increasing values of the spin, and eventually vanishes for S = 8. A comparison of Tables 4 and 5 shows that and κT ΔET (S) = 2 κE ΔEE (S) for S > 3.
Table 5.
Size and energy of E distortion
| S | 12 κE | 48 κE ΔEE (S)/J° |
|---|---|---|
| 0 | 36 | −1296 |
| 1 | 35 | −1225 |
| 2 | 33 | −1089 |
| 3 | 30 | −900 |
| 4 | 26 | −676 |
| 5 | 21 | −441 |
| 6 | 15 | −225 |
| 7 | 8 | −64 |
| 8 | 0 | 0 |
4.4. Relative energies of minima
In this section we analyze the relative energies of the T2 and E minima for the nine spin states of the all-ferrous cluster.17 In particular, we present for each value of S the condition for which the T2 minimum is below the E minimum, the conditions for the level crossings between the T2 minimum for S = 4 and the T2 minima for S < 4, and finally the condition for which the T2 minimum for S = 4 is the absolute minimum. The T2 minimum for spin S is lower in energy than the E minimum for the same value of the spin provided |ΔET (S)| > |ΔEE (S)|. The inequality implies that the force constants for T2 and E satisfy the condition κT/κE < qS, with qS being the value given in Table 6. Since S = 0 is T2 inactive, the E minimum is lowest for any finite value of κE. For S = 1 to 4 the condition is fulfilled for increasingly larger values for κT/κE (N.B. In general, a large force constant implies a small distortion (energy). Thus, a higher qS value signifies an increased propensity for the T2 minimum to be lowest.)
Table 6.
Condition κT / κE < qS for which T2 minimum is below E minimum for given value of S
E minimum is below T2 minimum for any positive value of κE.
Decimal representation of ratio.
Jahn–Teller inactive in both T2 and E spaces.
Above we mentioned that the largest T2 stabilization energy, |ΔET (S)|, is attained for S = 4 (Table 4). In the limit κT → ∞, where the distortion energies vanish for all values of S, the S = 4 energy is greater than the energies for S = 0 − 3 (eq 8). By lowering the value for κT, the energy of the T2 minimum for S = 4 energy drops relative to those for the other spin states and consecutively crosses the energies of the T2 minima for S = 3, 2, 1, and 0 at the values κT = pS listed in Table 7. We note that the pS values are an increasing function of S. Thus, if the condition for the crossing with S = 0 (κT < 2.817, Table 7) is fulfilled, then the T2 minimum for S = 4 has the lowest energy of all T2 minima. The crossing with S = 0 considered here is with an undistorted level as S = 0 is T2 inactive (Table 4).
Table 7.
Conditions κT < pS for which the T2 minimum for S = 4 is lower in energy than the T2 minimum for S = 0, 1, 2, and 3.
| S | pS | |
|---|---|---|
| 0 | 169/60 | 2.817 a |
| 1 | 217/72 | 3.014 |
| 2 | 185/56 | 3.304 |
| 3 | 11/3 | 3.666 |
Decimal representation of ratio.
Since the exchange energy of the unperturbed cluster, E°(S), and the E stabilization energy, |ΔEE (S)|, are increasing and decreasing functions of spin quantum number S, respectively (Table 5), the energy at the E minima, , is an increasing function of S. Thus, the E minimum for S = 0 is among the E minima the lowest in energy for any value for κE. Hence, the T2 minimum for S = 4 is lower in energy than any of the E minima, provided . The latter condition implies an inequality for the ratio of the force constants for the T and E distortions,
| (26) |
In the limit κE → ∞ (where the E distortion for S = 0 vanishes) the condition reduces to the condition κT < pS=0 which ascertains that the T2 minimum for S = 4 is lower in energy than the one for S = 0 (Table 7). Having established that the T2 minimum for S = 4 is lower in energy than (i) all E minima and (ii) all T2 minima for S ≠ 4, it follows that eq 26 is the condition which ensures that the T2 minimum for S = 4 is the absolute energy minimum of the all-ferrous cluster. Finally, it can be shown that if the absolute minimum is a T2 minimum, then it must be the T2 minimum for S = 4. Thus, the absolute minimum is either the T2 minimum for S = 4 or the E minimum for S = 0. The latter minimum is the absolute minimum if the condition in eq 26 is violated. The origin of the differences in the force constants required for the stabilization of the T2 minimum is the subject of a separate study.
These conditions described in this section have a number of corollaries:
The largest value of κT/κE for which the T2 minimum for S = 4 is the ground state is 169/162 ≈ 1.04. Thus, κT must typically be smaller than κE (κE ≈ 1.04 κE > κT) to obtain an S = 4 ground state. Thus, under this condition the electronic state at the absolute energy minima is similar to the “3:1”, S = 4 state inferred from spectroscopic analysis of the all-ferrous clusters in complex 1 and Av2.
For κT/κE = 1, eq 26 implies κT < 7/60 and ΔJ > 130/7 J°. Thus, in the case of equal force constants, the force constant for T2 must be small and the change in J very large in order to obtain an S = 4 ground state.
To obtain a T2 minimum for S = 4 with vanishing coupling constants between the three equivalent sites (J′ = 0) requires that . This condition and the expression (Table 4) yield the value κT = 13/6 ≈ 2.167. Substitution in eq 26 yields the condition κE > 9 for ensuring that the T2 minimum for S = 4 is the absolute minimum. For J′ > 0 (J′ antiferromagnetic) the T2 minimum for S = 4 is the absolute minimum if 13/6 < κT < 169/60 and ; the limiting value for κE varies as a function of κT in the range . For J′ < 0 (J′ ferromagnetic) the T2 minimum for S = 4 is the absolute minimum if κT < 13/6 and ; the limiting value for κE varies as a function of κT in the range .
The upper limit of κT (169/60, eq 26) and lower limit for (13/6 / κT = 10/13) for which the T2 minimum for S = 4 remains the absolute minimum are reached in the limiting case κE → ∞. For these values we obtain the largest possible value for J° ≈ 0.231 J° consistent with an absolute T2 minimum of S = 4. In this limit, we find that J° ≈ 1.769 J° and J′/J = 3/23 ≈ 0.13. Smaller values for the J′/J ratio, including negative values arising from ferromagnetic J′ values, are found away from the limit.
5. Application of theoretical model to all-ferrous clusters
5.1 Unique sites in the all-ferrous clusters of complex 1 and Fe-protein
Given certain core-specific conditions on the force constants, we identified in the previous section a “3:1”, S = 4 state as the ground state of the all-ferrous cluster on the basis of a theoretical analysis that completely ignores external perturbations and exclusively focuses on the [4Fe–4S]0 core. The intrinsic (core-specific) nature of this solution suggests why the same ground state is present in both complex 1 and the protein-bound all-ferrous cluster of Av2, in spite of significant differences in their terminal coordination. Thus, the present study strongly suggests that the “3:1”, S = 4 ground state of the all-ferrous Av2 cluster is not imposed on the cluster by changes in the exchange-coupling constants induced by the protein environment, as suggested in an earlier study,8 but is an intrinsic property of the cluster core. The magneto–structural correlation between J and the metal–ligand–metal angle, notably the increase in the value for J as a function of this angle, frequently observed in series of structurally related transition metal complexes,15 suggests that the antiferromagnetic couplings in the Fe–S–Fe bridges of the all-ferrous cluster become larger when the bond angles are increased. Thus, we predict that the angles Fei–Sk–Fej the angles for i = 1, 2, 3 and j = 4 (i.e., for bridges between one of the equivalent sites and the unique site) are larger than for i, j = 1, 2, 3 (i.e., for bridges between the three equivalent iron sites). The prediction is confirmed by the data for these angles listed in Table 8. Indeed, in both the protein-bound cluster and complex 1, the former angles are > 70° with an average 71.9° and the latter angles are < 70° with an average of 67.8°. The remarkable agreement in the angular values for the two clusters (see Table 8) corroborates the intrinsic (core-based) nature of the forces shaping the core conformation. In the labeling adopted in Table 8, the unique site is designated as Fe4 both in complex 1 and the all-ferrous cluster of the Fe-protein. The unique site (Fe4 in our numbering) appears in PDB file 1G1M,7 containing the structure of the all-ferrous Fe-protein of A. vinelandii, as iron site Fe(3), which is one of the two solvent exposed irons of the cluster. A complete correspondence list is given in footnote b of Table 8. The Fe–Fe distances show the same trend as the bond angles (see Table S2), with the Fe4-Fei (i = 1–3) distances being on the average 0.15 / 0.10 Å (Fe-protein / complex 1) shorter than the Fei–Fej (i, j = 1–3) distances. Concomitantly, the diagonal distances for the unique sites, Fe4–S4 = 4.090 / 4.059 Å (Fe-protein / complex 1) are 0.24 / 0.17 Å longer than the Fei–Si (i = 1–3) distances for the three equivalent sites <Fei–Si>avg = 3.853 / 3.866 Å. Thus, we have succeeded to assign the unique spectroscopic iron site, identified in the all-ferrous Fe-protein by Yoo et al.,6 to a specific structural site in the crystallographic structure of the cluster (Figure 12). Similarly, we have identified the unique site in the Mössbauer spectra of complex 1 (Figures 3, 5) to site Fe4 in its structure (Figure 1).
Table 8.
Fe-S-Fe bond angles in all-ferrous clusters in Av2 and complex 1
| FeiSkFej (°) a,b | ||
|---|---|---|
| i, k, j | protein | complex 1 |
| 1,2,4 | 74.0 | 71.9 |
| 1,3,4 | 73.7 | 71.2 |
| 2,1,4 | 70.8 | 71.2 |
| 2,3,4 | 70.5 | 71.3 |
| 3,1,4 | 70.7 | 73.2 |
| 3,2,4 | 70.7 | 73.4 |
| av. | 71.7 | 72.0 |
| 1,3,2 | 66.8 | 68.0 |
| 1,4,2 | 66.9 | 67.3 |
| 1,2,3 | 69.9 | 69.8 |
| 1,4,3 | 68.5 | 70.0 |
| 2,1,3 | 65.7 | 68.0 |
| 2,4,3 | 64.5 | 67.5 |
| av. | 67.1 | 68.4 |
The sulfur atoms carry the same labels as the diagonally opposite irons (Figure 8).
The sites here labeled Fe1, Fe2, Fe3, Fe4 correspond with Fe(1), Fe(4), Fe(2), Fe(3) in the PDB file 1G1M containing the structure of the all-ferrous Fe-protein of A. vinelandii and with Fe(1), Fe(3), Fe(4), Fe(2) of complex 1 in the labeling of ref 2, respectively.
Figure 12.
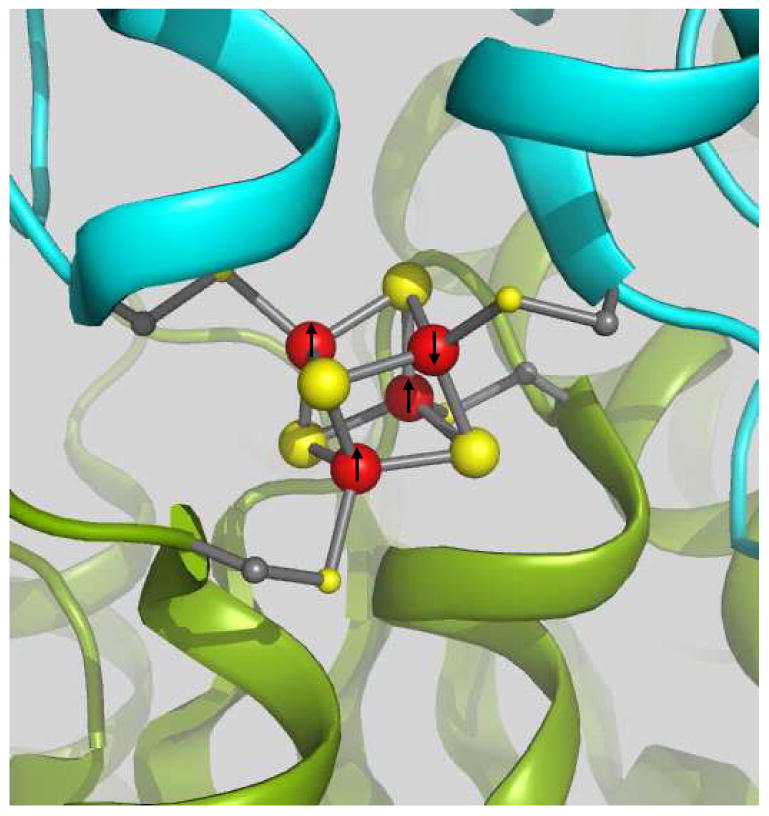
Segment of the all-ferrous Fe-protein (PDB code 1G1M) viewed from the solvent exposed face of the [Fe4S4]0 cluster. Color code: subunit A (blue ribbon), subunit B (green ribbon), irons (red spheres) and sulfurs (yellow spheres). The front iron atom connected to subunit A is labeled Fe(3) in the PDB file and Fe4 in our discussion and is the iron site that has been identified as the unique spectroscopic site of the cluster in this work. The front iron atom connected to subunit B is labeled Fe(1) in the PDB file and Fe1 in our discussion. The ordering of the iron spins in the S = 4 state of the all-ferrous cluster is indicated by arrows; the arrow at the unique site points downward; the arrows of the “equivalent” sites point upward.
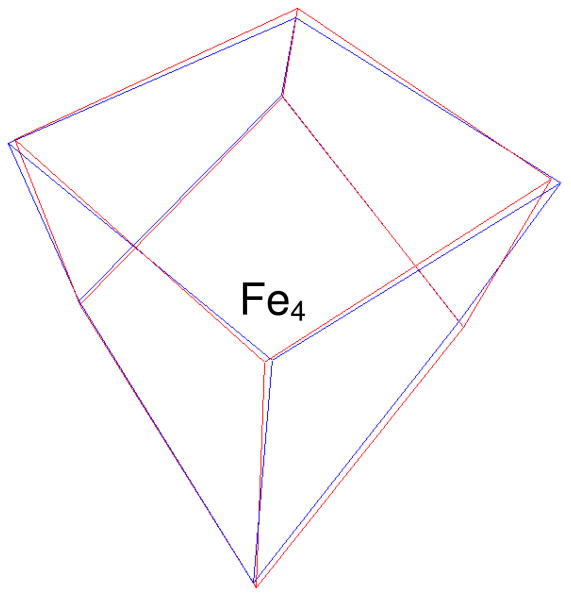
The unique sites in the all-ferrous clusters of complex 1 and Fe-protein can also be identified by comparing the cluster cores in these systems. Table 9 presents a list containing all 12 possible overlays of the two cluster cores together with the resulting RMSDs for Fe-only as well as 4Fe–4S based minimizations. Using our atom labeling, mappings that assign site Fe4 of the Fe-protein cluster to site Fe4 of complex 1 give consistently the lowest three RMSDs (indicated in bold face), confirming that Fe4 is the unique site in both systems. Accordingly, interchanges of the equivalent sites, Fe1, Fe2, and Fe3, obtained by applying the pseudo C3 symmetry operator, produce only minor changes in the RMSDs. The first overlay of Table 9 (case 1) is shown in Figure 13 and reveals a remarkable degree of congruence between the two cluster cores. Given the rather low resolution (2.25 Å) of the all-ferrous Fe-protein structure, it may seem unlikely that it is feasible to identify the unique site in the x-ray structure. However, it should be noted that the Debye–Waller factors of the core atoms are about half the protein average, implying that the core structure is much better defined than the overall protein structure. Strop et al.7 concluded from the low Debye–Waller factors that the crystallographic cluster structure pertains to a single conformation, as it is implicitly assumed in our analysis, and not to a conformational superposition. In this respect, not surprisingly, the protein environment cannot be entirely dismissed, as it apparently locks the cluster core into one of its intrinsic minima.
Table 9.
Root mean squares deviations for the twelve overlays of the all-ferrous clusters in Av2 and complex 1
| Case | Mapping | RMSD 4Fe (Å) | RMSD 4Fe-4S (Å) |
|---|---|---|---|
| 1 | 1,2,3,4 a | 0.053 | 0.060 |
| 2 | 2,3,1,4 | 0.071 | 0.070 |
| 3 | 3,1,2,4 | 0.050 | 0.066 |
| 4 | 2,4,3,1 | 0.121 | 0.127 |
| 5 | 4,1,3,2 | 0.099 | 0.096 |
| 6 | 3,2,4,1 | 0.095 | 0.094 |
| 7 | 4,2,1,3 | 0.068 | 0.081 |
| 8 | 1,3,4,2 | 0.121 | 0.127 |
| 9 | 1,4,2,3 | 0.103 | 0.102 |
| 10 | 3,4,1,2 | 0.122 | 0.122 |
| 11 | 4,3,2,1 | 0.089 | 0.090 |
| 12 | 2,1,4,3 | 0.102 | 0.105 |
Mapping of iron sites in all-ferrous cluster in nitrogenase to those of the all-ferrous cluster in complex 1. For example, in case 2: Fe1 → Fe2, Fe2 → Fe3, Fe3 → Fe1, Fe4 → Fe4 (nitrogenase → complex 1).
Figure 13.
Overlay of the all-ferrous Fe–S core in complex 1 (red) and the one in the Fe-protein of A. vinelandii (blue). The overlay is obtained by minimizing the RMSD between the corresponding iron and sulfur atoms of the two cores for the site-to-site mapping defined in case 1 of Table 8. Case 1 is one of the three mappings that map the unique sites (labeled Fe4) of the two cores onto each other and give significantly lower RMSDs.
5.2. Is there experimental evidence for E, S = 0 minima in all-ferrous clusters?
The spectroscopic and structural evidence discussed so far support the presence of T2, S = 4 minima in the all-ferrous clusters of two systems, viz. complex 1 and the Fe-protein from A. vinelandii. Some literature data raise the possibility that all-ferrous clusters may also appear in the alternative E, S = 0 minima. In a report of an EXAFS study of the Ti(III) citrate-reduced all-ferrous cluster in the Fe-protein of A. vinelandii, the iron–iron distances appear in two sets, one consisting of two long distances and the other of four short distances.18 These distances are consistent with the D2d symmetry of the E minima. However, such an assignment appears to be baseless taking into consideration the following points: (1) Mössbauer studies of Ti(III) citrate-reduced Fe-protein unambiguously show that the all-ferrous cluster has an S = 4 ground state rather than the S = 0 state predicted for the E minimum. (2) Given the magneto–structural correlation between exchange-coupling constant and bridging angle, the E minimum is predicted to have a cluster structure with two short and four long iron–iron distances rather than two long and four short distances as inferred from the EXAFS data. (3) The analysis described in the EXAFS report assumes that all iron sites are equivalent, precluding the identification of core conformations with inequivalent sites, such as the C3v symmetric T2 conformation. (4) A reversal in the energy order of the T2 and E minima would require significant changes in the force constants for these, otherwise remarkably conserved (Figure 13), core units. In a recent EPR and magnetic susceptibility study of flavodoxin hydroquinone (Em = −515 mV) treated Av2, the iron–sulfur cluster was reported to be in an all-ferrous, S = 0 state.9 This claim, however, has not yet been substantiated by application of a technique sensitive to the oxidation state of the cluster and should, given point (4) and the high potential at which the state was generated, be viewed with caution.
5.3. Graphical comparison of cores in complex 1 and Av2
In Figures S2A and S2B of the Supporting Information we have presented graphical comparisons of the Fe–Fe distances (Table S2) and Fe–S–Fe angles (Table 8) of the all-ferrous cores in 1 and Av2. In section 5.1 it was shown that the 12 Fe–S–Fe bridge angles can be cast in two sets: a set of 6 small angles for bridges between the equivalent irons (set 1) and a set of 6 large angles for bridges between the unique site and the equivalent sites. Accordingly, the six Fe–Fe distances can be cast in sets of 3 short distances (set 1) and 3 long distances (set 2). While the angles or distances belonging to one set are predicted by our model to be equal, examination Table S2 and Table 8 reveals that the sets contain different values. The widths of the dispersion ranges for each set can be gleaned from Figures S2A (and S2B): for set 1 the widths are 0.07 Å (2.7°) in complex 1 and 0.11 Å (5.4°) in Av2; for set 2 the spreads are 0.05 Å (2.2°) in complex 1 and 0.12 Å (3.3°) in Av2. The averages for the sets have been indicated by dashed arrows in the figures and are separated by 0.10 Å (3.6°) in complex 1 and by somewhat higher values, 0.15 Å (4.6°), in Av2. The set widths are smaller than the separations between the set averages in complex 1 and of similar magnitude in Av2. Interestingly, the two clusters exhibit the same correlation between the distances of the two sets: the shortest distance of set 1 (Fe1–Fe2 in 1 and Fe2–Fe3 in Av2) and the longest distance of set 2 (Fe3–Fe4 in 1 and Fe1–Fe4 in Av2) belong to complementary iron pairs; analogously, the intermediate distance of set 1 (Fe2–Fe3 in 1 and Fe1–Fe2 in Av2) and the intermediate distance of set 2 (Fe1–Fe4 in 1 and Fe3–Fe4 in Av2) and the longest distance of set 1 (Fe1–Fe3 in 1 and Fe1–Fe3 in Av2) and the shortest distance of set 2 (Fe2–Fe4 in 1 and Fe2–Fe4 in Av2) belong to complementary pairs as well (see Figure S2A). A similar correlation exists for Fe–S–Fe angles (see Figure S2B). In terms of symmetrized coordinates, the correlation indicates that the core structures of the two clusters are predominantly distorted in T2 space. However, since the three complementary pairs of Fe–Fe distances in Figure S2A are separated by different distances, the cluster locations in T2 space are displaced with respect to the diagonal positions of the T2 minima shown in Figure 11 (left). The qualitative similarity of the distortions in 1 and Av2 suggests that it is an intrinsic property of the core unit, although the amplitudes of the distortions differ between the two clusters (Figure S2), implying that the intrinsic distortional forces have been modulated by the changes in terminal ligation or cluster environment. We anticipate that a full understanding of these distortions will require an extension of the model presented in this paper by taking explicitly the 3d orbital states of the irons and their relationship to the exchange interactions between the irons into consideration. The distortions are partly reproduced by the DFT calculations for the broken-symmetry configuration representing the S = 4 state of Av2 by Torres et al.,16 who obtained a layered structure in which the 6 Fe–Fe distances appear as 1 short distance, 4 equal intermediate distances, and 1 long distance, with the short and long distances connecting complementary iron pairs and the unique site belonging to the long-distance pair. Thus, the structure obtained by Torres et al. shows also a distortion in T2 space but one that, unlike the T2 minima of Figure 11, is located on a ti axis. This prediction differs from the X-ray data for both 1 and Av2 in that the 4 intermediate Fe–Fe distances are equal and not dispersed over ranges with widths of ∼0.1 Å as in the X-ray structures (Figure S2A). Torres et al. reported also DFT calculations for the broken-symmetry configuration representing the S = 0 state and found that, while this state is lower in energy than the broken-symmetry S = 4 state in gas phase, the “S = 4” state becomes lowest by a wide margin of ∼2000 cm-1 when the cluster is placed in a protein/solvent simulating environment, suggesting an essential role of the protein in the stabilization of the S = 4 state. In contrast, our analysis of complex 1 shows that the S = 4 ground state of the all-ferrous core is also accessible in the absence of a hydrogen bonding protein/water environment, adding support to the idea that the S = 4 ground state is an intrinsic property of the core.
Supplementary Material
Table S1: Ranges of the Mössbauer parameters for the complex 1.
Table S2: Fe-Fe distances in all-ferrous cluster in Av2 and complex 1.
Figure S1: Spin expectation values for the lowest state of an S = 4 multiplet.
Figure S2A: Graphical comparison of the Fe–Fe distances in the all-ferrous clusters of complex 1 and Av2.
Figure S2B: Graphical comparison of Fe–S–Fe angles in the all-ferrous clusters of complex 1 and Av2.
Acknowledgments
This research was supported by NSF Grant MCB 0424494 to E.M. and NIH Grant GM 28856 to R.H.H.
References
- 1.Scott TA, Berlinguette CP, Holm RH, Zhou HC. Proc Natl Acad Sci USA. 2005;102:9741–9744. doi: 10.1073/pnas.0504258102. [DOI] [PMC free article] [PubMed] [Google Scholar]
- 2.Deng L, Holm RH. J Am Chem Soc. 2008;130:9878–9886. doi: 10.1021/ja802111w. [DOI] [PMC free article] [PubMed] [Google Scholar]
- 3.Rao PV, Holm RH. Chem Rev. 2004;104:527–559. doi: 10.1021/cr020615+. [DOI] [PubMed] [Google Scholar]
- 4.Angove HC, Yoo SJ, Burgess BK, Münck E. J Am Chem Soc. 1997;1997:8730–8731. [Google Scholar]
- 5.Angove HC, Yoo SJ, Münck E, Burgess BK. J Biol Chem. 1998;273:26330–26337. doi: 10.1074/jbc.273.41.26330. [DOI] [PubMed] [Google Scholar]
- 6.Yoo SJ, Angove HC, Burgess BK, Hendrich MP, Münck E. J Am Chem Soc. 1999;121:2534–2545. [Google Scholar]
- 7.Strop P, Takahara PM, Chiu HJ, Angove HC, Burgess BK, Rees DC. Biochemistry. 2001;40:651–656. doi: 10.1021/bi0016467. [DOI] [PubMed] [Google Scholar]
- 8.Hans M, Buckel W, Bill E. J Biol Inorg Chem. 2008;13:563–579. doi: 10.1007/s00775-008-0345-z. [DOI] [PMC free article] [PubMed] [Google Scholar]
- 9.Lowery TJ, Wilson PE, Zhang B, Bunker J, Harrison RG, Nyborg AC, Thiriot D, Watt GD. Proc Natl Acad Sci USA. 2006;103:17131–17136. doi: 10.1073/pnas.0603223103. [DOI] [PMC free article] [PubMed] [Google Scholar]
- 10.Münck E, Bominaar EL. Science. 2008;321:1452–1453. doi: 10.1126/science.1163868. [DOI] [PubMed] [Google Scholar]
- 11.Surerus KK, Hendrich MP, Christie PD, Rottgardt D, Orme-Johnson WJ, Münck E. J Am Chem Soc. 1992;114:8579–8590. [Google Scholar]
- 12.Münck E, Surerus KK, Hendrich MP. Methods Enzymol. 1993;227:463–479. doi: 10.1016/0076-6879(93)27019-d. [DOI] [PubMed] [Google Scholar]
- 13.Zimmermann R, Münck E, Brill WJ, Shah VK, Henzl MT, Rawlings J, Orme-Johmson WH. Biochim Biophys Acta. 1978;537:185–207. doi: 10.1016/0005-2795(78)90504-4. [DOI] [PubMed] [Google Scholar]
- 14.Dabrowski L, Piekoszewski J, Suwalski Nucl Inst Methods. 1971;91:93–95. [Google Scholar]
- 15.Kahn O. Molecular Magnetism. Verlag-Chemie; New York: 1993. [Google Scholar]; Willett RD, Gatteschi D, Kahn O, editors. NATO ASI series, Series C: Mathematical and Physical Sciences. Vol. 140. Reidel Publishing; Dordrecht: 1985. Magneto–Structural Correlations in Exchange Coupled Systems. [Google Scholar]
- 16.Torres RA, Lovell T, Noodleman L, Case DA. J Am Chem Soc. 2003;125:1923–1936. doi: 10.1021/ja0211104. [DOI] [PubMed] [Google Scholar]
- 17.The force constant κA for the symmetric mode is assumed to be ∞.
- 18.Musgrave KB, Angove HC, Burgess BK, Hedman B, Hodgson KO. J Am Chem Soc. 1998;120:5325–5326. [Google Scholar]
Associated Data
This section collects any data citations, data availability statements, or supplementary materials included in this article.
Supplementary Materials
Table S1: Ranges of the Mössbauer parameters for the complex 1.
Table S2: Fe-Fe distances in all-ferrous cluster in Av2 and complex 1.
Figure S1: Spin expectation values for the lowest state of an S = 4 multiplet.
Figure S2A: Graphical comparison of the Fe–Fe distances in the all-ferrous clusters of complex 1 and Av2.
Figure S2B: Graphical comparison of Fe–S–Fe angles in the all-ferrous clusters of complex 1 and Av2.


