Abstract
EEG data acquired in an MRI scanner are heavily contaminated by gradient artifacts that can significantly compromise signal quality. We developed two new methods based on Independent Component Analysis (ICA) for reducing gradient artifacts from spiral in-out and echo-planar pulse sequences at 3T, and compared our algorithms with four other commonly used methods: average artifact subtraction (Allen et al. 2000), principal component analysis (Niazy et al. 2005), Taylor series (Wan et al. 2006) and a conventional temporal ICA algorithm. Models of gradient artifacts were derived from simulations as well as a water phantom and performance of each method was evaluated on datasets constructed using visual event-related potentials (ERPs) as well as resting EEG. Our new methods recovered ERPs and resting EEG below the beta band (< 12.5 Hz) with high signal-to-noise ratio (SNR > 4). Our algorithms outperformed all of these methods on resting EEG in the theta- and alpha-bands (SNR > 4); however, for all methods, signal recovery was modest (SNR ~ 1) in the beta-band and poor (SNR < 0.3) in the gamma-band and above. We found that the conventional ICA algorithm performed poorly with uniformly low SNR (< 0.1). Taken together, our new ICA-based methods offer a more robust technique for gradient artifact reduction when scanning at 3T using spiral in-out and echo-planar pulse sequences. We provide new insights into the strengths and weaknesses of each method using a unified subspace framework.
Keywords: Simultaneous EEG-fMRI, Imaging artifacts, Independent component analysis (ICA)
Introduction
Understanding the neural basis of human brain function requires knowledge about the spatial and temporal aspects of information processing. Functional magnetic resonance imaging (fMRI) and electroencephalography (EEG) represent complementary brain imaging techniques in terms of their spatial and temporal resolution. fMRI yields highly localized measures of brain activation, albeit with a temporal resolution significantly longer than the time needed to make perceptual and cognitive judgments in most laboratory experiments. EEG has the required temporal resolution to study the dynamics of brain function, but its poor spatial resolution prevents an effective localization of the underlying neural sources. Combining information from fMRI and EEG holds great promise for examining the spatial and temporal dynamics of brain processes (Gotman, 2008; Gotman et al., 2006; Hamandi et al., 2008; Herrmann and Debener, 2008; Laufs, 2008; Laufs et al., 2008; Menon and Crottaz-Herbette, 2005; Mulert et al., 2008; Ritter and Villringer, 2006). EEG acquired in the MRI scanner is contaminated by large artifacts (Allen et al., 2000; Allen et al., 1998; Srivastava et al., 2005) arising from currents induced by rapid switching of magnetic field gradients during the imaging process. The amplitude of these gradient artifacts is several orders of magnitude greater than the EEG. Validating procedures for gradient artifact removal is therefore a high priority if simultaneous EEG-fMRI recordings are to be more widely used in brain imaging studies. Most current methods for gradient artifact reduction are based on the observation that gradient artifacts have stable profiles with relatively small trial-by-trial variation. This temporal variability is believed to be captured by a finite number of basis functions which span the gradient artifact subspace, artifact signals are therefore assumed to lie in a subspace of finite dimension. Extant algorithms differ primarily in the way such basis functions are constructed.
The average artifact subtraction (AAS) method proposed in (Allen et al., 2000) is the most widely used method for the removal of gradient artifacts. In this method, the average artifact template, constructed by averaging successive artifact epochs, is subtracted from each epoch. This process can be viewed as taking the projection of each epoch onto the space spanned by the average artifact template and subtracting this component from the raw EEG data of this epoch. An adaptive noise cancellation (ANC) procedure is then used to remove any further artifact component correlated with gradient artifacts. While this method was shown to be adequate in frequency bands < 24Hz, the contamination in higher frequency bands, e.g. gamma and high gamma, was not examined. Subsequent studies by Negishi et al (Negishi et al., 2004), Niazy et al (Niazy et al., 2005) and Wan et al (Wan et al., 2006) suggest that the average artifact template alone may not account for temporal variations in the gradient artifacts.
Negishi et al (Negishi et al., 2004) and Niazy et al (Niazy et al., 2005) both use temporal principal component analysis (PCA) to remove residual artifacts after AAS. In Niazy et al's (Niazy et al., 2005) approach, the gradient artifact template, together with the eigenvectors corresponding to the largest eigenvalues of the data matrix constructed from the successive epochs, span the artifact subspace. Wan et al (Wan et al., 2006) represent the gradient artifact at each acquisition epoch as a linear combination of average artifact template and its derivatives, based on the band-limited Taylor's series expansion of the artifact template. From a subspace framework, the gradient artifact template and its derivatives span the gradient artifact subspace. These methods appear to work well in the alpha range and in extracting ERPs. However, its efficacy in higher frequency bands is not known.
ICA offers a powerful method for artifact removal. It has been widely used for artifact reduction in EEG and MEG applications (Jung et al., 2000; Makeig et al., 1997). We and others have previously shown that ICA based methods are powerful for removing other artifacts in scalp EEG (Debener et al., 2007; Delorme et al., 2007; LeVan et al., 2006; Mantini et al., 2007; Srivastava et al., 2005), yet its effectiveness for removing gradient artifacts is unclear. Grouiller et al (Grouiller et al., 2007) evaluated an ICA method for gradient artifact reduction. This is a conventional spatial ICA method in which data is decomposed into independent source components. The source components related to artifacts are identified by correlating each source component with an average artifact template. Source components whose correlation is above a certain threshold are removed and artifact-free data is reconstructed from the remaining components, which is a common approach used in ICA based artifact reduction methods. This method appears to perform well on simulated data but it becomes highly unstable when applied to more realistic gradient-contaminated EEG data (Grouiller et al., 2007). To overcome the limitations of this method, we propose two new methods, one that is model-based (ICA1) and another (ICA2) that is data driven and based on model order selection. We compared our methods with this conventional ICA method (referred here as ICA3) applied on each channel separately (temporal ICA) as opposed to the spatial ICA method of (Grouiller et al., 2007). We used temporal ICA to model the temporal variations of gradient artifacts like in AAS, PCA, TS and our ICA1, ICA2 methods. One advantage of our methods (ICA1 and ICA2) is that they do not require identifying the source components related to artifacts, unlike the conventional ICA based methods. We also compare the performance of our algorithms with AAS (Allen et al., 2000), PCA-based (Niazy et al., 2005), and Taylor series (TS)-based (Wan et al., 2006) methods.
To our knowledge, all previous development and validation of gradient artifact removal techniques has been performed with fMRI data acquired using EPI sequences (Ritter, 2007; Grouiller, 2007; Gonçalves, 2007). The extent to which these methods are effective with spiral in-out pulse sequences is not clear, and the usable frequency bandwidth of the artifact-corrected single-trial or resting-state EEG has not been adequately examined for this pulse sequence. With increasing use of spiral in-out sequences for fMRI, particularly at high field strengths (Glover and Law, 2001; Hu and Glover, 2007), evaluation of previously-developed methods and the development of new techniques is becoming increasingly important. The temporal profile of spiral in-out artifacts is more complex than that of EPI, and this may present specific challenges. In particular, the spiral waveform follows a chirp function that has a broader spectral signature than the periodic EPI trajectory. Knowledge of the performance offered by various artifact removal methods is particularly important for detecting early components of stimulus evoked ERPs (Sabri et al., 2006), for determining the usable bandwidth of single-trial emergent and resting brain activity (Laufs, 2008) (Debener et al., 2006) and for localization of spike and wave morphology in clinical epilepsy related applications (Cunningham et al., 2008; Gotman, 2008; Laufs and Duncan, 2007). Since EPI is the most widely used fMRI pulse sequence, we also examined the performance of our methods on EEG data acquired during EPI.
Methods and Materials
Data Acquisition Protocols
MRI acquisition
Anatomical and functional MRI acquisitions were performed on a 3-T GE scanner (GE Signa, Milwaukee WI.) using a standard whole head coil. A custom-built head holder was used to prevent head movement. Functional MRI data were acquired using 25 axial slices (4.0 mm thick, 0.5 mm skip, acquisition voxel size: 3.125 × 3.125 × 4.5 mm) parallel to the anterior and posterior commissural covering the whole brain, using a T2* weighted gradient spiral in-out pulse sequence (TR = 2000 ms, TE = 30 ms, flip angle = 80° and 1 interleave). Functional images were also acquired with an echo-planar (EPI) sequence (TR = 2000 ms, TE = 30 ms, flip angle = 70 degrees) with the same slice prescription used for the spiral in/out sequence.
EEG recordings
EEG and vertical electro-oculogram (VEOG) were recorded continuously from 64 electrodes using a MRI compatible Quik-Cap and the Synamps2 system (Neuroscan Inc.). VEOG was recorded from two electrodes placed on the infra- and supraorbital ridges of the left eye. The cardiac cycle was monitored using a pulse oximeter placed on the finger. Slice and volume triggers were acquired during MR scanning. The signals were band pass filtered (0.1-1000 Hz) and digitized at a rate of 10 kHz. The EEG sampling period was therefore set to be an integral multiple of TR, though synchrony between the EEG and scanner clocks could not be ensured since our current system does not have the required hardware. All leads were referenced to FZ. Electrode impedance was kept below 5 kΩ. We used data from electrode O2; similar results were obtained from other electrodes and are not presented here.
Human EEG Datasets
Resting EEG data
Participants underwent an 8 min resting-state scan in which simultaneous EEG-fMRI were recorded during either spiral or EPI sequences. The participant was instructed to keep their eyes closed, hold still, try not to fall asleep and allow their mind to wander. Resting EEG data was also acquired outside the scanner on the same participant.
Visual stimulation data
Participants performed a passive visual task outside the scanner. The visual task design consisted of 15 alternating blocks of “checkerboard” (24.9 sec duration) and “fixation” (8 sec duration). In the “checkerboard” block, a circular checkerboard underwent contrast reversal every 830 ms; in the “fixation” block, subjects fixated on a small cross presented at the center of the screen.
Water phantom Datasets
Water Phantom data
Simultaneous EEG and fMRI data were acquired using a water phantom. Electrodes were submerged and taped down in a container filled with saline water to provide good conductance for EEG recording, and scanned to produce artifacts from gradient switching and thermal noise. For the water phantom, recordings from the eye electrodes and pulse oximiter were not obtained. Two datasets, one using a spiral sequence and the other using an EPI sequence, were collected. A third dataset was acquired without fMRI scanning; this data was used to estimate thermal noise. The duration of each of these recordings were 8 minutes.
Models for Gradient Artifacts
A major problem in comparing the performance of various artifact reduction methods is that the true gradient artifacts are unknown. To solve this problem, we developed two models of gradient artifacts.
Simulated gradient artifacts
The first modeled an average gradient artifact with a linearly additive temporal jitter designed to capture inter-slice and inter-volume variations over time, such as those caused by asynchrony between EEG and MRI clocks (Allen et al., 2000). The advantage of this model is that it incorporates a simple way of capturing the most salient temporal jitter in EEG recordings caused by asynchronous clocks.
Templates of gradient artifacts, for both spiral and EPI sequence data, were created from one channel (O2) of resting state data using the AAS method described below. The preprocessing steps, described below, such as high pass filtering and timing correction, were performed before estimating the templates. Because of asynchronous EEG and MRI clocks, the gradient artifact is not always sampled at exactly the same location; this is one of the main sources of variation in the gradient artifact profile in a given channel. To simulate this variation, the artifact template was up sampled to 40 KHz and the starting location was randomly offset by 1-4 samples. The artifact was then down sampled to 10 KHz starting at the new location. We up sampled the data to 40 KHz instead of 20 KHz in order not to bias the results towards the ICA1 algorithm (refer to the ICA1 method below). The amplitude of the template was also varied randomly up to 10% of the maximum amplitude (i.e 0.9 t to 1.1 times the maximum amplitude) of the template.
Phantom-based gradient artifacts
The disadvantage of simulation-based gradient artifacts is that they do not adequately represent temporal variations in artifact morphology seen in an actual recording session. To address this issue, we used a water phantom to create a more realistic model of gradient artifacts. We first acquired data from EEG electrodes placed in a water phantom during fMRI scanning using spiral in-out and EPI sequences, as described above. This data contains both gradient artifacts and thermal noise (Mandelkow et al., 2006). Importantly, however, this data is not contaminated with physiological artifacts such as ballistocardiogram artifacts (Srivastava et al., 2005). We then developed a wavelet denoising technique to remove thermal noise and uncover “true” gradient artifacts (please refer to the Supplementary Material for more details on wavelet denoising methods). We refer to these wavelet denoised gradient artifacts as “phantom artifacts”.
Creating test datasets
Several datasets were created to test our artifact reduction algorithms. In each case, we added noise-free EEG data acquired outside the scanner to the gradient artifact models developed above. We then attempted to recover the original EEG signal from the artifact-contaminated test data.
Simulated artifact datasets
The performance of each algorithm was examined using EEG acquired during a visual perceptual task and resting-state. This approach allowed us to examine signal-to-noise (SNR) of each artifact reduction method in both ERPs and resting EEG signals. The following test datasets, one from spiral and one from EPI scanning, were constructed using the simulated gradient artifacts:
ERPs: EEG data (from channels O1, O2 and Oz) from the visual stimulation task performed outside the scanner were added to the simulated artifact data.
Resting EEG: One channel (O2) of resting-state EEG acquired outside the scanner was added to the simulated artifacts.
The flow chart for test data generation using simulated artifacts is shown in the supplementary figure S3 (A).
Phantom-based artifact datasets
We used the same procedure as with the simulated dataset, except that gradient artifacts derived from the phantom were added to the ERP and resting EEG signals. The flow chart for test data generation using phantom artifacts is shown in the supplementary figure S3 (B).
Thermal noise estimation
To compare the methods on real datasets, we applied the gradient artifact reduction methods on the water phantom data (both spiral and EPI) without applying wavelet denoising. The underlying thermal noise was estimated by subtracting the estimated gradient artifacts from the data. The ratio between the standard deviation of thermal noise obtained without fMRI scanning and estimated thermal noise is computed. This ratio should be close to 1 if the artifact reduction is effective.
EEG pre-processing
The following preprocessing steps were applied to the data before applying any artifact reduction methods:
High-pass filtering: The EEG data in each channel was high-pass filtered at 1 Hz to remove low frequency trends.
Timing correction: The MRI scanner outputs triggers just before the start of each data acquisition readout. We used these slice trigger locations to segment the EEG data into individual slice acquisition epochs that were subsequently used to construct the artifact subspace. Because of potential misalignment of acquisition triggers with respect to the actual starting location of each acquisition (due to asynchronous timing of the EEG and MRI clocks), correcting the misalignment is important for improving the performance of artifact reduction algorithms. Each channel's time-series was up sampled from 10 KHz to 20 KHz prior to artifact reduction in order to correct for acquisition timing errors (Niazy et al., 2005). We used a Fourier domain phase delay estimation method (Wang et al., 2006) to estimate the delay between two consecutive triggers. This method results in estimation of delays accurate to a sub-sample level.
Methods for Artifact Reduction
We describe below two methods developed by us (ICA1 and ICA2) and four existing methods (ICA3, AAS, PCA and TS).
ICA Method 1 (ICA1)
As noted in several studies (Allen et al., 2000; Negishi et al., 2004; Niazy et al., 2005), the main source of error in AAS is in the misalignment of slice triggers. The following steps were used to capture the artifact subspace corresponding to this misalignment. Note that all the methods were applied on slice acquisition epochs which were obtained using the slice triggers. We refer to slice acquisition epochs as the “epochs”.
For each slice acquisition epoch, extract 50 epochs such that the gap between each epoch is at least 350 ms. This can be ensured by including every 4th epoch for sampling frequency of 10KHz and TR = 2secs.
Compute the average of these 50 epochs and normalize them such that their maximum amplitude is unity. Let g (t) is the template for gradient artifact.
- Generate several instances of gradient artifacts by randomly jittering the onset of the artifact and modulating its amplitude. An i-th instance is generated as follows:
where, ti is a random number between 0 and d. d is the maximum predefined jitter. The amplitude ai is again a random number between 0.9 and 1.1. The assumption is that the amplitude of the artifact can have a variation of +/- 10%. Let be a M × N matrix with M instances of gradient artifacts, each with N time samples. Applying ICA to matrix G results in at most M independent source waveforms that span the gradient subspace.
- Let the columns of the matrix U contain the independent source waveforms. The orthogonal projector PU onto the columns of U is given by
The artifact free EEG signal x̂ was estimated by projecting each acquisition epoch x onto the artifact space and subtracting it from x.
where I is an identity matrix whose number of rows or columns is equal to the length of acquisition epoch x. We used the fastICA algorithm to estimate the independent source components (Hyvarinen, 1999). Here, we use M = 100. Note that the above bases can also be obtained by applying PCA on the data matrix G, where eigenvectors corresponding to non-zero eigenvalues can be assumed to span the artifact space. We obtained similar results using this approach, but here, we only report results obtained using the ICA bases. Note that the rows of G also span the artifact space and therefore, the projection matrix can be constructed using the matrix G itself. However, this resulted in poor performance compared to the bases extracted either by PCA or ICA.
ICA Method 2 (ICA2)
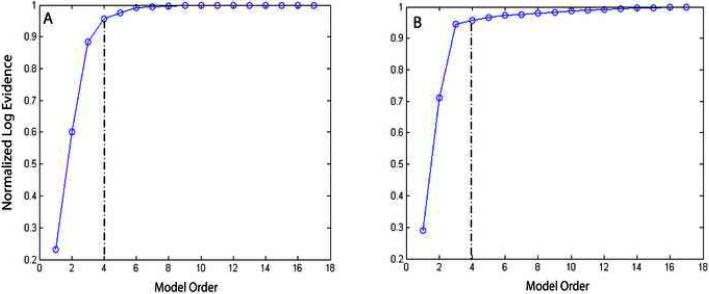
This method is similar to ICA1, except that instead of generating the samples from the artifact population by jittering and amplitude modulation of an artifact template, we estimated the artifact basis functions from the data itself. We applied ICA directly to the acquisition epochs. Here we assume that the gap between the successive epochs is at least 350 ms, so that EEG component signals between successive epochs are uncorrelated. The subspace is constructed for each epoch using 50 epochs adjacent to the current epoch. We applied model order selection procedure (Minka, 2000) to estimate the number of gradient artifact components in the data that can be recovered reliably using ICA. In this approach, a Bayesian approach is used to estimate the model order. Specifically, the probability model for the observed data is derived using probabilistic principal component analysis and the evidence of the model is the marginal probability of the data for a given model order. This is obtained by integrating out the model parameters from the joint distribution of data and parameters and is approximated by Laplace approximation. The optimal order is estimated as the order at which the percentage difference in log evidence between two successive orders is less than or equal to 10%. The extracted components serve as bases for the artifact subspace. Artifact-free EEG signal was then estimated by projecting the original data onto the artifact space and subtracting it from the data.
ICA method 3 (ICA3)
We use the following conventional temporal ICA method for gradient artifact reduction. This method computes all the source components as opposed to extracting only few components as in ICA2 method.
Let X be the data matrix whose rows consist of slice acquisition epochs. ICA algorithm decomposes X as
where A is the mixing matrix and the rows of S contains the independent time courses. The source time courses related to gradient artifact are identified by computing the normalized cross correlation between each source time series and an artifact template. The components whose correlation coefficients above a threshold are identified as components related to artifact. The threshold is set to the average of all correlation coefficients plus one standard deviation. The estimated EEG signal is then given by
Where x̂ is denoised EEG and Io is a diagonal matrix of zeros or ones indicating which components are excluded or included.
Average artifact subtraction (AAS) method
This artifact reduction technique consists of segmenting data from each channel into epochs whose length equals the duration of one slice acquisition. An artifact template for a slice acquisition was computed by averaging across 50 acquisitions without differentiating spatial slices. This average template was subtracted from each epoch, followed by low-pass filtering and ANC to remove any residual artifacts. As pointed out by Allen et al (Allen et al., 2000)and Niazy et al. (Niazy et al., 2005), EEG signal will be correlated between two successive acquisitions. Therefore, to average out the EEG signals, a gap of at least 350ms was introduced between acquisitions used in the average template estimation.
Temporal PCA based gradient artifact subspace (PCA) method
Average artifact templates computed with the AAS method may not adequately span the artifact space. Niazy et al (Niazy et al., 2005) used PCA to remove the residual artifacts left behind by AAS method. This algorithm is implemented using the following steps:
Segment the residual data, obtained after applying AAS, into acquisition epochs.
Form a matrix X such that each row contains an acquisition epoch. Let the gap between two successive epochs (that is two consecutive rows in X) be at least 350 ms.
Remove row and column means of the matrix X and compute the sample covariance matrix C.
Apply eigenvalue decomposition to C.
Let U be the matrix containing the eigenvectors of C corresponding to the highest Eigen values. The same model order estimation process used in the ICA2 method was also used here to determine the number of eigenvectors to be retained.
The artifact free EEG acquisition epoch is estimated by projecting each acquisition epoch onto the column space of U subtracting it from the acquisition epoch.
Taylor series based gradient artifact subspace (TS) method
Wan et al. (Wan et al., 2006) used the average artifact along with its first and higher order derivatives to model the gradient artifact. The average artifact and its derivatives are considered to span the artifact subspace. The artifact â in the acquisition epoch x is estimated as:
where s is the average artifact computed using averaging 50 acquisition epochs (with at least 350ms gap between epochs) nearest to the current epoch, and sn is the n-th order derivative of s and αn is the weights for sn. These weights are determined by minimizing the least square error (LSE) between x and â. The number of derivatives Q used in modeling â is determined by sequentially fitting the data order by order and choosing the order for which the LSE is minimized. The artifact free EEG signal x̂ is then estimated as
The method is repeated for each acquisition epoch.
Performance metrics
Signal to noise ratio (SNR)
We compute SNRs to evaluate the performance of the artifact reduction methods on simulated data. SNR is computed as follows:
where, x is the actual EEG signal, is the estimated EEG signal after artifact correction.
Power spectra
The power spectra of the estimated and actual EEG data were estimated using the Welch method with a window size of 2048 and an overlap of 1024 data samples.
Results
Spectral profiles of spiral and EPI in-out gradient artifacts
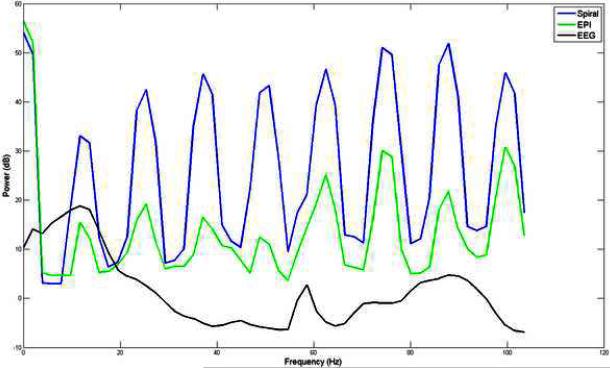
Figure 1 show the power spectra of gradient artifacts of channel O2 obtained using spiral in-out and EPI sequences and power spectrum of EEG signal, of channel O2, obtained outside the scanner. These power spectra were estimated using the Welch method with a window size of 2048 and an overlap of 1024 samples. Figure 1 shows that, there is a considerable overlap between the gradient and EEG spectra. In particular, gradient artifacts in spiral in-out sequences have greater power than those of EPI sequences in the frequency ranges of interest. Also, the maximum amplitude of gradient artifacts (in both spiral and EPI sequences) is about 400 times than that of the maximum amplitude of EEG signals.
Figure 1.
Power spectra of gradient artifacts, of channel O2, obtained using spiral and EPI in-out sequences and power spectrum of resting state EEG signal, of channel O2, obtained outside the scanner. There is a considerable overlap between the gradient and EEG spectra. In particular, gradient artifacts in spiral in-out sequences have greater power than EPI sequences in the frequency ranges of interest.
Model order selection for ICA2
Estimation of model order is a critical step in applying ICA2. Figure 2 shows the log-evidence versus model order for simulated artifact and phantom artifact datasets using spiral sequences. In each of these datasets, the model order selected was 4. Therefore, 4 source components were extracted and used as artifact basis vectors in ICA2 method. As noted below, this provides a significant improvement over ICA3 which relies on full decomposition of the data matrix.
Figure 2.
Log-evidence versus model order for (A) Simulated data (B) Phantom data. The optimal order is one in which at which the percentage difference in log evidence between two successive orders is less than or equal to 10%.
Estimation of visual ERPs
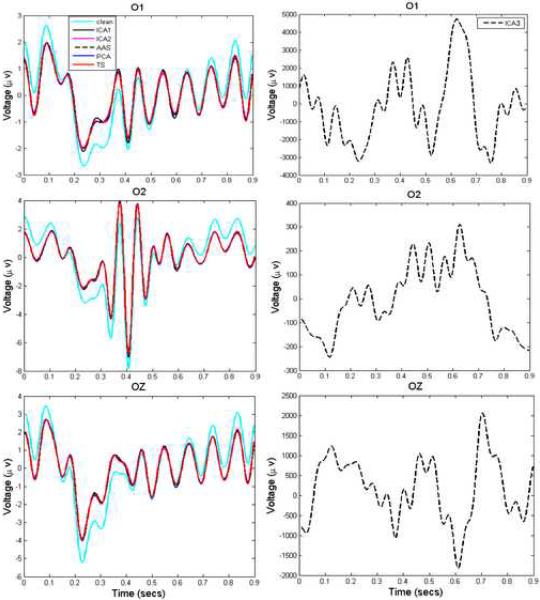
We first evaluated the performance of ICA1, ICA2 with AAS, PCA, TS and ICA3 on VEP data created using simulated spiral gradient datasets. ERPs were computed from artifact-corrected EEG data and compared to artifact-free ERPs from EEG data obtained outside the scanner. 300 trials were used in estimating these ERPs. Visual ERPs estimated from three occipital channels, O2, O1 and OZ, as shown in Figure 3, suggest that all methods except ICA3 were successful in reproducing the original ERPs. Further analysis showed that the estimated ERPs had SNRs of about 2.0, as indicated in Table 1A, for all methods except ICA3. Table 1B shows SNRs and Supplementary Figure S4 shows ERP waveforms estimated from simulated echo-planar gradient datasets.
Figure 3.
Comparison of actual and estimated ERPs for the simulated EEG data. The three panels show extracted ERPs from channels O1, O2 and OZ. All methods recovered ERPs with SNR ~ 2.5, except ICA3 which performed poorly.
Table 1. SNR for visual ERPs.
Signal to noise ratio (SNR) of visual ERPs recovered from (A) simulated spiral (B) simulated EPI (C) phantom spiral and (D) phantom EPI gradient datasets in channels O1, O2 and Oz, using ICA1, ICA2, ICA3, AAS, PCA and TS.
| (A) Simulated Data (Spiral) | ||||||
|---|---|---|---|---|---|---|
| Channels | ICA1 | ICA2 | ICA3 | AAS | PCA | TS |
| O1 | 2.5 | 2.5 | 0.1 | 2.5 | 2.5 | 2.5 |
| O2 | 2.4 | 2.5 | 0.07 | 2.4 | 2.4 | 2.4 |
| OZ | 2.4 | 2.4 | 0.09 | 2.4 | 2.4 | 2.4 |
| (B) Simulated Data (EPI) | ||||||
|---|---|---|---|---|---|---|
| Channels | ICA1 | ICA2 | ICA3 | AAS | PCA | TS |
| O1 | 1.9 | 2.4 | 0.05 | 2.4 | 2.3 | 2.4 |
| O2 | 1.7 | 2.5 | 0.02 | 2.3 | 2.2 | 2.3 |
| Oz | 1.6 | 2.4 | 0.07 | 2.4 | 2.4 | 2.4 |
| (C) Phantom Data (Spiral) | ||||||
|---|---|---|---|---|---|---|
| Channels | ICA1 | ICA2 | ICA3 | AAS | PCA | TS |
| O1 | 2.1 | 2.3 | 0.05 | 2.3 | 2.1 | 2.2 |
| O2 | 1.7 | 2.0 | 0.02 | 1.9 | 1.8 | 1.8 |
| OZ | 1.9 | 2.0 | 0.07 | 2.1 | 2.0 | 2.0 |
| (D) Phantom Data (EPI) | ||||||
|---|---|---|---|---|---|---|
| Channels | ICA1 | ICA2 | ICA3 | AAS | PCA | TS |
| O1 | 2.5 | 2.4 | 0.05 | 2.2 | 2.2 | 2.3 |
| O2 | 1.5 | 2.2 | 0.02 | 2.1 | 1.9 | 2.1 |
| Oz | 1.4 | 2.3 | 0.07 | 2.3 | 2.3 | 2.3 |
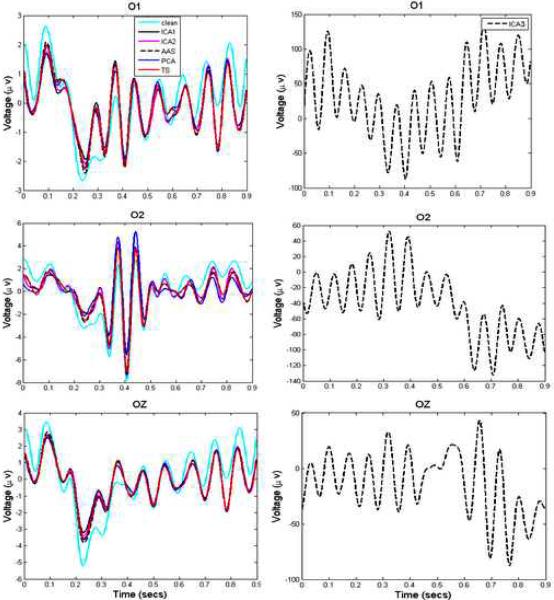
We then evaluated the performance of each method on VEP data created using phantom-based spiral gradient artifacts. Figure 4 shows the estimated ERPs from the channels O1, O2 and Oz. In this case also, the SNRs of the estimated ERPs (except of those obtained after applying ICA3) were about 2 (Table 1C). Table 1D shows SNRs and Supplementary Figure S5 shows ERP waveforms estimated from phantom-based echo-planar gradient datasets.
Figure 4.
Comparison of actual and estimated ERPs for the phantom EEG data. The three panels show extracted ERPs from channels O1, O2 and OZ. All methods recovered ERPs with SNR ~ 2, except ICA3 which performed poorly.
Estimation of resting EEG
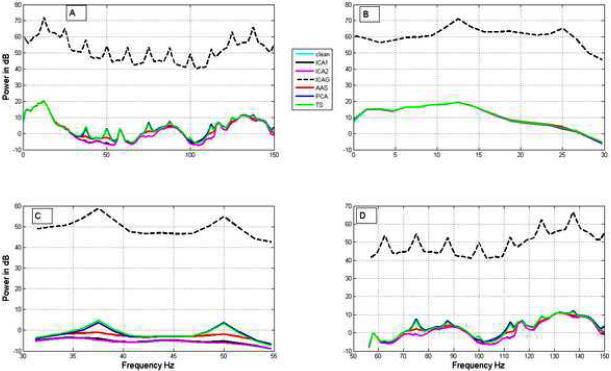
We evaluated the performance of ICA1, ICA2, AAS, PCA, TS and ICA3 on resting EEG. Figure 5 shows the power spectrum of the clean EEG obtained outside the scanner and the EEG data denoised from simulated spiral gradient datasets with each method. Figure 5A shows power spectra up to 150 Hz, while Figure 5 B-D show the power spectra in frequency bands 0-30 Hz (up to beta band), 30-55 Hz (gamma band) and 55-150 Hz (high gamma band), respectively. The power spectra in these bands were computed after down-sampling the data to 400Hz followed by band pass filtering the data at the specified frequency bands. Table 2A shows the SNRs obtained for signals recovered, from the simulated spiral artifact dataset, using each of the methods in the conventional EEG frequency bands. Table 2B show the SNRs obtained for the simulated echo-planar gradient dataset. We found that performance of ICA2 is superior to all other methods whereas ICA3 performs very poorly on these datasets. Supplementary figure S6 shows the power spectra of the estimated resting state EEG signal at various EEG bands from the simulated EPI artifact data.
Figure 5.
Comparison of actual and estimated power spectra for the simulated EEG data. Panels A, B, C and D respectively show the power spectra in the frequency ranges 0-200 Hz, 0-30 Hz (up to beta band), 30-55 Hz (gamma) and 55-150 Hz (high gamma). The performance of ICA1 and ICA2 are better in all the frequency ranges. ICA based methods perform better than the other methods. Refer to Table 2A for details.
Table 2. SNR for resting-state EEG.
Signal to noise ratio (SNR) in specific EEG frequency ranges for resting EEG extracted from (A) simulated spiral (B) simulated EPI (C) phantom spiral and (D) phantom EPI gradient datasets using ICA1, ICA2, ICA3, AAS, PCA and TS. On simulated artifacts, the performance of ICA1 and ICA2 are better than the other methods. On more realistic spiral and EPI phantom artifacts, the methods are able to recover EEG signal up to Beta band. The performance of all methods is poor in gamma and high gamma bands. ICA2 followed be ICA1 have better performance in the Alpha range.
| (A) Simulated Data (Spiral) | ||||||
|---|---|---|---|---|---|---|
| EEG Frequency Bands (Hz) | ICA1 | ICA2 | ICA3 | AAS | PCA | TS |
| Theta (4.5-7.5) | 6.0 | 9.8 | 0.06 | 3.4 | 3.1 | 3.3 |
| Alpha (8-12) | 10.4 | 16.0 | 0.05 | 4.6 | 4.1 | 4.6 |
| Beta (12.5-30) | 5.8 | 10.1 | 0.03 | 4.0 | 3.1 | 3.9 |
| Gamma (30.5-100) | 5.5 | 9.1 | 0.02 | 2.3 | 2.4 | 2.3 |
| High Gamma 100-150) | 4.6 | 5.0 | 0.02 | 2.4 | 2.2 | 3.2 |
| (B) Simulated Data (EPI) | ||||||
|---|---|---|---|---|---|---|
| EEG Frequency Bands (Hz) | ICA1 | ICA2 | ICA3 | AAS | PCA | TS |
| Theta (4.5-7.5) | 5.0 | 9.7 | 0.01 | 3.0 | 2.7 | 3.0 |
| Alpha (8-12) | 9.1 | 14.0 | 0.02 | 4.4 | 4.0 | 4.4 |
| Beta (12.5-30) | 6.4 | 10.0 | 0.01 | 3.8 | 3.0 | 3.8 |
| Gamma (30.5-100) | 4.1 | 6.7 | 0.01 | 3.1 | 2.7 | 3.4 |
| High Gamma 100-150) | 6.2 | 9.0 | 0.01 | 4.3 | 3.7 | 4.8 |
| (C) Phantom Data (Spiral) | ||||||
|---|---|---|---|---|---|---|
| EEG Frequency Bands (Hz) | ICA1 | ICA2 | ICA3 | AAS | PCA | TS |
| Theta (4.5-7.5) | 4.0 | 4.0 | 0.06 | 3.4 | 3.1 | 3.4 |
| Alpha (8-12) | 4.5 | 4.6 | 0.02 | 3.8 | 3.1 | 3.8 |
| Beta (12.5-30) | 1.3 | 1.5 | 0.007 | 1.7 | 1.5 | 1.7 |
| Gamma (30.5-100) | 0.3 | 0.3 | 0.001 | 0.3 | 0.4 | 0.4 |
| High Gamma 100-150) | 0.6 | 0.6 | 0.004 | 0.6 | 0.7 | 0.6 |
| (D) Phantom Data (EPI) | ||||||
|---|---|---|---|---|---|---|
| EEG Frequency Bands (Hz) | ICA1 | ICA2 | ICA3 | AAS | PCA | TS |
| Theta (4.5-7.5) | 1.8 | 2.8 | 0.02 | 2.4 | 2.3 | 3.0 |
| Alpha (8-12) | 3.8 | 4.1 | 0.02 | 3.7 | 2.4 | 3.7 |
| Beta (12.5-30) | 1.1 | 1.2 | 0.005 | 1.3 | 1.2 | 1.3 |
| Gamma (30.5-100) | 0.3 | 0.3 | 0.002 | 0.4 | 0.4 | 0.4 |
| High Gamma 100-150) | 0.6 | 0.8 | 0.004 | 0.9 | 0.9 | 0.9 |
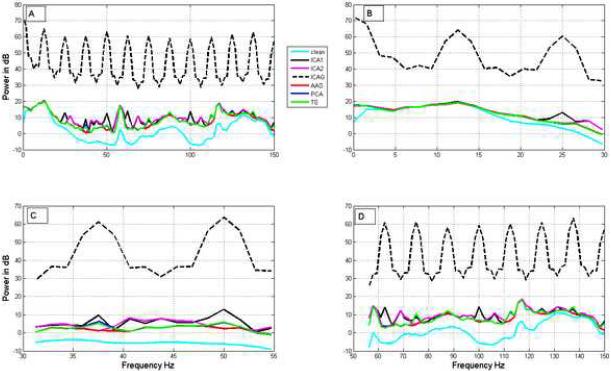
Figure 6 shows the power spectra of EEG obtained after applying the methods on resting dataset added to the phantom-based spiral artifact dataset. Table 2C shows the SNR of EEG signal recovered by each method at EEG frequency ranges of interest. These results show that ICA1 and ICA2 perform well (with SNR of about 4) in theta and alpha bands compared to other methods. In the beta band, performance was modest with all methods (SNR ~ 1). All the methods perform poorly (SNRs less than 0.5) in gamma and high gamma bands. The performance of ICA3 was poor (SNR < 1) in all frequency ranges. Table 2D shows the SNR of EEG signal recovered from phantom-based EPI dataset at EEG frequency bands. ICA2 performed better than the other methods in the alpha band. Supplementary Figure S7 shows the power spectra of the estimated resting EEG signal at various EEG bands from the phantom-based EPI artifact data.
Figure 6.
Comparison of the actual and estimated power spectra for the phantom data. Panels A, B, C and D respectively show the power spectra in the frequency ranges 0-200 Hz, 0-30 Hz (up to beta band), 30-55 Hz (gamma) and 55-150 Hz (high gamma). All methods except ICA3 perform well in the frequency range 0-30 Hz shown in B. All methods perform poorly in the gamma and high-gamma bands. The performance of our ICA methods is marginally better with respect to the obtained SNR in most of the frequency bands up to beta band (Table 2C).
Comparison of artifact subspace basis vectors
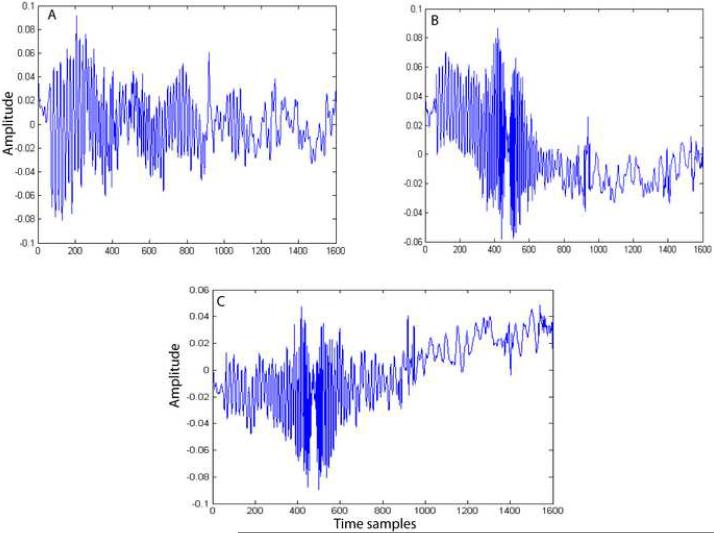
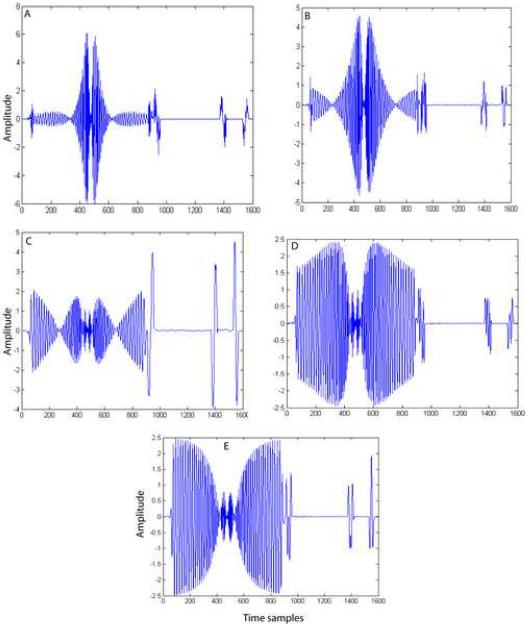
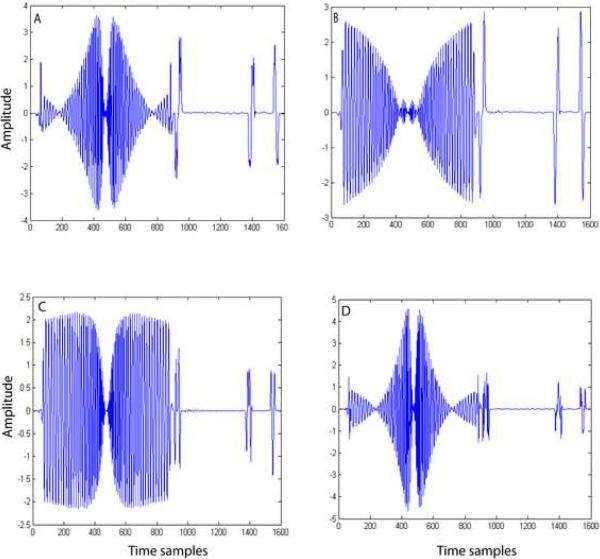
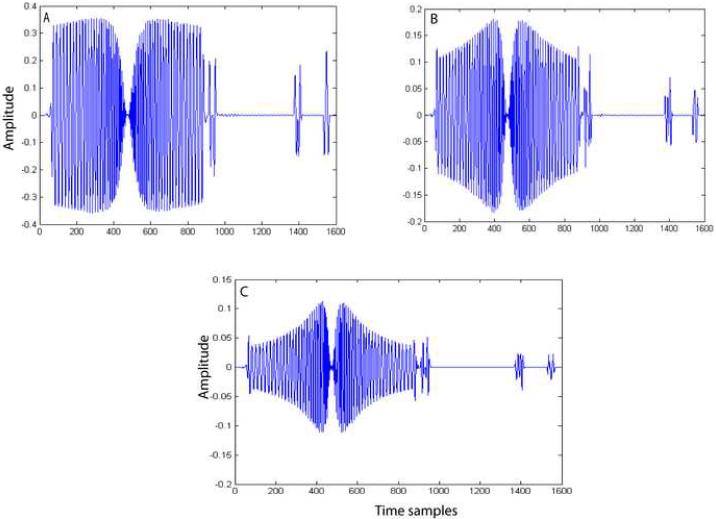
The merits and demerits of each method in gradient artifact reduction can be explained by observing the bases vectors obtained by each of these methods. In the case of PCA and ICA2 methods, we employed model order selection to determine the number of bases to be included for representing the artifact subspace. Figure 7 shows the first three principal components obtained by PCA. Basis vectors 2 and 3 (Figure 7B and 7C) obtained by PCA contain EEG component in addition to gradient components. Therefore, including these bases without proper model selection would result in the PCA removal of the EEG component along with the gradient artifact components. We used model order estimation to determine the number of components to be included in the artifact estimation. We noticed that model order estimation method included only one component most of the time. Therefore, in this method, caution should be exercised in choosing the number of bases to represent the artifact space. In contrast, the bases obtained by the ICA1 (Figure 8), ICA2 (Figure 9) and TS (Figure 10) methods do not appear to have any EEG components. In ICA2, the bases (Figure 9) are obtained by constraining the ICA algorithm to extract only the number of components determined by the model order selection method. Figure 9 clearly shows that all the four bases do not contain any EEG component. In the ICA1 and TS methods, the bases, (Figures 8 and 10, respectively) are generated using an average artifact template. Since EEG is a zero mean stochastic process, averaging N (N=50) segments results in a reduction of the variance of amplitude of EEG component by a factor of 1/N. Therefore, the magnitude of EEG component is reduced significantly and hence these bases contain very little EEG signals. On both simulated and phantom-based artifact datasets, the unconstrained ICA decomposition failed to resolve the artifact components from the EEG components and hence the method became unstable.
Figure 7.
Bases obtained by the PCA method applied to the phantom dataset. All the three bases contain EEG signals in addition to the gradient artifacts. Model order selection is used to select the appropriate number of bases.
Figure 8.
Independent source components obtained by ICA1. These five components span the gradient artifact subspace.
Figure 9.
Independent source components obtained by ICA2. These four components span the gradient artifact subspace. The number of components to be extracted is determined using model order selection methods.
Figure 10.
The first, second and third order derivatives of an average artifact template. These derivatives together with the template span the gradient artifact subspace in Taylor series based method.
Thermal noise estimation
Table 3 shows the ratio of standard deviation of actual thermal noise (water phantom data obtained without fMRI scanning) and the estimated thermal noise by each method on spiral and EPI water phantom data. Note that wavelet denoising was not applied for this analysis. These values are close to 1 for all the methods except ICA3.
Table 3.
Ratio of standard deviation of thermal noise obtained without fMRI scanning and estimated thermal noise by each method applied on water phantom data obtained using both Spiral and EPI sequences.
| Sequences | ICA1 | ICA2 | ICA3 | AAS | PCA | TS |
|---|---|---|---|---|---|---|
| Spiral | 1.3 | 1.3 | 0.03 | 1.2 | 1.3 | 1.2 |
| EPI | 1.5 | 1.5 | 0.007 | 1.5 | 1.6 | 1.5 |
Discussion
To our knowledge, this is the first study to examine the performance of gradient artifact removal methods on simultaneous EEG-fMRI recordings obtained using spiral-in/out readout sequences at 3T. For comparison, we also applied our methods on data obtained using the EPI sequences. We propose two new temporal ICA based artifact reduction methods (ICA1 and ICA2), and show that they resolve major problems with previously published ICA-based methods. The performance of ICA1 and ICA2 was compared with the conventional temporal ICA-based (ICA3) and other non-ICA based techniques (PCA, AAS, and TS). Performance was assessed on simulated and phantom artifact derived datasets. One advantage of using these datasets is that they are free from ballistocardiogram and other physiological blood flow related artifacts. Further, simulated artifacts provide an estimate of upper bounds on the performance of each algorithm, whereas, the phantom-based artifacts provide insights about performance on more realistic gradient artifacts. Interestingly, we found that all methods, except ICA3, were able to recover ERPs with high fidelity from artifact datasets. In the case of resting EEG, our methods achieved high SNRs and better performance than all other conventional methods in the theta, alpha and beta bands. We first discuss the performance of each method and then assess the strengths and weakness of various current approaches using a common, theoretically motivated, subspace framework.
Estimation of visual ERPs
We recovered ERPs to visual checkerboard stimuli with high fidelity and SNR ~ 2 using our ICA-based methods on EEG data acquired during spiral in-out scanning. In comparison, the ICA3 algorithm failed to reproduce the original ERPs and SNR in this case was less than 0.1. All other methods showed similar levels of performance with SNR ~ 2. Performance was similar for both simulated and the more realistic phantom-based spiral datasets. In the case of EPI datasets, ICA2, AAS, PCA and TS recovered ERPs with SNR of about 2. The performance of ICA1 was poor after ICA3 compared to the other methods. Therefore, these methods are adequate for estimating ERPs from simultaneously acquired EEG-fMRI data. Surprisingly, ICA1, ICA2, PCA and TS methods that use more bases and thereby represent artifact subspace more accurately than AAS, did not improve the SNRs significantly. This suggests that a simple method such as AAS is good enough for the purposes of ERP extraction. This finding is contrasted below with the findings from the analysis of resting EEG data, wherein the accurate representation of artifact space significantly improves the quality of the estimated EEG signal.
Estimation of resting EEG
The main source of temporal variations in gradient artifacts is the asynchronous EEG and fMRI timing clocks, which causes the gradient artifact to be sampled at different time instances during different volume acquisitions. The simulated artifact dataset was designed to examine the effects of this variability. As shown in Figure 5 and Table 2A, all the subspace methods, barring ICA3, represent the temporal variations of spiral gradient artifacts adequately. However, the performance of our ICA1 and ICA2 methods was superior in all frequency ranges. Table 2A shows that the performance of ICA2 method was superior to all the other methods in theta, alpha, beta, gamma and high gamma bands. The quality of recovered signal was good even in high frequency bands. These findings are contrasted below with analysis of more realistic gradient artifacts using the phantom dataset. Importantly, this analysis provides an estimated upper bound on the achievable SNR in each frequency band. In the case of EPI artifacts also, our methods ICA1 and ICA2 performed better than the other methods as shown in Table 2B.
The temporal variations of artifacts in the phantom-based spiral and EPI datasets more realistically reflect the true gradient artifacts. As shown in Figure 6 and Table 2C, the performance of these methods deteriorates with the increase in frequency for phantom-based spiral gradient artifacts. In particular, the SNR of the recovered signals dropped below 1 in the gamma and high gamma bands. The ICA1, ICA2, AAS, TS and PCA methods are able to recover EEG signal in the frequency range 0-30 Hz, whereas, ICA3 failed to recover signal in all the frequency bands. ICA3's performance is poorer because this method was not able to distinguish artifact components from EEG components. For spiral in-out sequence, our ICA methods (ICA1 and ICA2) achieved a SNR of about 4.0 in the theta band, and 4.5 in alpha band (Table 2C). Notably, the recovery of alpha-band activity was substantially better with ICA1 and ICA2 compared to all other methods assessed here. For all methods, SNR in the alpha band was high relative to the other frequency bands, reflecting the presence of strong alpha rhythms in resting-state EEG. In the case of EPI artifacts, ICA1 and ICA2 performed marginally better than AAS, PCA and TS in the alpha band (Table 2D).
Comparison of basis vectors
The performance of PCA was found to be poorer than AAS when we included the top 3 components without model order selection. The performance improved, but still it performed poorer than AAS, when we included the number of components as estimated by the model order selection method. We found that in most of the cases, the optimal model order selected was one. Therefore, inclusion of even one extra basis vector resulted in some loss of EEG signal.
Grouiller et al (Grouiller et al., 2007) applied a spatial ICA based method for gradient artifact correction. They reported that their method performed well on simulated datasets but failed on the real EEG datasets. Our experience with ICA3, which is a temporal ICA method, was similar - it was not able to resolve artifact components from the EEG components in the phantom dataset. Its performance in resolving artifact components from EEG was also poor on our simulated dataset. On both datasets, ICA3 resulted in source components which were a mixture of both EEG and artifact components. Therefore, as with PCA, removing these components resulted in significant loss of useful EEG signals.
Both ICA1 and ICA2 circumvent theoretical problems with existing subspace based methods. In ICA2, the source components related to artifacts are determined directly from the contaminated data. We observed that ICA was not able to resolve artifact and EEG components when we tried to extract all the sources simultaneously. However, when ICA was restricted to extract only components based on model order selection, the extracted components resembled the gradient artifacts more closely. Other components, beyond those specified by our model order selection, contained both artifact and EEG components. This suggests that there is an upper limit on the maximum number of source components that can be extracted from the data, beyond which ICA cannot distinguish between artifact and EEG components. For this reason, a priori determination of the number of ICA components is very important. This explains the unstable behavior of the conventional ICA method (ICA3) which attempts to extract all the source components. The alternative algorithm, ICA1, which does not require model order estimation, can also be useful in certain cases where the estimation of model order is a problem.
Our analysis also suggests that none of these subspace methods were successful in extracting all the artifact related components. With ICA2, we can extract only components determined by the model order selection. With the AAS, ICA1 and TS methods, the subspace depends heavily on the average artifact template, and therefore high frequency components of the artifact are not accounted for. As noted above, the subspace generated by PCA contains significant EEG signals that are removed when this method is used.
Simulated versus phantom artifacts
Unlike the simulated artifact dataset, the performance on the phantom dataset was poor at frequencies at the gamma band and higher. These results suggest that the simulated artifact dataset does not represent salient temporal variations in actual artifacts. This is because the gradient artifact template is created by averaging artifact-contaminated epochs. Averaging is required to remove the EEG component but it also removes high frequency artifact components from the template. Results obtained using this dataset provides an upper limit on the usable bandwidth of the data. However, the advantage of using this artificially constructed template is that it served as a useful first pass for testing our algorithms. Good performance on this model of gradient artifacts was necessary before any further testing could be done on more realistic gradient artifacts. The advantage of the phantom dataset is that the temporal variations of gradient artifacts in EEG acquired under conditions that are more realistic. Analysis based on this dataset therefore provides more meaningful estimates of the usable bandwidth provided by each of the gradient artifact reduction methods examined in our study. Therefore our analysis suggests that these subspace methods estimate EEG signals with high fidelity only up to low frequency bands such as beta. They do not adequately remove gradient artifacts in and above gamma frequencies. It is likely that EEG-fMRI clock synchronization (Mandelkow et al., 2006)) will be essential for recovering single-trial or resting-state EEG in these high frequencies.
Thermal noise estimation
Table 3 suggests that except for ICA3, the ratio of standard deviation of actual and estimated thermal noise is close to 1. This suggests that several existing methods are effective in removing the gradient artifacts. This analysis does not, however, adequately reflect whether any signal is removed during artifact reduction. Our results (both simulated and phantom), on the other hand, provides complementary information about the EEG signal preserved by each method. Therefore, our framework for testing each method on simulated and phantom datasets provides a more effective way for reliable estimation of signal at various frequency bands and artifact reduction.
Comparison with other evaluation methods
Our approach of assessing the performance of gradient artifact reduction methods is different from that of the approach of (Ritter et al., 2007). In that approach, the simultaneous EEG-fMRI data was acquired with alternating and evenly distributed acquisition and non- acquisition epochs. The degree of artifact reduction was evaluated by comparing the spectral content of the corrected data to that of gradient artifact free segments. To assess a method's ability in preserving the signal content, the spectral content of artifact free segments before and after artifact correction was compared. In our work, a method's ability to preserve signal information was tested on simulated and phantom datasets and its ability in reducing artifacts on non wavelet denoised water phantom datasets.
Conclusion
We developed two new ICA- based methods for removal of spiral in-out gradient artifacts in EEG acquired at 3T. We show that model order selection resolves major problems with previous ICA based methods. We compared our algorithms with four other existing methods using both simulated and phantom-based gradient artifact datasets. We show that ERPs and resting EEG signals up to the beta band can be recovered with high SNR and fidelity using our new methods. In particular, our ICA based methods recovered alpha-band activity from resting-state data, with SNR > 4, which is much higher than SNRs achieved by other methods. Our methods are likely to be useful in better resolving the neural substrates of the occipital and rolandic alpha rhythms(de Munck et al., 2008, Ritter et al., 2009). Improved estimation of the temporal structure of the theta and alpha rhythms are also likely to be important for understanding the spatio-temporal organization of intrinsic brain networks (Seeley et al., 2007; Sridharan et al., 2008) and resting state connectivity (Jann et al., 2009).
Recovering resting-state signals in the gamma band and above remains a significant challenge; EEG-fMRI clock synchronization (Mandelkow et al., 2006) will be essential for recovering single-trial and resting-state EEG in these high frequencies. Our study also provides new insight into the performance of many currently used algorithms and the reasons behind the success and limitations of each approach. The methods for recovery and analysis of realistic gradient artifacts developed here are likely to be useful for principled testing and validation of artifact removal algorithms in future studies.
Supplementary Material
Acknowledgements
We thank Leeza Kondos and Rohan Dixit for assistance with data acquisition. This research was supported by NIH grants NINDS-NS058899 and NCRR-RR09784.
Footnotes
Publisher's Disclaimer: This is a PDF file of an unedited manuscript that has been accepted for publication. As a service to our customers we are providing this early version of the manuscript. The manuscript will undergo copyediting, typesetting, and review of the resulting proof before it is published in its final citable form. Please note that during the production process errors may be discovered which could affect the content, and all legal disclaimers that apply to the journal pertain.
References
- Allen P, Josephs O, Turner R. A method for removing imaging artifact from continuous EEG recorded during functional MRI. Neuroimage. 2000;12:230–239. doi: 10.1006/nimg.2000.0599. [DOI] [PubMed] [Google Scholar]
- Allen P, Polizzi G, Krakow K, Fish D, Lemieux L. Identification of EEG events in the MR scanner: the problem of pulse artifact and a method for its subtraction. Neuroimage. 1998;8:229–239. doi: 10.1006/nimg.1998.0361. [DOI] [PubMed] [Google Scholar]
- Cunningham C, Zaamout M-F, Goodyear B, Federico P. Simultaneous EEG-fMRI in human epilepsy. Can J Neurol Sci. 2008;35:420–435. doi: 10.1017/s0317167100009070. [DOI] [PubMed] [Google Scholar]
- de Munck JC, Goncalves SI, Faes TJ, Kuijer JP, Pouwels PJ, Heethaar RM, Lopes da Silva FH. A study of the brain's resting state based on alpha band power, heart rate and fMRI. Neuroimage. 2008;42:112–121. doi: 10.1016/j.neuroimage.2008.04.244. [DOI] [PubMed] [Google Scholar]
- Debener S, Strobel A, Sorger B, Peters J, Kranczioch C, Engel A, Goebel R. Improved quality of auditory event-related potentials recorded simultaneously with 3-T fMRI: removal of the ballistocardiogram artefact. Neuroimage. 2007;34:587–597. doi: 10.1016/j.neuroimage.2006.09.031. [DOI] [PubMed] [Google Scholar]
- Debener S, Ullsperger M, Siegel M, Engel A. Single-trial EEG-fMRI reveals the dynamics of cognitive function. Trends Cogn Sci. 2006;10:558–563. doi: 10.1016/j.tics.2006.09.010. [DOI] [PubMed] [Google Scholar]
- Delorme A, Sejnowski T, Makeig S. Enhanced detection of artifacts in EEG data using higher-order statistics and independent component analysis. Neuroimage. 2007;34:1443–1449. doi: 10.1016/j.neuroimage.2006.11.004. [DOI] [PMC free article] [PubMed] [Google Scholar]
- Glover GH, Law CS. Spiral-in/out BOLD fMRI for increased SNR and reduced susceptibility artifacts. Magn Reson Med. 2001;46:515–522. doi: 10.1002/mrm.1222. [DOI] [PubMed] [Google Scholar]
- Gotman J. Epileptic networks studied with EEG-fMRI. Epilepsia. 2008;49(Suppl 3):42–51. doi: 10.1111/j.1528-1167.2008.01509.x. [DOI] [PMC free article] [PubMed] [Google Scholar]
- Gotman J, Kobayashi E, Bagshaw AP, Benar CG, Dubeau F. Combining EEG and fMRI: a multimodal tool for epilepsy research. J Magn Reson Imaging. 2006;23:906–920. doi: 10.1002/jmri.20577. [DOI] [PubMed] [Google Scholar]
- Grouiller F, Vercueil L, Krainik A, Segebarth C, Kahane P, David O. A comparative study of different artefact removal algorithms for EEG signals acquired during functional MRI. Neuroimage. 2007;38:124–137. doi: 10.1016/j.neuroimage.2007.07.025. [DOI] [PubMed] [Google Scholar]
- Hamandi K, Laufs H, Noth U, Carmichael DW, Duncan JS, Lemieuxa L. BOLD and perfusion changes during epileptic generalised spike wave activity. Neuroimage. 2008;39:608–618. doi: 10.1016/j.neuroimage.2007.07.009. [DOI] [PubMed] [Google Scholar]
- Herrmann CS, Debener S. Simultaneous recording of EEG and BOLD responses: a historical perspective. Int J Psychophysiol. 2008;67:161–168. doi: 10.1016/j.ijpsycho.2007.06.006. [DOI] [PubMed] [Google Scholar]
- Hu Y, Glover G. Three-dimensional spiral technique for high-resolution functional MRI. Magn Reson Med. 2007;58:947–951. doi: 10.1002/mrm.21328. [DOI] [PubMed] [Google Scholar]
- Hyvarinen A. Fast and robust fixed-point algorithms for independent component analysis. IEEE Trans Neural Netw. 1999;10:626–634. doi: 10.1109/72.761722. [DOI] [PubMed] [Google Scholar]
- Jann K, Dierks T, Boesch C, Kottlow M, Strik W, Koenig T. BOLD correlates of EEG alpha phase-locking and the fMRI default mode network. Neuroimage. 2009;45:903–916. doi: 10.1016/j.neuroimage.2009.01.001. [DOI] [PubMed] [Google Scholar]
- Jung TP, Makeig S, Humphries C, Lee TW, McKeown MJ, Iragui V, Sejnowski TJ. Removing electroencephalographic artifacts by blind source separation. Psychophysiology. 2000;37:163–178. [PubMed] [Google Scholar]
- Laufs H. Endogenous brain oscillations and related networks detected by surface EEG-combined fMRI. Hum Brain Mapp. 2008;29:762–769. doi: 10.1002/hbm.20600. [DOI] [PMC free article] [PubMed] [Google Scholar]
- Laufs H, Daunizeau J, Carmichael DW, Kleinschmidt A. Recent advances in recording electrophysiological data simultaneously with magnetic resonance imaging. Neuroimage. 2008;40:515–528. doi: 10.1016/j.neuroimage.2007.11.039. [DOI] [PubMed] [Google Scholar]
- Laufs H, Duncan J. Electroencephalography/functional MRI in human epilepsy: what it currently can and cannot do. Curr Opin Neurol. 2007;20:417–423. doi: 10.1097/WCO.0b013e3282202b92. [DOI] [PubMed] [Google Scholar]
- LeVan P, Urrestarazu E, Gotman J. A system for automatic artifact removal in ictal scalp EEG based on independent component analysis and Bayesian classification. Clin Neurophysiol. 2006;117:912–927. doi: 10.1016/j.clinph.2005.12.013. [DOI] [PubMed] [Google Scholar]
- Makeig S, Jung TP, Bell AJ, Ghahremani D, Sejnowski TJ. Blind separation of auditory event-related brain responses into independent components. Proc Natl Acad Sci U S A. 1997;94:10979–10984. doi: 10.1073/pnas.94.20.10979. [DOI] [PMC free article] [PubMed] [Google Scholar]
- Mandelkow H, Halder P, Boesiger P, Brandeis D. Synchronization facilitates removal of MRI artefacts from concurrent EEG recordings and increases usable bandwidth. Neuroimage. 2006;32:1120–1126. doi: 10.1016/j.neuroimage.2006.04.231. [DOI] [PubMed] [Google Scholar]
- Mantini D, Perrucci M, Cugini S, Ferretti A, Romani G, Del Gratta C. Complete artifact removal for EEG recorded during continuous fMRI using independent component analysis. Neuroimage. 2007;34:598–607. doi: 10.1016/j.neuroimage.2006.09.037. [DOI] [PubMed] [Google Scholar]
- Menon V, Crottaz-Herbette S. Combined EEG and fMRI studies of human brain function. Int Rev Neurobiol. 2005;66:291–321. doi: 10.1016/S0074-7742(05)66010-2. [DOI] [PubMed] [Google Scholar]
- Minka T. Automatic choice of dimensionality for PCA. MIT, Tech. Rep. 2000 [Google Scholar]
- Mulert C, Pogarell O, Hegerl U. Simultaneous EEG-fMRI: Perspectives in psychiatry. Clinical Eeg and Neuroscience. 2008;39:61–64. doi: 10.1177/155005940803900207. [DOI] [PubMed] [Google Scholar]
- Negishi M, Abildgaard M, Nixon T, Constable R. Removal of time-varying gradient artifacts from EEG data acquired during continuous fMRI. Clin Neurophysiol. 2004;115:2181–2192. doi: 10.1016/j.clinph.2004.04.005. [DOI] [PubMed] [Google Scholar]
- Niazy R, Beckmann C, Iannetti G, Brady J, Smith S. Removal of FMRI environment artifacts from EEG data using optimal basis sets. Neuroimage. 2005;28:720–737. doi: 10.1016/j.neuroimage.2005.06.067. [DOI] [PubMed] [Google Scholar]
- Ritter P, Becker R, Graefe C, Villringer A. Evaluating gradient artifact correction of EEG data acquired simultaneously with fMRI. Magnetic Resonance Imaging. 2007;25:923–932. doi: 10.1016/j.mri.2007.03.005. [DOI] [PubMed] [Google Scholar]
- Ritter P, Moosmann M, Villringer A. Rolandic alpha and beta EEG rhythms' strengths are inversely related to fMRI-BOLD signal in primary somatosensory and motor cortex. Hum Brain Mapp. 2009;30:1168–1187. doi: 10.1002/hbm.20585. [DOI] [PMC free article] [PubMed] [Google Scholar]
- Ritter P, Villringer A. Simultaneous EEG-fMRI. Neurosci Biobehav Rev. 2006;30:823–838. doi: 10.1016/j.neubiorev.2006.06.008. [DOI] [PubMed] [Google Scholar]
- Sabri M, Liebenthal E, Waldron E, Medler D, Binder J. Attentional modulation in the detection of irrelevant deviance: a simultaneous ERP/fMRI study. J Cogn Neurosci. 2006;18:689–700. doi: 10.1162/jocn.2006.18.5.689. [DOI] [PMC free article] [PubMed] [Google Scholar]
- Seeley WW, Menon V, Schatzberg AF, Keller J, Glover GH, Kenna H, Reiss AL, Greicius MD. Dissociable intrinsic connectivity networks for salience processing and executive control. J Neurosci. 2007;27:2349–2356. doi: 10.1523/JNEUROSCI.5587-06.2007. [DOI] [PMC free article] [PubMed] [Google Scholar]
- Sridharan D, Levitin DJ, Menon V. A critical role for the right fronto-insular cortex in switching between central-executive and default-mode networks. Proc Natl Acad Sci U S A. 2008;105:12569–12574. doi: 10.1073/pnas.0800005105. [DOI] [PMC free article] [PubMed] [Google Scholar]
- Srivastava G, Crottaz-Herbette S, Lau K, Glover G, Menon V. ICA-based procedures for removing ballistocardiogram artifacts from EEG data acquired in the MRI scanner. Neuroimage. 2005;24:50–60. doi: 10.1016/j.neuroimage.2004.09.041. [DOI] [PubMed] [Google Scholar]
- Wan X, Iwata K, Riera J, Kitamura M, Kawashima R. Artifact reduction for simultaneous EEG/fMRI recording: adaptive FIR reduction of imaging artifacts. Clin Neurophysiol. 2006;117:681–692. doi: 10.1016/j.clinph.2005.07.025. [DOI] [PubMed] [Google Scholar]
- Wang S, Sen D, Lu W. Subband Analysis of Time Delay Estimation in STFT Domain. Proceedings of the 11th Australian International Conference on Speech Science & Technology.2006. [Google Scholar]
Associated Data
This section collects any data citations, data availability statements, or supplementary materials included in this article.


