

Abstract
Mass spectrometry-based proteomics is increasingly used to address basic and clinical questions in biomedical research through studies of differential protein expression, protein-protein interactions, and post-translational modifications. The complex structural and functional organization of the human brain warrants the application of high-throughput, systematic approaches to understand the functional alterations under normal physiological conditions and the perturbations of neurological diseases. This primer focuses on shotgun proteomics based tandem mass spectrometry for the identification of proteins in a complex mixture. It describes the basic concepts of protein differential expression analysis and post-translational modification analysis and discusses several strategies to improve the coverage of the proteome.
Introduction
The development of new technology is often a driving force for new directions in biological research. Proteomics is the study of the proteins expressed in a specific cell, tissue or organism (Wilkins et al., 1996). The availability of genome sequences for many organisms has generated databases of predicted protein sequences that are indispensable resources for mass spectrometry-based proteomics. As the in silico analysis of the human genome has refined the number of genes to about ∼22,000, it is clear that protein regulation creates functional diversity. The human body consists of roughly 250 different cell types with different temporal and spatial protein expression patterns, alternatively spliced variants, post-translational modifications (PTMs), and transient protein-protein interactions. To analyze highly complex biological samples, a widely used technology is mass spectrometry-based proteomics.
“Shotgun” proteomics is a powerful approach for identifying and quantifying proteins. In this technique, protein mixtures are converted to peptides by proteolytic digestion, and these peptides are used as surrogates for identification and quantitation of the proteins present in the original mixture (Figure 1). First, peptides are fractionated to reduce sample complexity and then ionized for tandem mass spectrometry analysis (MS/MS). The ions are mass-selected in the first stage of analysis (MS1), fragmented, and the fragmentation ions are analyzed in the second stage of mass analysis (MS2). The MS2 spectra are searched against a protein sequence database to identify the amino acid sequence of the peptides and extrapolate the identities of the proteins in the sample. The major advantage of shotgun proteomics is its ability to identify and quantify thousands of proteins in a single analysis.
Figure 1.
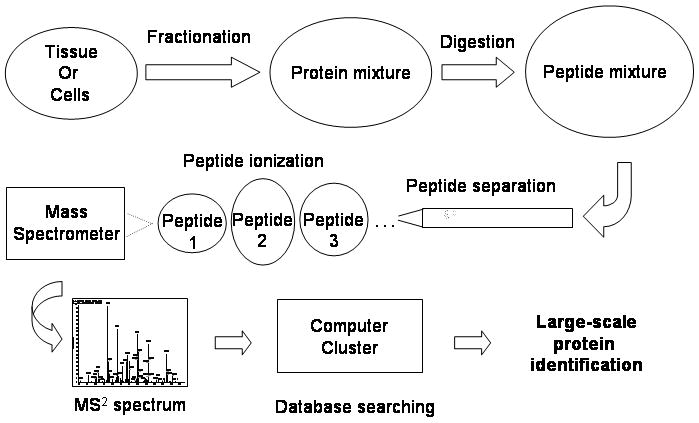
Overall strategy of shotgun proteomics. Tissues or cells are first fractionated, and then the proteins are solubilized. The protein solution is digested with a protease, usually trypsin, into peptides. The digest is fractionated to reduce the complexity. While the peptides are eluted from a liquid chromatography column, they are ionized into the mass spectrometer, and their mass is determined by a MS1 scan. Ions are further selected based on their relative abundance for fragmentation, and a MS2 scan records the masses of the fragmentation ions. The MS2 spectrum is searched against a protein database using a cluster of computers running in parallel to determine the peptide sequence and then to identify the protein.
In this article, we explain the basic principles of mass spectrometry, its use in shotgun proteomic analysis of complex protein samples, and how it has been applied in neuroscience research. We direct the reader to recent reviews for information on other useful mass spectrometry based platforms, including intact protein or “top-down” analysis (Breuker et al., 2008; Siuti and Kelleher, 2007), peptide mass fingerprinting (Thiede et al., 2005), MALDI imaging (Cornett et al., 2007; Wisztorski et al., 2008), lipidomics (Piomelli et al., 2007) and metabolomics (Want et al., 2007). Finally, we would like to emphasis that before beginning shotgun experiments in the nervous system, a researcher must consider the issues of the experimental design, sample quantity and purity, the large amount of data that will likely be obtained, and the bioinformatic approaches that will be used to the analyze the data.
Experimental Design
An important aspect of proteomic experiments is the experimental design. Numerous methods have been developed to address the needs of specific experiments, and in this section, we provide a guide to common proteomic experiments. How an experiment is performed, what controls are used, and what parameters should be used in data analysis are dependent on the questions being asked. Sample preparation will depend on the complexity of the protein mixture. An experiment to measure protein expression changes as a result of cell surface receptor activation requires an approach that covers a large fraction of the proteome. In contrast, identification of a protein complex does not require analysis of a highly complex mixture of proteins. However, shotgun proteomics is not always a preferred approach. For example, shotgun proteomics is only useful if a complex is able to be purified to sufficient quantity. If changes in the expression level of one individual protein are sought and an antibody is available, shotgun proteomics would not offer an advantage, but could provide a secondary and more accurate means of quantitation.
Sample Requirements
The first question that arises when designing a proteomic experiment is the amount of protein required for MS/MS analysis. A general rule of thumb is that if a sample can be detected by silver stain on a gel (equivalent to a few nanograms of protein), it can be detected by a mass spectrometer. With MudPIT analysis (described below), 100 μg total brain homogenate can yield more than 2000 non-redundant protein identifications (Chen et al., 2008a). When specific fractions or small brain regions, such as the synaptosomal fraction or the amygdala, are investigated, the required number of animals increases. Thus, there are continuing efforts to generate more data from less starting material. For example, Nielsen et al. have developed a novel extraction scheme to comprehensively analyze plasma membranes from a single mouse hippocampus (Nielsen et al., 2005).
When isolating a specific complex or organelle, the sample purity is critical. Common co-purified abundant proteins can obscure the identification of components of the targeted complex or organelle. Before mass spectrometry analysis, the purity of the complex must be verified by methods such as Western blot analysis or enzymatic assays. Experiments should also be performed to demonstrate the exclusion of contaminants. For example, a nuclear isolation should have greater immunoreactivity for nuclear markers in Western blot analysis, and just as important, should have a decrease of cytosolic markers compared to a total lysate. Since MS/MS analysis is a global analysis, it is a better indicator of sample purity than many traditional biochemical analyses and may be used to optimize purification methods. If a protein or a group of proteins is the aim of a study, specific immunological or affinity methods can be used to enrich and purify the target proteins of interest. Immunoprecipitation (Ransone, 1995; Lindstrom et al., 2003), or more stringent method such as tandem-affinity purification (TAP) (Rigaut et al., 1999), have made important contributions to study the structure and function of the nervous system (Chen et al., 2008b; Gottschalk et al., 2005). Such methods specifically capture the proteins interacting with the target protein, when combined with shotgun proteomics they tend to provide lists of protein identifications with many potential true targets. But for immunoprecipitation, a number of non-specific, contaminant proteins are also likely to be included. By including a control sample with the target protein “knockout”, or a non-specific IgG control in immunoprecipitation experiments, many contaminants can be eliminated. By fusing two affinity tags in tandem to the target protein, and expressing the fusion construct into the host cells, this two-step affinity purification procedure not only greatly reduces contaminant proteins, but also allows the efficient elution of the target protein with its interaction partners. Alternatively, subtractive analysis techniques and stable isotope labeling (see Quantitation) have been employed to discriminate between contaminants and true components of the desired complex (Blagoev et al., 2003; Chu et al., 2006; de Hoog et al., 2004; Schirmer et al., 2003).
Enzymatic Digestion
Although there are many different proteolytic enzymes available, trypsin is the most commonly employed. It is highly specific, cleaving at the carboxyl terminus of arginine and lysine residues. Since these are abundant residues, almost all proteins of the proteome will possess multiple tryptic peptides. The peptides vary in length, ranging from a few to greater than forty residues, averaging nine to ten residues (Elias and Gygi, 2007). One potential obstacle with the analysis of biological samples is that common detergents (e.g. triton or SDS), salts, phosphate or sulfate buffers, and polyethylene glycols are incompatible with mass spectrometry analysis. They can hinder the enzymatic digestion, peptide ionization, and chromatography separation (Bosserhoff et al., 1989; Loo et al., 1994; Vissers et al., 1996). To remove these contaminants, samples can be precipitated or dialyzed before MS/MS analysis. To solubilize proteins for enzymatic digestion, chaotropic agents, usually urea or guanidine hydrochloride, are used instead of detergents. The drawback of these chaotropic reagents is that they can inhibit protease activity at the concentration required for efficient protein denaturation and solubilization (Rajagopalan et al., 1961). To overcome this problem, the concentration of these reagents can be reduced by dilution before the addition of the protease.
Membrane proteins are underrepresented in most proteomic analyses unless specific protocols are applied (Speers and Wu, 2007). One challenge for the analysis of complex mixtures containing membrane proteins is to maintain solubility throughout the entire isolation and separation process. To overcome this difficulty, numerous mass spectrometry compatible detergents have been developed (Chen et al., 2007). Additionally, using alternative proteolytic enzymes, such as proteinase K (Wu et al., 2003) or chymotrypsin (Fischer et al., 2006), or chemical digestion with cyanogen bromide (Washburn et al., 2001) aids in the identification of membrane proteins. Furthermore, performing the digestion in the presence of organic solvents such as acetonitrile or methanol can aid in membrane protein identification (Blonder et al., 2002; Fischer et al., 2006; Hervey et al., 2007; Russell et al., 2001; Strader et al., 2006).
To overcome the low abundance of membrane proteins, membrane enrichment strategies, including density gradient centrifugation (Nielsen et al., 2005), colloidal silica affinity (Rahbar and Fenselau, 2005; Stolz and Jacobson, 1992), and aqueous-polymer two-phase partitioning (Cao et al., 2006; Schindler et al., 2006) are used. To remove abundant soluble proteins and membrane-associated proteins, membrane fractions can be washed with buffers containing high salt. Alternatively, membranes can be incubated in a high pH buffer followed by mechanical agitation, which opens membrane vesicles into membrane sheets, releasing trapped soluble proteins (Howell and Palade, 1982; Wu et al., 2003). Many of these strategies require large amounts of starting material. Combining these enrichment and digestion strategies is the best way to increase the coverage of low abundant membrane proteins by MS analysis (Fischer et al., 2006; Nielsen et al., 2005; Speers et al., 2007). Research is still ongoing to improve the identification of membrane proteins from complex mixtures, since these proteins are important drug targets in many human diseases.
Fractionation
Due to the complexity and abundance range of proteins in cells, fractionation is essential to maximize protein identifications. Subcellular fractionation of whole tissue homogenates or isolation of specific protein complexes can reduce sample complexity and facilitate the identification of low abundance proteins. For example, a specific neuronal structure such as the post-synaptic density (PSD) will be difficult to analyze from total brain homogenate, but isolation of PSD can reduce the dynamic range and aid in protein identification. A potential disadvantage is that fractionation often requires more starting material. Here, we highlight the advantages and disadvantages of the most popular fractionation techniques. Other peptide separation schemes for mass spectrometry analysis are currently under investigation (Gilar et al., 2005; Motoyama et al., 2006; Motoyama et al., 2007; Shen et al., 2002), and it should be noted that there is no fractionation method that is clearly superior to others for all experiments and samples.
Fractionation at the Protein Level
Fractionation can be employed at the protein or peptide level. For shotgun proteomics, an optional protein fractionation step precedes peptide fractionation. Various protein fractionation techniques have been developed to reduce sample complexity, including electrophoresis, chromatography, and isoelectric focusing. Traditional two-dimensional gel electrophoresis followed by MS/MS analysis has provided a wealth of information to neuroscience (Tannu and Hemby, 2006). In this strategy, digestion of the proteins occurs in the gel, and the peptides are extracted prior to MS/MS analysis. Contaminants such as salt and detergents are removed during the procedure, minimizing their interference with MS/MS analysis, but peptides can be lost during the extraction step (Granvogl et al., 2007). The molecular weight and isoelectric point of the protein are known prior to MS/MS analysis, providing increased confidence for the identification of proteins. In addition, the density difference between gel spots can provide information regarding relative protein abundance between samples. The disadvantages include inefficiency in resolving very large (>200kD), very small (<10kD), hydrophobic, extremely acidic or basic, and low abundant proteins. Furthermore, many spots contain more than one protein, and a partially modified protein can migrate in multiple spots (Corthals et al., 2000; Fountoulakis et al., 1999a; Fountoulakis et al., 1999b; Gygi et al., 2000; Lim et al., 2003; Molloy, 2000; Oh-Ishi et al., 2000; Santoni et al., 2000). One-dimensional SDS-PAGE is also extensively used (Shevchenko et al., 2006), and since many laboratories routinely perform 1-D SDS-PAGE, this technique can be more accessible than 2-D PAGE. Recently, a clever brain fractionation method was developed, termed voxelation, which provides high resolution spatial proteome mapping (Petyuk et al., 2007). In this method, the brain is divided into tiny equal sized cubes or voxels, which are digested and subjected to peptide fractionation and MS/MS analysis.
Fractionation at peptide level
Although many types of chromatography can be employed to resolve peptides, reversed-phase (RP) chromatography is the workhorse for the analysis of peptide mixtures. RP chromatography efficiently separates peptides based on their hydrophobicity (Aguilar and Hearn, 1996; Sandra et al., 2007). Peptides are eluted directly from the chromatography column into the mass spectrometer with an increasing gradient of an organic solvent, such as acetonitrile (ACN).
If protein fractionation techniques are employed to reduce sample complexity prior to digestion, then RP chromatography can be sufficient. If a complex protein mixture (i.e. a synaptosomal fraction), however, is digested without prior protein fractionation, it can overwhelm the resolution capability of RP chromatography by co-elution of too many peptides. To meet the technical challenge of resolving thousands of peptides, the greater separation power of multidimensional liquid chromatography (LC/LC, 2-D), proposed initially by Giddings, is employed (Giddings, 1984). Here, the peak capacity of the system is a product of the peak capacities of each separation dimension, provided the coupled separation systems are orthogonal. The common choice for a second dimension orthogonal to RP is strong-cation exchange (SCX) to separate peptides based on charge. Peptides can be fractionated by SCX with increasing salt concentration, followed by separation of each SCX fraction on a RP column (Peng et al., 2003). When 2-D separation is directly connected to a mass spectrometer (“online”), it is called MudPIT (Multi-dimensional Protein Identification Technology (Yates et al., 1997). The advantage of MudPIT is that once a sample is loaded, over one hundred micrograms of a protein mixture can be efficiently separated and analyzed in 24 hours without additional sample handling, resulting in thousands of protein identifications. One advantage of the offline approach compared to online analysis is greater tolerance to detergents and salt (Wu and Han, 2006), because peptides separated by SCX can be desalted and washed extensively to remove incompatible reagents. Isoelectric focusing of peptides has also been used successfully as the first dimension followed by RP chromatography (Hey et al., 2008), and recently has been reported to be superior to protein fractionation via 1-D SDS-PAGE followed by RP chromatography (de Godoy et al., 2008). Overall, these 2-D liquid chromatography methods have greatly increased the number of identifications from complex protein mixtures.
Mass analyzers for shotgun proteomics
There are many different types of mass spectrometers (Domon and Aebersold, 2006; Payne and Glish, 2005). The fundamental principle underlying all mass spectrometers is that ion movement can be precisely controlled by an electric or magnetic field, and the controlled movement of the ions forms the basis for measuring the mass-to-charge ratio (m/z) of the ion. In general, mass spectrometers consist of an ion source, mass analyzer, detector, instrument-control software, and a data analysis system. Different combinations of these elements define the fundamental characteristics of a mass spectrometer, such as resolution, mass accuracy, and speed. Resolution describes the ability of a mass spectrometer to distinguish between the mass of one peptide (M) with another peptide (M+ΔM). Thus, the resolution of an instrument is described as M/ΔM. Mass accuracy refers to the difference between the measured mass and the true mass (theoretical mass) and is often noted in parts per million (ppm). Detecting a 1000 Da peptide to ±0.1 Da can be described as 1000.00 Da peptide to ± 100 ppm. Sensitivity and the ability to detect ions with a large dynamic range are also crucial. The dynamic range of the mass spectrometer is the magnitude between the most and least abundant ions that can be detected. To achieve high numbers of protein identifications from complex samples, a mass spectrometer with a fast scan rate is preferred for a thorough sampling of ions.
For tandem mass spectrometry, a mass spectrometer must couple two mass analyzers (tandem in space) or be capable of multiple stages of analysis (tandem in time). Quadrupole-time of flight (Q-TOF) mass spectrometers are tandem in space instruments that combine a quadrupole mass analyzer with a TOF mass analyzer. In contrast, ion trap mass spectrometers are tandem in time instruments that perform all stages of analysis within the same mass analyzer. Ion trap mass spectrometers have a dynamic range of generally three to four orders of magnitude. The linear ion trap (LIT) mass spectrometer is sensitive and possesses the fastest scan rate of any mass spectrometer (i.e. one scan in 50 ms), but it collects data at low resolution (∼2000 M/ΔM) and low mass accuracy (100-200 ppm). Q-TOF mass spectrometers are not as fast as LIT, but they have a resolving power of ∼6-10,000 M/ΔM and a mass accuracy of ∼10-20 ppm. These two instruments are complimentary in the analysis of a simple protein mixture (Elias et al., 2005).
While the LIT and Q-TOF have been the workhorses in the field of proteomics, more recent large-scale proteomic experiments involving quantitation and identification of posttranslational modifications (PTM) have used high resolution (>50,000 M/ΔM) and accurate mass (2-3 ppm) instruments. Two mass spectrometers with high resolution and mass accuracy are the Fourier transform ion cyclotron resonance mass spectrometer (FTMS) (Bogdanov and Smith, 2005) and the orbital trapping (Orbitrap) mass spectrometer (Hu et al., 2005). Both the FTMS and the Orbitrap have been used to create hybrid instruments by coupling to a LIT mass spectrometer, allowing for control over the ion population injected into the detector and enabling tandem mass spectrometry experiments (Syka et al., 2004b; Yates et al., 2006).
Protein Identification
Peptide Fragmentation
In MS/MS, there are two stages of data acquisition (Figure 2A). In the first stage, all peptide ions injected into the mass spectrometer are analyzed to obtain the m/z of each ion species. The mass spectrum containing this information is called a full scan, survey scan, or a MS1 spectrum, and the ions are called precursor ions. In the second stage, ions of interest are often selected based on the abundance of the ion signal and subjected to fragmentation by energetic collisions with an inert gas to generate fragmentation ions or product ions. This fragmentation mechanism is called collision-induced dissociation (CID) or collision activated dissociation (CAD). Cleavage occurs at each peptide bond, resulting in a series of ions differing from each other in mass by the mass of one amino acid. The m/z of the resulting fragmentation ions are recorded in the tandem mass spectra or the MS2 spectra. Ions containing the N-terminus are termed b-ions, and ions containing the C-terminus are termed y-ions. Knowing the residue mass of each amino acid and the m/z of the precursor ion, the MS2 spectrum can be used to deduce the amino acid sequence of the peptide (Figure 2B).
Figure 2.
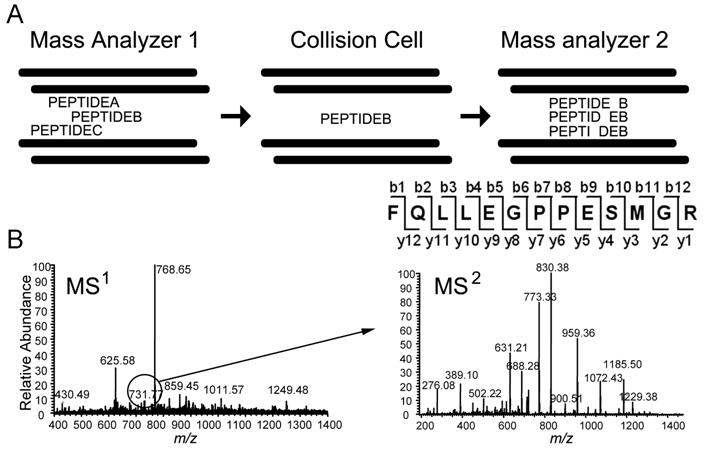
Tandem mass spectrometry. A, Schematic representation of a tandem mass spectrometer that operates using tandem by space, typical of triple-quadrupole mass spectrometer. The m/z of the ions is determined while they are passing through the first mass analyzer. Ions of a narrow mass window (e.g. +/- 0.5 amu) are selected to pass through the second quadrupole for collision-induced dissociation (CID), while other ions are rejected. Ions selected for CID are termed precursor ions. While the precursor ions are passing through the collision cell, they collide with an inert gas to induce peptide bond cleavage producing N- and C- terminal fragmentation ion series differing by one amino acid residue. The m/z values of ion series allow the deduction of peptide sequence. B, A MS1 spectrum is shown on the left. The ion species with an m/z of 731.77 was selected for CID. The resulting MS2 spectrum for this precursor ion is shown on the right. Above the MS2 spectra is the annotated fragmentation ion series. Fragments containing the C-terminus are denoted as y-ions with the C-terminus termed y1 and the C-terminus plus the next residue termed y2, and so forth. Fragments containing the N-terminus are denoted as b-ions. The m/z difference between the b- or y- ions is the residue mass of an amino acid. In both spectra, the x-axis is the m/z ratio, and the y-axis is the relative abundance.
Protein database searching
Typically, tens of thousands of MS2 spectra can be generated from a peptide mixture representing hundreds to thousands of proteins. To transform the enormous amount of MS2 spectra into the peptide sequence information, automated algorithms to search the MS2 spectra against protein sequence databases are indispensable. Popular database searching algorithms include SEQUEST (Eng et al., 1994) and Prolucid (Xu, 2006), Mascot (Perkins et al., 1999), X!Tandem (Craig and Beavis, 2004), SpectrumMill (Agilent Technologies, Santa Clara, CA, USA), OMSSA (Geer et al., 2004), and Phenyx (Colinge et al., 2003). For a complete list of publicly available software tools, detailed reviews are available (Nesvizhskii et al., 2007; Sadygov et al., 2004).
These algorithms identify potential peptide sequences from the protein sequence database based on the m/z of the precursor ion and generate theoretical MS2 spectra based on their amino acid sequences. An experimental spectrum is compared to these theoretical spectra to generate a score, and the best scoring match is selected as the most likely peptide sequence. The sequences of the identified peptides from all spectra are then used to infer the proteins present in the original protein mixture. Database-searching algorithms employ different methods for scoring the peptides to determine the best match and differ in their sensitivities and specificities. Consequently, use of multiple searching algorithms can increase protein identifications and help provide added confidence to the protein identifications (Kapp et al., 2005; Resing et al., 2004).
Confidence in protein identifications
A degree of ambiguity can be associated with peptide-spectra matches. Low abundance proteins in the sample can generate MS2 spectra with incomplete sequence ions and high levels of chemical noise. Posttranslational modifications can affect the fragmentation pattern, resulting in lower quality spectra. Finally, if the sequence information for a protein is not in the database, it is impossible to obtain a correct sequence assignment. Many of the spectra fall into this category; a peptide can be assigned for only 10-50% of the MS2 spectra collected.
Strategies to determine peptide assignment error and to filter database search results based on an acceptable error level are essential. One strategy is to require the identification of two or more peptides for a protein to be considered identified, because the probability of a protein being misidentified decreases with the increased number of peptides identified. Another strategy is to require a low false discovery rate (FDR). To estimate the FDR, both a target protein database and a decoy protein database are searched (Elias and Gygi, 2007) The decoy database is the target protein database with the sequence of each protein entry reversed or randomly shuffled. The number of peptide-spectra matches from the decoy database estimates the FDR by assuming that incorrect peptide assignments from the target and decoy databases are equally likely. Although the identities of the false discoveries are unknown, they tend to be the sequences with less than 7 amino acids (Elias and Gygi, 2007). Since lower abundance proteins are identified by fewer peptides, there is greater uncertainty in their identification. Consequently, the FDR is always decreased when more peptides are required for bona fide protein identification.
Dynamic range limits protein identifications
MS/MS analysis of a complex peptide mixture is not comprehensive, and the limited dynamic range of the mass spectrometer precludes collection of the MS2 spectra of all the peptides in the mixture (Wu and Han, 2006). This results in a semi-randomness and a bias in the identification of proteins from complex mixtures (Liu et al., 2004). Acquisition of MS/MS data is triggered by the ion abundance levels, which correspond to the abundance of the peptides in the sample. Usually, the higher abundance precursor ions in a given MS1 spectra are selected for fragmentation. Proteins have a large dynamic range; data from Saccharomyces cerevisiae reveal a range of less than 50 to more than 106 molecules per cell (Ghaemmaghami et al., 2003). It has been estimated shotgun proteomics has a dynamic range of 104-105 (de Godoy et al., 2008; Wolters et al., 2001). When a complex protein mixture was analyzed nine times by MS/MS analysis, the more abundant proteins were identified in each analysis, but the lower the abundance of a protein, the less frequently it was identified (Liu et al., 2004). Consequently, replicate analyses of a complex sample can increase the total number of proteins identified by increasing detection of lower abundance proteins.
Quantitation
Label-free quantitation
Mass spectrometry can also be used to quantify differences in protein expression between samples (relative quantitation). Both label-free and stable isotope labeling strategies are employed (for reviews, see (Bantscheff et al., 2007; Panchaud et al., 2008)). In general, label-free quantitation methods are inexpensive compared to quantitation using stable isotopes. A simple and convenient label-free method is spectral count analysis. The spectral count (SC) for a protein is the number of MS2 spectra assigned to the same protein. The sum of the SC for all the peptides of one protein is correlated to the abundance of that protein, which determines the protein's abundance index (Gao et al., 2005; Liu et al., 2004). Because the total number of spectra collected can vary between analyses, the SC of the protein is normalized. Since MS/MS analysis is skewed to the identification of highly abundant proteins, it has been suggested that SC analysis of lower abundance proteins is unreliable (Colinge et al., 2005; Liu et al., 2004; Old et al., 2005). Since SC is only correlated with protein abundance and is not a direct measurement, this strategy is semi-quantitative.
Another label-free strategy is to quantify the peptides by measuring the area under the chromatography elution peak for each peptide or the total ion current of the peptide signal from the MS1 spectrum (America and Cordewener, 2008), which indicates the abundance of the peptide in the complex. In this strategy, the peptide is tracked during the analysis using its m/z in the MS1 spectra, and a chromatographic elution profile of the peptide mass is obtained, which is called an extracted ion chromatogram (XIC). This method has been reported to be more accurate than SC analysis (Old et al., 2005) and an advantage of this technique is that a peptide does not need to be identified in all samples for it to be quantified. Once a peptide is identified in one sample, its retention time on the liquid chromatography (LC) column and its m/z is utilized to search other samples for this peptide peak. A crucial factor for constructing an accurate XIC across different samples is the reproducibility of chromatography. Fluctuations in the LC system can lead to peptide retention time shifts, but algorithms have been developed to align chromatograms by correcting for drift between analyses (Higgs et al., 2005). To minimize systematic variations in ion current ratio measurements, peak intensity can be normalized by the sum or median of ion intensities over the entire analysis (Anderle et al., 2004).
Stable Isotope quantitation
The disadvantage of label-free quantitation is that there is no measure of variation due to sample handling or peptide ionization. The use of peptides labeled with heavy stable isotopes (i.e., 2H, 13C, 15N, or 18O) as internal standards is a common strategy to prevent these variations from generating quantitation errors (Conrads et al., 2001; Oda et al., 1999). Peptides labeled with heavy stable isotopes retain the same biochemical properties (e.g. retention time) as identical peptides containing naturally abundant or light isotopes, but heavy and light peptides can be easily distinguished in a mass spectrometer (Figure 4A). Comparison of the XIC for a light peptide and its corresponding heavy peptide generates a light/heavy ratio, which can be used for relative quantitation between samples.
Figure 4.

Quantitation with stable isotopes. A, A protein sample was mixed with an identical sample except the proteins were labeled with 15N. The 14N /15N mixture was then digested, and analyzed on a LIT mass spectrometer. In the MS1 spectrum, two abundant 14N peptides (630.52 and 944.86) are observed with the corresponding 15N peptides (638.35 and 958.75). The x-axis is the m/z ratio and the y-axis is the relative abundance B, Comparison of different strategies to quantify shotgun proteomics experiments. In label-free methods, sample one (S1) and sample two (S2) are never mixed, allowing systematic errors in quantitation to arise from the numerous preparation steps. Metabolic labeling allows the mixt of samples at the earliest step in analysis, eliminating variation in sample preparation, while in vitro labeling strategies, such as ICAT and iTRAQ, control for some, but not all, possible systematic errors.
The major difference between labeling quantitation strategies is how the stable isotopes are incorporated into the peptides. One strategy is to covalently label proteins or peptides in vitro with stable isotope reagents such as ICAT (Isotope Coded Affinity Tag) (Gygi et al., 1999) or other similar reagents (Cagney and Emili, 2002; Schmidt et al., 2005; Wells et al., 2002; Zhang and Poo, 2002). Some of these reagents only label peptides containing a specific functional group, however, so only a subset of the peptides is quantifiable. For example, ICAT only labels cysteine containing peptides. Alternatively, in the presence of H2O18 or H2O16, trypsin incorporates two labeled oxygen atoms into every cleaved carboxyl termini (Shevchenko and Shevchenko, 2001; Yao et al., 2001). Another in vitro labeling reagent is iTRAQ, which allows the quantitation of up to 8 different samples simultaneously (Choe et al., 2007). Unlike other in vitro reagents, the iTRAQ reagents generate identical mass tags (isobaric tags) by reacting with primary amines (e.g. lysine side chains and the N-terminus). In the MS2 spectrum, each tag produces a different unique reporter ion at 113, 114, 115, 116, 117, 118, 119, or 121 m/z. The ratio of one reporter ion peak abundance to another represents the relative amount of a given peptide in each of the corresponding samples. Since the MS2 spectrum is used, only peptides that are successfully identified are quantifiable. Traditionally, only certain instruments, such as TOF and triple quadrupole, are capable of resolving ions in this low m/z region. Recently, an LIT-Orbitrap hybrid mass spectrometer equipped with higher-energy C-trap dissociation (HCD) was used to resolve ions in this low m/z region (Olsen et al., 2007). In addition, iTRAQ labeled peptides can be quantified on a LIT mass spectrometer employing pulse Q dissociation (PQD) (Griffin et al., 2007).
Although in vitro labeling strategies help measure and control for variation in peptide ionization, quantitation errors can still arise from variation in sample fractionation. Stable isotopes can also be introduced into organisms or cells through metabolic labeling, and overall, this approach is superior to in vitro labeling for controlling variation between biological samples. However, in vitro labeling strategies are the only option for quantitative mass spectrometry analysis of some sample types, such as those derived from patients. Introducing labels early in the sample fractionation process controls for variation in both sample preparation and peptide ionization and prevents the accumulation of systematic errors (Figure 4B). Due to the ease of introducing stable isotope labels into cultured cells, this method has become popular for metabolic labeling (Chen et al., 2000; Ong et al., 2002). Multi-cellular organisms, such as C. elegans and D. melanogaster, have also been metabolically labeled with stable isotopes introduced into their food sources (Krijgsveld et al., 2003). Furthermore, metabolic labeling has been successfully applied to primary cultured neurons (Liao et al., 2008b; Spellman et al., 2008). To perform quantitative analysis on animal models of human disease, two strategies have been developed. Ishihama et al. employed a metabolically labeled 15N Neuro2A mouse cell line as an internal standard to quantify mouse brain proteome (Ishihama et al., 2005). However, one drawback of this strategy is that the Neuro2A and brain proteomes do not completely overlap. To avoid such problems, the entire animal can be labeled with heavy isotopes using a method called SILAM (Stable Isotope LAbeling of Mammals)(Wu et al., 2004) in which the rodent is given food with a protein source enriched with 15N. This technique has been used to quantify changes in the synaptosomal fraction during postnatal development of the cerebellum (McClatchy et al., 2007). Similarly, mice have been labeled with heavy lysine instead of heavy nitrogen (Kruger et al., 2008).
Absolute quantitation
Stable isotopes can also be employed for absolute quantitation (for a review see (Bronstrup, 2004)). In this method, a known amount of heavy isotope labeled peptides is mixed with a complex peptide sample, and, protein expression is calculated by comparison to the labeled peptides (Peng et al., 2004). Alternatively, labeled proteins can be employed, which provide a better internal standard than peptides because they can be added to the sample before fractionation or digestion (Hanke et al., 2008). For the absolute quantitation of selected proteins in a complex mixture, triple quadrupole mass spectrometers and single reaction monitoring (SRM) assays are often employed for high sensitivity over a large m/z range (Anderson and Hunter, 2006; Keshishian et al., 2007).
Analysis of post-translational modifications (PTMs)
Mass spectrometry has a unique advantage in the analysis of PTMs since it directly measures the m/z of peptide ions, and in principle, is capable of detecting any mass shift due to a chemical modification. If the mass of the PTM of interest is known, the user only needs to search the MS2 spectra with the mass shift of the precursor ion. For example, a single phosphorylation of a peptide results in a mass gain of 79.9663 amu on serine, threonine or tyrosine residues (Figure 5), and a database search needs to consider the possibility that each one of the residues is modified. Two main obstacles persist for analyzing modified peptides from complex mixtures using MS/MS. First, the stoichiometry of the modified versus unmodified protein species is often low, and thus, enrichment strategies are required before MS/MS analysis. Second, PTMs can cause the fragmentation pattern to be less informative than unmodified peptides, hindering peptide identification and/or explicit identification of the modification site. Several strategies have been developed to overcome these obstacles, which are specific to the PTM being studied. Recent reviews discuss the analysis of specific PTMs: phosphorylation (Paradela and Albar, 2008), glycosylation (Zaia, 2008), and ubquitination (Peng, 2008).
Figure 5.
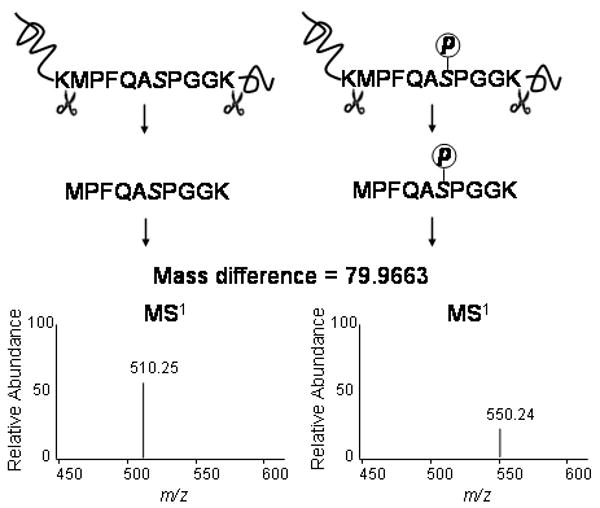
Analysis of protein phosphorylation. Similar to shotgun analysis of unmodified proteins, phosphoproteins are digested with trypsin. The addition of a phosphate group on a serine, threonine or tyrosine residues in a peptide results in an addition of mass 79.9663 amu on the peptide precursor ions. As shown in the MS1 spectra, the precursor ion 550.24 is the charge 2 ion of the peptide MPFQADPGGK (m/z 510.25) containing a phosphate group, which can be further identified through MS/MS.
Here, we review some of the common strategies for the analysis of phosphorylation by shotgun proteomics. One approach for phosphopeptide enrichment involves the covalent coupling of phosphorylated serine (pSer) and threonine (pThr) by removal of the phosphoric acid moiety through β-elimination followed by Michael addition of nucleophilic groups, such as biotin or fluorous affinity tags (Brittain et al., 2005; Klemm et al., 2004). The coupled reactive group can facilitate further affinity enrichment (Jalili and Ball, 2008) and the localization of phosphorylation sites. A popular enrichment strategy is immobilized metal ion affinity chromatography (IMAC), where phosphorylated peptides or proteins are enriched through a chelating reaction between metal ions (Fe3+, Ga3+) and the phosphate group (Andersson and Porath, 1986). Metal oxides (TiO2, ZrO2) have also been used for phosphopeptide enrichment (Kweon and Hakansson, 2006; Larsen et al., 2005) and appear to be more selective than IMAC for simple mixtures (Cantin et al., 2007; Larsen et al., 2005). Recently, metal oxide-based nanoparticles have been used with better specificity than IMAC (Chen and Chen, 2005; Tan et al., 2008). Another enrichment method employs either SCX or strong anion exchange (SAX) chromatography to separate the sample into multiple fractions and reduce sample complexity. Phosphopeptides are enriched in early eluates in SCX and in late fractions in SAX (Han et al., 2008; Villen et al., 2007). These strategies efficiently enrich for peptides containing phosphoserine and phosphothreonine, but antibodies are preferred to selectively enrich phosphotyrosine-containing peptides (Munton et al., 2007; Olsen et al., 2006; Villen et al., 2007). In general, antibodies against phosphotyrosine have good specificity and quality (Rush et al., 2005). Finally, different phosphorylation enrichment strategies are complimentary, and no single method is capable of analyzing a phosphoproteome comprehensively (Bodenmiller et al., 2007).
Phosphoester bonds at serine, threonine and to a lesser extent at tyrosine are more labile than the peptide backbone during CID, which results in the neutral loss of phosphoric acid (Beausoleil et al., 2004; DeGnore and Qin, 1998) and hampers confident identification of phosphopeptides since this neutral loss fragmentation pattern yields fewer fragment ions. Without a complete series of fragmentation ions, precise phosphorylation site localization is ambiguous when multiple serine, threonine and tyrosine residues exist within a single peptide. To further increase the confidence in phosphopeptide identifications, several algorithms have been developed to validate phosphopeptide identifications derived from the MS2 spectra. One such algorithm, Debunker, derives a probability score for phosphopeptide identifications from the MS2 spectra by analyzing prominent spectra features characteristic of phosphopeptides (Lu et al., 2007). MS/MS/MS (MS3) strategies have taken advantage of this neutral loss phenomenon to improve the identification of phosphopeptides (Beausoleil et al., 2004; Steen et al., 2001). In the MS3 strategy, the neutral loss ion (the precursor ion without phosphoric acid) is selected for further fragmentation, resulting in a more informative fragmentation pattern and higher quality identification of the phosphopeptides (Beausoleil et al., 2004).
Two other fragmentation methods have been explored to improve the peptide fragmentation by preserving the PTM on the peptide since complete or near-complete fragment ions in the MS2 spectra can dramatically improve the confidence of the peptide identification. Electron capture dissociation (ECD) involves exposure of protonated peptide ions to electrons containing near-thermal energy, producing radical cations that readily fragment to generate a complete spectrum of ions with the modification intact (Zubarev et al., 2000). Unfortunately, for commonly used mass analyzers (including the LIT and the Q-TOF), it is difficult to maintain the thermal electrons in the collision cell long enough to allow the capture of the electrons by protonated peptides, so this strategy is restricted to a FTMS. Electron transfer dissociation (ETD) is an alternative approach that can be implemented in LIT mass spectrometers (Schroeder et al., 2005; Syka et al., 2004a). In ETD, anions are used to transfer electrons onto protonated peptides, triggering the release of hydrogen radical and dissociation of peptides by a mechanism similar to ECD.
Bioinformatics
Now, hundreds to thousands of proteins have been identified, what do you do with all this data? Bioinformatic analysis of the data is a critical step of proteomic research, yet is often overlooked when designing proteomic experiments. Before collecting data, the bioinformatics analyses that will be used to interpret the data should be chosen, and this is not a trivial task for there is an almost infinite number of ways to analyze the data. A clear hypothesis will aid the researcher in the bioinformatics analysis. For example, testing the hypothesis that proteins regulating protein folding are altered in different ages of an Alzheimer's disease mouse model, will focus the analyses on a subset of the thousands of proteins that were identified in the experiments. Here, we describe data analyses that are commonly employed in proteomic experiments, and this section is not meant to be an exhaustive review. An excellent resource to generate ideas for data analysis of large data sets are published microarray reports, because many of the analyses employed in these studies are directly applicable to proteomic analyses.
Quantitation in a proteomic experiment is useful for detecting the proteins altered in an experiment. With quantified MS/MS data, the first decision is the threshold to be employed to determine an actual change in protein expression. Numerous proteomic reports have chosen arbitrary cutoffs. For example, greater than 2 fold changes in replicate experiments is generally considered as a “true” change in protein expression. Nevertheless, statistical analyses (i.e. student's t-test or ANOVA) will ensure more confidence in the observed changes. The experiment, however, must be designed appropriately, so statistics can be applied to the data. This often entails biological replicate analyses where the minimum sample number equals three. When biological replicates are not accessible, the statistical analysis can be performed on one set of biological samples using each peptide quantified for a protein as one measurement. This type of statistical analysis was successfully performed on synaptosomal preparations from the cerebellum at different developmental time points (McClatchy et al., 2007). For example, a protein is quantified by six peptides at time point 1 and is quantified by eight peptides at time point 2. Statistical analysis with uneven number of samples can be performed and allows the identification of significant alterations in the data set. Further functional analyses can focus on proteins with significant changes between biological conditions.
Another important stage of data analysis is annotation, which is often performed with GeneOntology (GO) designations (http://www.geneontology.org). GO is a controlled vocabulary describing a gene by three categories: localization, molecular function, and biological function. The majority of proteins possess multiple terms within each category, and as a result, there are caveats to how precise GO analysis can be. Only a percentage of the proteomic dataset can be annotated, because the genes for some proteins are unknown and all genes for all species have yet to be annotated. GO terms are derived from a consensus of voluntary curators, which every scientist may not agree with, and as knowledge of the proteins change, updates will often lag behind.
In the last five years, there has been an explosion of free and commercially available software to annotate proteomic datasets and perform pathway analysis. Some widely used free software programs include KEGG (Kanehisa and Goto, 2000), BioCarta (http://biocarta.com/genes), GenMAPP (Dahlquist et al., 2002) and Cytoscape (Shannon et al., 2003). In general terms, pathway analysis computes the probability that the proteins in the dataset match an annotated pathway. An advantage of these programs is that they include pathways specific to human disease, which are absent in the GO terms. Many of these programs, however, are dominated by metabolic processes, but more signaling pathways are currently being annotated, including brain specific pathways. Finally, clustering analysis is a helpful data mining procedure that can be performed on annotated and unannotated proteins. Cluster analysis is an exploratory data analysis tool that sorts proteins into groups in a way that the degree of association between two objects is maximal if they belong to the same group and minimal otherwise. For example, if a quantitative proteomic experiment is composed of four time points, cluster analysis can be used to identify proteins that have similar temporal trends. Cluster is a popular and free program for these analyses (http://rana.lbl.gov/EisenSoftware.htm).
Application of shotgun proteomics in neuroscience
As with many new techniques, shotgun proteomics has been used extensively with simpler biological systems. Nevertheless, the application of shotgun proteomics to neuroscience research is steadily increasing. Here, we discuss several studies that highlight the potential of shotgun proteomics for addressing key questions in neuroscience research.
Dissection of protein components
Large-scale identification is well suited to identify individual components of a defined neuronal structure or a protein-protein interaction complex. Many proteomic analyses of the postsynaptic density (PSD) have been reported. Initially, 1-D PAGE combined with MALDI-TOF mass spectrometry to identify 31 proteins from a PSD preparation (Walikonis et al., 2000). Over the past several years, identification of the protein components of the PSD has been expanded at a dramatic pace due to improvements in chromatographic separation, instrument sensitivity, and database searching (Jordan et al., 2004; Li Kw et al., 2003; Peng et al., 2004; Yoshimura et al., 2004). The most comprehensive analysis combined MS/MS analysis of the PSD with MS/MS analysis of the immunopurified NMDA (N-methyl-D-aspartic acid) receptor complex, the AMPA (α-amino-3-hydroxyl-5-methyl-4-isoxazole-propionate) receptor complex, and the MAGUK (membrane-associated guanylate kinase) complex. In addition, the PSD data were integrated with six published proteomics datasets to estimate a total of 1124 PSD proteins, 466 of which were identified in at least two proteomic studies (Collins et al., 2006). Several methodological differences can contribute to the low reproducibility between studies, including animal strain, brain region being analyzed, protein and peptide fractionation techniques, mass spectrometers used, and database searching algorithms. The identified PSD proteins have diverse cellular functions, such as signaling, scaffolding, translation, and transcription, and more than 10% of the identified proteins are novel. Nuclear proteins have also been localized to the PSD (Jordan et al., 2004; Moon et al., 1999), but it is unclear whether these proteins possess novel functions at the synapse, raising the question of the purity of these PSD preparations. A subtractive proteomic experiment, which has yet to be reported, is suitable to address this issue. For example, comparison of protein abundances between a PSD preparation and total brain homogenate with stable isotope labeling would suggest bona fide PSD proteins based on their quantitative enrichment in the PSD. Proteomics approaches hold similar promise for the examination of other nervous system structures. For example, shotgun proteomics was used to analyze purified hair cell bundles of the inner ear, leading to the identification of creatine kinase as a key molecule in energy homeostasis during auditory mechanosensory transduction (Shin et al., 2007).
To identify members of protein complexes, other studies start with immunoprecipitation with specific antibodies or affinity purification of tagged proteins to isolate protein components that interact with a protein of interest. For example, to study the role of the ATP-dependent chromatin remodeling complex SWI/SNF-like during brain development, antibodies against the ATPases Brg and Brm were used to purify the complex from newborn mouse brain, and the isolated complexes were subjected to ESI-MS/MS analysis (Lessard et al., 2007). Four proteins, BAF45a, BAF45b, BAF45c and BAF45d, that were not previously known to be the components of the SWI/SNF like complex were identified. Further analysis established that BAF45a and BAF53a are essential for maintaining neural stem/precursor cell self renewal and proliferation, while BAF45b, BAF45c and BAF53b are required to acquire neuronal properties, leading to the conclusion that a switch in subunit composition accompanies the transition from neural stem cells to differentiated neurons. Another study addressed how neuronal excitability is controlled by the G protein–gated potassium channel Kir3 (Lunn et al., 2007). Proteins that interact with the C-terminal domain of Kir3 were isolated from rat brain homogenate and shotgun analysis uncovered sorting nexin 27 (SNX27) as a specific and abundant interacting partner of Kir3. Functional analysis revealed that SNX27 regulates the inhibitory current mediated by Kir3 by downregulating its surface expression via increased endosomal trafficking, representing a novel mechanism for controlling surface expression of ion channels
Protein dynamics
MS/MS analysis can also provide insight into the dynamics of biological processes. For example, Moron et al. quantified changes in the hippocampal PSD after morphine administration with ICAT labeling to assess the molecular changes underlying the effects of opiates on synaptic plasticity (Mansouri et al., 1997; Pu et al., 2002). The endocytic protein clathrin showed the largest increase upon morphine treatment. After morphine treatment, the association between clathrin and homer increased, while the association between clathrin and the AMPA receptor GluR1 decreased at the PSD, suggesting that morphine treatment results in decreased GluR1 internalization. A similar study applied iTRAQ on synaptic membrane fraction to identify changes in the medial prefrontal cortex after cue-induced relapse to heroin-seeking. The authors discovered that reintroduction of the cues previously associated with heroin correlated with downregulation of AMPA receptor subunit GluR2 and upregulation of clathrin-coat assembly protein AP2m1. Subsequent experiments lead to the conclusion that GluR2 receptor endocytosis and the resulting synaptic depression might be the cause of cue-induced heroin relapse (Van den Oever et al., 2008). Together, these studies revealed that opioid induces synaptic plasticity through glutamate receptor endocytosis, suggesting new ways to manage opioid addition.
Dynamic protein turnover at synapse, including protein sorting, transport and local protein synthesis is thought to underlie the long-lasting changes in synaptic strength (Steward and Schuman, 2003; Sutton and Schuman, 2005). RNA transport from cell body to the distal dendrites and axons is the prerequisite for local protein synthesis. Elucidating the composition of the protein machineries responsible for these important processes is difficult by other methods, while shotgun proteomics-based discovery can directly shed light on these questions. Two studies used either affinity pull-down or density gradient centrifugation approach to isolate RNA transporting granule from rodent brain, followed by protein identification using mass spectrometry. The studies confirmed that the granules are transported through kinesin, and identified the protein components of the granule: RNA-transport proteins, protein synthesis machinery, and regulators for translation (Elvira et al., 2006; Kanai et al., 2004). Combined with an imaging study, the results shed light on how motor proteins transport RNAs. Another study used an elegant cell culture method to purify axons from dorsal root ganglion neurons, and applied proteomic methodology to identify proteins synthesized at axons (Willis et al., 2005)
Post-translational Modifications
Phosphorylation plays crucial roles in the development and regulation of the central nervous system. To date, the application of shotgun proteomics to analyze protein phosphorylation has been extended into many areas of the nervous system, including regulation of synaptic transmission through the activation of kinases and phosphatases (Munton et al., 2007; Trinidad et al., 2008), glutamate receptor signaling, and neural development (Ballif et al., 2004; Liao et al., 2008a), as well as neurological disorders (Zhou et al., 2008). While the focus has been on large scale identification of phosphopeptides and phosphorylation sites, an emerging trend is the quantitation of phosphorylation changes under different biological conditions. For example, Munton et al. analyzed changes in the phosphorylation of PSD components after potassium chloride stimulation of synaptosomes. They discovered an activity-dependent, isoform-specific phosphorylation of Ca2+/calmodulin-dependent protein kinase II and measured the phosphorylation stoichiometry of a novel activity-dependent phosphorylation site on GluR1 that has subsequently been shown to have a potential role in long-term potentiation (Delgado et al., 2007).
Phosphorylation analysis is also often performed on an individual protein. For example, based on prior reports that the suppression of neuronal firing by the potassium channel Kv2.1 depends upon its dephosphorylation by the protein phosphatase calcineurin, Park et al. sought to identify the relevant phosphorylation sites. They identified 16 sites, 7 of which were phosphophorylated in the rat brain and dephosphorylated by calcineurin. Mutagenesis analysis revealed that these sites are functionally additive, indicating that variable phosphorylation events allow for a graded regulation of channel gating (Park et al., 2006).
The analysis of other modifications has led to unexpected findings. For example, Khidekel et al. combined chemical derivatization, isotopic chemoenzymatic tagging and quantitative proteomics to analyze β-N-acetyl-D-glucosamine modification in proteins (O-GlcNAc glycosylation). Facilitated by ETD to precisely localize the modification sites, they discovered new glycosylated O-GlcNAc proteins and identified dynamic regulation of O-GlcNAc glycosylation of proteins upon excitatory neuronal stimulation (Khidekel et al., 2007). Protein palmitoylation has recently been recognized to have important functional implications in protein trafficking in neurons. Kang et al. applied acyl-biotin exchange (ABE) chemistry to selectively purify palmitoylated proteins from cultured rat neurons and synaptosomal membrane fractions. After MudPIT analysis, the authors identified the majority of known neural palmitoyl proteins and expanded the new pool of palmitoylated proteins by over 200. Focusing on the synaptic function of a Cdc42 splice variant after palmitoylation, the authors suggest that palmitoylation may play a broad role in activity dependent synaptic morphological changes (Kang et al., 2008).
Finally, phosphorylation, ubiquitination, and other modifications have been implicated in many neurological disorders, including Alzheimer's, Parkinson's, and Huntington's diseases (Geschwind, 2003; Chen and Feany, 2005; Shimura et al., 2000; Valera et al., 2005), and they have become the target of many proteomic analyses. Mass spectrometry has been used to identify and analyze phosphorylation sites on the insoluble microtubule associated protein tau from Alzheimer's brain tissue. Combined with kinase assays, they assigned casein kinase 1δ and glylcogen synthase kinase 3β as the predominant kinases for serine/threonine phosphorylation of tau (Hanger et al., 2007). Bennett et al. evaluated the endogenous ubiquitin-protesome system (UPS) function in Huntington's disease. They used quantitative mass spectrometry to monitor global changes in polyubiquitin conjugations after capture of polyubiquitin chain using ubiquitin-association domain. The authors discovered that lysine 48 linked polyubiquitin chain accumulated early in brains of two models of Huntington's disease (HD), as well as in brains of HD patients (Bennett et al., 2007). Lysine 6 and 11 linked polyubiquitin chains also increased in the HD mouse brain. This study provides in vivo evidence that UPS impairment is an early event accompanying HD pathogenesis.
Conclusions
Shotgun proteomics has been proven to be a driving force in neuroscience research. The advantage of analyzing thousand of proteins in a single experiment has led to the novel identification of proteins involved in brain function and provided unique insight into the nervous system.
However, there are still limitations to this technique. Foremost, the dynamic range of protein concentrations within a cell is beyond the intrinsic capability of any current mass spectrometer. Further, the identification of peptides by database searching algorithms is limited due to PTMs and alternative splicing. It has been estimated that there are over 300 PTMs in the human proteome (http://abrf.org/index.cfm/dm.home?AvgMass=all), and that at least 80% of genes are alternatively spliced (Pan et al., 2008; Wang et al., 2008). If these PTMs are not directly searched for or these alternative spliced products are not in the database, these peptides will remain unidentified. Many proteomic laboratories are currently investigating new bioinformatic, chromatographic, separation, and mass spectrometry techniques to surpass these obstacles and extract more information from smaller amounts of proteins. By using the strides made towards this goal in the last five years as an indicator, shotgun proteomics will continue to be a valuable tool for neuroscientists.
Figure 3.
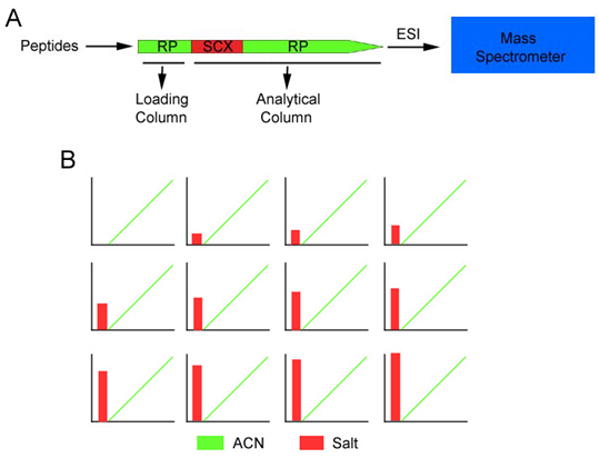
Multidimensional Protein Identification Technology (MudPIT). A, Peptides are pressure loaded onto a microcapillary column containing RP resin called the loading column followed by the analytical column containing SCX resin connected in tandem with RP resin filling the column to the 5um tip. B, Schematic of the two-dimensional liquid chromatography protocol. First, the peptides are eluted to SCX resin upon running ACN through the column. Next, increasing concentrations of salt “bumps” are applied to the column each followed by an increasing gradient of ACN. Each salt bump displaces a discrete portion of peptides from the SCX, and then is separated by the RP in the analytical column. As the peptides are eluted from the column, they are ionized by ESI and directed into the mass spectrometer.
Acknowledgments
The authors would like to acknowledge funding support from NIH grants 5R01 MH067880, P41 RR011823 and P30 NS057096.
References
- Aguilar MI, Hearn MT. High-resolution reversed-phase high-performance liquid chromatography of peptides and proteins. Methods Enzymol. 1996;270:3–26. doi: 10.1016/s0076-6879(96)70003-4. [DOI] [PubMed] [Google Scholar]
- America AH, Cordewener JH. Comparative LC-MS: a landscape of peaks and valleys. Proteomics. 2008;8:731–749. doi: 10.1002/pmic.200700694. [DOI] [PubMed] [Google Scholar]
- Anderle M, Roy S, Lin H, Becker C, Joho K. Quantifying reproducibility for differential proteomics: noise analysis for protein liquid chromatography-mass spectrometry of human serum. Bioinformatics. 2004;20:3575–3582. doi: 10.1093/bioinformatics/bth446. [DOI] [PubMed] [Google Scholar]
- Anderson L, Hunter CL. Quantitative mass spectrometric multiple reaction monitoring assays for major plasma proteins. Mol Cell Proteomics. 2006;5:573–588. doi: 10.1074/mcp.M500331-MCP200. [DOI] [PubMed] [Google Scholar]
- Andersson L, Porath J. Isolation of phosphoproteins by immobilized metal (Fe3+) affinity chromatography. Anal Biochem. 1986;154:250–254. doi: 10.1016/0003-2697(86)90523-3. [DOI] [PubMed] [Google Scholar]
- Ballif BA, Villen J, Beausoleil SA, Schwartz D, Gygi SP. Phosphoproteomic analysis of the developing mouse brain. Mol Cell Proteomics. 2004;3:1093–1101. doi: 10.1074/mcp.M400085-MCP200. [DOI] [PubMed] [Google Scholar]
- Bantscheff M, Schirle M, Sweetman G, Rick J, Kuster B. Quantitative mass spectrometry in proteomics: a critical review. Anal Bioanal Chem. 2007;389:1017–1031. doi: 10.1007/s00216-007-1486-6. [DOI] [PubMed] [Google Scholar]
- Beausoleil SA, Jedrychowski M, Schwartz D, Elias JE, Villen J, Li J, Cohn MA, Cantley LC, Gygi SP. Large-scale characterization of HeLa cell nuclear phosphoproteins. Proc Natl Acad Sci U S A. 2004;101:12130–12135. doi: 10.1073/pnas.0404720101. [DOI] [PMC free article] [PubMed] [Google Scholar]
- Bennett EJ, Shaler TA, Woodman B, Ryu KY, Zaitseva TS, Becker CH, Bates GP, Schulman H, Kopito RR. Global changes to the ubiquitin system in Huntington's disease. Nature. 2007;448:704–708. doi: 10.1038/nature06022. [DOI] [PubMed] [Google Scholar]
- Blagoev B, Kratchmarova I, Ong SE, Nielsen M, Foster LJ, Mann M. A proteomics strategy to elucidate functional protein-protein interactions applied to EGF signaling. Nat Biotechnol. 2003;21:315–318. doi: 10.1038/nbt790. [DOI] [PubMed] [Google Scholar]
- Blonder J, Goshe MB, Moore RJ, Pasa-Tolic L, Masselon CD, Lipton MS, Smith RD. Enrichment of integral membrane proteins for proteomic analysis using liquid chromatography-tandem mass spectrometry. J Proteome Res. 2002;1:351–360. doi: 10.1021/pr0255248. [DOI] [PubMed] [Google Scholar]
- Bodenmiller B, Mueller LN, Mueller M, Domon B, Aebersold R. Reproducible isolation of distinct, overlapping segments of the phosphoproteome. Nat Methods. 2007;4:231–237. doi: 10.1038/nmeth1005. [DOI] [PubMed] [Google Scholar]
- Bogdanov B, Smith RD. Proteomics by FTICR mass spectrometry: top down and bottom up. Mass Spectrom Rev. 2005;24:168–200. doi: 10.1002/mas.20015. [DOI] [PubMed] [Google Scholar]
- Bosserhoff A, Wallach J, Frank RW. Micropreparative separation of peptides derived from sodium dodecyl sulphate-solubilized proteins. J Chromatogr. 1989;473:71–77. doi: 10.1016/s0021-9673(00)91291-3. [DOI] [PubMed] [Google Scholar]
- Breuker K, Jin M, Han X, Jiang H, McLafferty FW. Top-down identification and characterization of biomolecules by mass spectrometry. J Am Soc Mass Spectrom. 2008;19:1045–1053. doi: 10.1016/j.jasms.2008.05.013. [DOI] [PMC free article] [PubMed] [Google Scholar]
- Brittain SM, Ficarro SB, Brock A, Peters EC. Enrichment and analysis of peptide subsets using fluorous affinity tags and mass spectrometry. Nat Biotechnol. 2005;23:463–468. doi: 10.1038/nbt1076. [DOI] [PubMed] [Google Scholar]
- Bronstrup M. Absolute quantification strategies in proteomics based on mass spectrometry. Expert Rev Proteomics. 2004;1:503–512. doi: 10.1586/14789450.1.4.503. [DOI] [PubMed] [Google Scholar]
- Cagney G, Emili A. De novo peptide sequencing and quantitative profiling of complex protein mixtures using mass-coded abundance tagging. Nat Biotechnol. 2002;20:163–170. doi: 10.1038/nbt0202-163. [DOI] [PubMed] [Google Scholar]
- Cantin GT, Shock TR, Park SK, Madhani HD, Yates JR., 3rd Optimizing TiO2-based phosphopeptide enrichment for automated multidimensional liquid chromatography coupled to tandem mass spectrometry. Anal Chem. 2007;79:4666–4673. doi: 10.1021/ac0618730. [DOI] [PMC free article] [PubMed] [Google Scholar]
- Cao R, Li X, Liu Z, Peng X, Hu W, Wang X, Chen P, Xie J, Liang S. Integration of a two-phase partition method into proteomics research on rat liver plasma membrane proteins. J Proteome Res. 2006;5:634–642. doi: 10.1021/pr050387a. [DOI] [PubMed] [Google Scholar]
- Chen CT, Chen YC. Fe3O4/TiO2 core/shell nanoparticles as affinity probes for the analysis of phosphopeptides using TiO2 surface-assisted laser desorption/ionization mass spectrometry. Anal Chem. 2005;77:5912–5919. doi: 10.1021/ac050831t. [DOI] [PubMed] [Google Scholar]
- Chen EI, Cociorva D, Norris JL, Yates JR., 3rd Optimization of mass spectrometry-compatible surfactants for shotgun proteomics. J Proteome Res. 2007;6:2529–2538. doi: 10.1021/pr060682a. [DOI] [PMC free article] [PubMed] [Google Scholar]
- Chen EI, McClatchy D, Park SK, Yates JR., Iii Comparisons of Mass Spectrometry Compatible Surfactants for Global Analysis of the Mammalian Brain Proteome. Anal Chem. 2008a doi: 10.1021/ac800606w. [DOI] [PMC free article] [PubMed] [Google Scholar]
- Chen L, Feany MB. Alpha-synuclein phosphorylation controls neurotoxicity and inclusion formation in a Drosophila model of Parkinson disease. Nat Neurosci. 2005;8:657–663. doi: 10.1038/nn1443. [DOI] [PubMed] [Google Scholar]
- Chen N, Onisko B, Napoli JL. The nuclear transcription factor RARalpha associates with neuronal RNA granules and suppresses translation. J Biol Chem. 2008b;283:20841–20847. doi: 10.1074/jbc.M802314200. [DOI] [PMC free article] [PubMed] [Google Scholar]
- Chen X, Smith LM, Bradbury EM. Site-specific mass tagging with stable isotopes in proteins for accurate and efficient protein identification. Anal Chem. 2000;72:1134–1143. doi: 10.1021/ac9911600. [DOI] [PubMed] [Google Scholar]
- Choe L, D'Ascenzo M, Relkin NR, Pappin D, Ross P, Williamson B, Guertin S, Pribil P, Lee KH. 8-plex quantitation of changes in cerebrospinal fluid protein expression in subjects undergoing intravenous immunoglobulin treatment for Alzheimer's disease. Proteomics. 2007;7:3651–3660. doi: 10.1002/pmic.200700316. [DOI] [PMC free article] [PubMed] [Google Scholar]
- Chu DS, Liu H, Nix P, Wu TF, Ralston EJ, Yates JR, 3rd, Meyer BJ. Sperm chromatin proteomics identifies evolutionarily conserved fertility factors. Nature. 2006;443:101–105. doi: 10.1038/nature05050. [DOI] [PMC free article] [PubMed] [Google Scholar]
- Colinge J, Chiappe D, Lagache S, Moniatte M, Bougueleret L. Differential proteomics via probabilistic peptide identification scores. Anal Chem. 2005;77:596–606. doi: 10.1021/ac0488513. [DOI] [PubMed] [Google Scholar]
- Colinge J, Masselot A, Giron M, Dessingy T, Magnin J. OLAV: towards high-throughput tandem mass spectrometry data identification. Proteomics. 2003;3:1454–1463. doi: 10.1002/pmic.200300485. [DOI] [PubMed] [Google Scholar]
- Collins MO, Husi H, Yu L, Brandon JM, Anderson CN, Blackstock WP, Choudhary JS, Grant SG. Molecular characterization and comparison of the components and multiprotein complexes in the postsynaptic proteome. J Neurochem. 2006;97 1:16–23. doi: 10.1111/j.1471-4159.2005.03507.x. [DOI] [PubMed] [Google Scholar]
- Conrads TP, Alving K, Veenstra TD, Belov ME, Anderson GA, Anderson DJ, Lipton MS, Pasa-Tolic L, Udseth HR, Chrisler WB, et al. Quantitative analysis of bacterial and mammalian proteomes using a combination of cysteine affinity tags and 15N-metabolic labeling. Anal Chem. 2001;73:2132–2139. doi: 10.1021/ac001487x. [DOI] [PubMed] [Google Scholar]
- Cornett DS, Reyzer ML, Chaurand P, Caprioli RM. MALDI imaging mass spectrometry: molecular snapshots of biochemical systems. Nat Methods. 2007;4:828–833. doi: 10.1038/nmeth1094. [DOI] [PubMed] [Google Scholar]
- Corthals GL, Wasinger VC, Hochstrasser DF, Sanchez JC. The dynamic range of protein expression: a challenge for proteomic research. Electrophoresis. 2000;21:1104–1115. doi: 10.1002/(SICI)1522-2683(20000401)21:6<1104::AID-ELPS1104>3.0.CO;2-C. [DOI] [PubMed] [Google Scholar]
- Craig R, Beavis RC. TANDEM: matching proteins with tandem mass spectra. Bioinformatics. 2004;20:1466–1467. doi: 10.1093/bioinformatics/bth092. [DOI] [PubMed] [Google Scholar]
- Dahlquist KD, Salomonis N, Vranizan K, Lawlor SC, Conklin BR. GenMAPP, a new tool for viewing and analyzing microarray data on biological pathways. Nat Genet. 2002;31:19–20. doi: 10.1038/ng0502-19. [DOI] [PubMed] [Google Scholar]
- de Godoy LM, Olsen JV, Cox J, Nielsen ML, Hubner NC, Frohlich F, Walther TC, Mann M. Comprehensive mass-spectrometry-based proteome quantification of haploid versus diploid yeast. Nature. 2008;455:1251–1254. doi: 10.1038/nature07341. [DOI] [PubMed] [Google Scholar]
- de Hoog CL, Foster LJ, Mann M. RNA and RNA binding proteins participate in early stages of cell spreading through spreading initiation centers. Cell. 2004;117:649–662. doi: 10.1016/s0092-8674(04)00456-8. [DOI] [PubMed] [Google Scholar]
- DeGnore JP, Qin J. Fragmentation of phosphopeptides in an ion trap mass spectrometer. J Am Soc Mass Spectrom. 1998;9:1175–1188. doi: 10.1016/S1044-0305(98)00088-9. [DOI] [PubMed] [Google Scholar]
- Delgado JY, Coba M, Anderson CN, Thompson KR, Gray EE, Heusner CL, Martin KC, Grant SG, O'Dell TJ. NMDA receptor activation dephosphorylates AMPA receptor glutamate receptor 1 subunits at threonine 840. J Neurosci. 2007;27:13210–13221. doi: 10.1523/JNEUROSCI.3056-07.2007. [DOI] [PMC free article] [PubMed] [Google Scholar]
- Domon B, Aebersold R. Mass spectrometry and protein analysis. Science. 2006;312:212–217. doi: 10.1126/science.1124619. [DOI] [PubMed] [Google Scholar]
- Elias JE, Gygi SP. Target-decoy search strategy for increased confidence in large-scale protein identifications by mass spectrometry. Nat Methods. 2007;4:207–214. doi: 10.1038/nmeth1019. [DOI] [PubMed] [Google Scholar]
- Elias JE, Haas W, Faherty BK, Gygi SP. Comparative evaluation of mass spectrometry platforms used in large-scale proteomics investigations. Nat Methods. 2005;2:667–675. doi: 10.1038/nmeth785. [DOI] [PubMed] [Google Scholar]
- Elvira G, Wasiak S, Blandford V, Tong XK, Serrano A, Fan X, del Rayo Sanchez-Carbente M, Servant F, Bell AW, Boismenu D, et al. Characterization of an RNA granule from developing brain. Mol Cell Proteomics. 2006;5:635–651. doi: 10.1074/mcp.M500255-MCP200. [DOI] [PubMed] [Google Scholar]
- Eng J, McCormack AL, Yates JR., 3rd An approach to correlate tandem mass spectral data of peptides with amino acid sequences in a protein database. J Am Soc Mass Spectrom. 1994;5:976–989. doi: 10.1016/1044-0305(94)80016-2. [DOI] [PubMed] [Google Scholar]
- Fischer F, Wolters D, Rogner M, Poetsch A. Toward the complete membrane proteome: high coverage of integral membrane proteins through transmembrane peptide detection. Mol Cell Proteomics. 2006;5:444–453. doi: 10.1074/mcp.M500234-MCP200. [DOI] [PubMed] [Google Scholar]
- Fountoulakis M, Takacs MF, Berndt P, Langen H, Takacs B. Enrichment of low abundance proteins of Escherichia coli by hydroxyapatite chromatography. Electrophoresis. 1999a;20:2181–2195. doi: 10.1002/(SICI)1522-2683(19990801)20:11<2181::AID-ELPS2181>3.0.CO;2-Q. [DOI] [PubMed] [Google Scholar]
- Fountoulakis M, Takacs MF, Takacs B. Enrichment of low-copy-number gene products by hydrophobic interaction chromatography. J Chromatogr A. 1999b;833:157–168. doi: 10.1016/s0021-9673(98)00929-7. [DOI] [PubMed] [Google Scholar]
- Gao J, Friedrichs MS, Dongre AR, Opiteck GJ. Guidelines for the routine application of the peptide hits technique. J Am Soc Mass Spectrom. 2005;16:1231–1238. doi: 10.1016/j.jasms.2004.12.002. [DOI] [PubMed] [Google Scholar]
- Geer LY, Markey SP, Kowalak JA, Wagner L, Xu M, Maynard DM, Yang X, Shi W, Bryant SH. Open mass spectrometry search algorithm. J Proteome Res. 2004;3:958–964. doi: 10.1021/pr0499491. [DOI] [PubMed] [Google Scholar]
- Geschwind DH. Tau phosphorylation, tangles, and neurodegeneration: the chicken or the egg? Neuron. 2003;40:457–460. doi: 10.1016/s0896-6273(03)00681-0. [DOI] [PubMed] [Google Scholar]
- Ghaemmaghami S, Huh WK, Bower K, Howson RW, Belle A, Dephoure N, O'Shea EK, Weissman JS. Global analysis of protein expression in yeast. Nature. 2003;425:737–741. doi: 10.1038/nature02046. [DOI] [PubMed] [Google Scholar]
- Giddings JC. Two-dimensional separations: concept and promise. Anal Chem. 1984;56:1258A–1260A. doi: 10.1021/ac00276a003. 1262A, 1264A passim. [DOI] [PubMed] [Google Scholar]
- Gilar M, Olivova P, Daly AE, Gebler JC. Orthogonality of separation in two-dimensional liquid chromatography. Anal Chem. 2005;77:6426–6434. doi: 10.1021/ac050923i. [DOI] [PubMed] [Google Scholar]
- Gottschalk A, Almedom RB, Schedletzky T, Anderson SD, Yates JR, 3rd, Schafer WR. Identification and characterization of novel nicotinic receptor-associated proteins in Caenorhabditis elegans. EMBO J. 2005;24:2566–2578. doi: 10.1038/sj.emboj.7600741. [DOI] [PMC free article] [PubMed] [Google Scholar]
- Granvogl B, Ploscher M, Eichacker LA. Sample preparation by in-gel digestion for mass spectrometry-based proteomics. Anal Bioanal Chem. 2007;389:991–1002. doi: 10.1007/s00216-007-1451-4. [DOI] [PubMed] [Google Scholar]
- Griffin TJ, Xie H, Bandhakavi S, Popko J, Mohan A, Carlis JV, Higgins L. iTRAQ reagent-based quantitative proteomic analysis on a linear ion trap mass spectrometer. J Proteome Res. 2007;6:4200–4209. doi: 10.1021/pr070291b. [DOI] [PMC free article] [PubMed] [Google Scholar]
- Gygi SP, Corthals GL, Zhang Y, Rochon Y, Aebersold R. Evaluation of two-dimensional gel electrophoresis-based proteome analysis technology. Proc Natl Acad Sci U S A. 2000;97:9390–9395. doi: 10.1073/pnas.160270797. [DOI] [PMC free article] [PubMed] [Google Scholar]
- Gygi SP, Rist B, Gerber SA, Turecek F, Gelb MH, Aebersold R. Quantitative analysis of complex protein mixtures using isotope-coded affinity tags. Nat Biotechnol. 1999;17:994–999. doi: 10.1038/13690. [DOI] [PubMed] [Google Scholar]
- Han G, Ye M, Zhou H, Jiang X, Feng S, Tian R, Wan D, Zou H, Gu J. Large-scale phosphoproteome analysis of human liver tissue by enrichment and fractionation of phosphopeptides with strong anion exchange chromatography. Proteomics. 2008;8:1346–1361. doi: 10.1002/pmic.200700884. [DOI] [PubMed] [Google Scholar]
- Hanger DP, Byers HL, Wray S, Leung KY, Saxton MJ, Seereeram A, Reynolds CH, Ward MA, Anderton BH. Novel phosphorylation sites in tau from Alzheimer brain support a role for casein kinase 1 in disease pathogenesis. J Biol Chem. 2007;282:23645–23654. doi: 10.1074/jbc.M703269200. [DOI] [PubMed] [Google Scholar]
- Hanke S, Besir H, Oesterhelt D, Mann M. Absolute SILAC for Accurate Quantitation of Proteins in Complex Mixtures Down to the Attomole Level. J Proteome Res. 2008;7:1118–1130. doi: 10.1021/pr7007175. [DOI] [PubMed] [Google Scholar]
- Hervey WJt, Strader MB, Hurst GB. Comparison of digestion protocols for microgram quantities of enriched protein samples. J Proteome Res. 2007;6:3054–3061. doi: 10.1021/pr070159b. [DOI] [PubMed] [Google Scholar]
- Hey J, Posch A, Cohen A, Liu N, Harbers A. Fractionation of complex protein mixtures by liquid-phase isoelectric focusing. Methods Mol Biol. 2008;424:225–239. doi: 10.1007/978-1-60327-064-9_19. [DOI] [PubMed] [Google Scholar]
- Higgs RE, Knierman MD, Gelfanova V, Butler JP, Hale JE. Comprehensive label-free method for the relative quantification of proteins from biological samples. J Proteome Res. 2005;4:1442–1450. doi: 10.1021/pr050109b. [DOI] [PubMed] [Google Scholar]
- Howell KE, Palade GE. Hepatic Golgi fractions resolved into membrane and content subfractions. J Cell Biol. 1982;92:822–832. doi: 10.1083/jcb.92.3.822. [DOI] [PMC free article] [PubMed] [Google Scholar]
- Hu Q, Noll RJ, Li H, Makarov A, Hardman M, Graham Cooks R. The Orbitrap: a new mass spectrometer. J Mass Spectrom. 2005;40:430–443. doi: 10.1002/jms.856. [DOI] [PubMed] [Google Scholar]
- Ishihama Y, Sato T, Tabata T, Miyamoto N, Sagane K, Nagasu T, Oda Y. Quantitative mouse brain proteomics using culture-derived isotope tags as internal standards. Nat Biotechnol. 2005;23:617–621. doi: 10.1038/nbt1086. [DOI] [PubMed] [Google Scholar]
- Jalili PR, Ball HL. Novel Reversible Biotinylated Probe for the Selective Enrichment of Phosphorylated Peptides from Complex Mixtures. J Am Soc Mass Spectrom. 2008 doi: 10.1016/j.jasms.2008.02.004. [DOI] [PubMed] [Google Scholar]
- Jordan BA, Fernholz BD, Boussac M, Xu C, Grigorean G, Ziff EB, Neubert TA. Identification and verification of novel rodent postsynaptic density proteins. Mol Cell Proteomics. 2004;3:857–871. doi: 10.1074/mcp.M400045-MCP200. [DOI] [PubMed] [Google Scholar]
- Kanai Y, Dohmae N, Hirokawa N. Kinesin transports RNA: isolation and characterization of an RNA-transporting granule. Neuron. 2004;43:513–525. doi: 10.1016/j.neuron.2004.07.022. [DOI] [PubMed] [Google Scholar]
- Kanehisa M, Goto S. KEGG: kyoto encyclopedia of genes and genomes. Nucleic Acids Res. 2000;28:27–30. doi: 10.1093/nar/28.1.27. [DOI] [PMC free article] [PubMed] [Google Scholar]
- Kang R, Wan J, Arstikaitis P, Takahashi H, Huang K, Bailey AO, Thompson JX, Roth AF, Drisdel RC, Mastro R, et al. Neural palmitoyl-proteomics reveals dynamic synaptic palmitoylation. Nature. 2008;456:904–909. doi: 10.1038/nature07605. [DOI] [PMC free article] [PubMed] [Google Scholar]
- Kapp EA, Schutz F, Connolly LM, Chakel JA, Meza JE, Miller CA, Fenyo D, Eng JK, Adkins JN, Omenn GS, Simpson RJ. An evaluation, comparison, and accurate benchmarking of several publicly available MS/MS search algorithms: sensitivity and specificity analysis. Proteomics. 2005;5:3475–3490. doi: 10.1002/pmic.200500126. [DOI] [PubMed] [Google Scholar]
- Keshishian H, Addona T, Burgess M, Kuhn E, Carr SA. Quantitative, multiplexed assays for low abundance proteins in plasma by targeted mass spectrometry and stable isotope dilution. Mol Cell Proteomics. 2007;6:2212–2229. doi: 10.1074/mcp.M700354-MCP200. [DOI] [PMC free article] [PubMed] [Google Scholar]
- Khidekel N, Ficarro SB, Clark PM, Bryan MC, Swaney DL, Rexach JE, Sun YE, Coon JJ, Peters EC, Hsieh-Wilson LC. Probing the dynamics of O-GlcNAc glycosylation in the brain using quantitative proteomics. Nat Chem Biol. 2007;3:339–348. doi: 10.1038/nchembio881. [DOI] [PubMed] [Google Scholar]
- Klemm C, Schroder S, Gluckmann M, Beyermann M, Krause E. Derivatization of phosphorylated peptides with S- and N-nucleophiles for enhanced ionization efficiency in matrix-assisted laser desorption/ionization mass spectrometry. Rapid Commun Mass Spectrom. 2004;18:2697–2705. doi: 10.1002/rcm.1676. [DOI] [PubMed] [Google Scholar]
- Krijgsveld J, Ketting RF, Mahmoudi T, Johansen J, Artal-Sanz M, Verrijzer CP, Plasterk RH, Heck AJ. Metabolic labeling of C. elegans and D. melanogaster for quantitative proteomics. Nat Biotechnol. 2003;21:927–931. doi: 10.1038/nbt848. [DOI] [PubMed] [Google Scholar]
- Kruger M, Moser M, Ussar S, Thievessen I, Luber CA, Forner F, Schmidt S, Zanivan S, Fassler R, Mann M. SILAC mouse for quantitative proteomics uncovers kindlin-3 as an essential factor for red blood cell function. Cell. 2008;134:353–364. doi: 10.1016/j.cell.2008.05.033. [DOI] [PubMed] [Google Scholar]
- Kweon HK, Hakansson K. Selective zirconium dioxide-based enrichment of phosphorylated peptides for mass spectrometric analysis. Anal Chem. 2006;78:1743–1749. doi: 10.1021/ac0522355. [DOI] [PubMed] [Google Scholar]
- Larsen MR, Thingholm TE, Jensen ON, Roepstorff P, Jorgensen TJ. Highly selective enrichment of phosphorylated peptides from peptide mixtures using titanium dioxide microcolumns. Mol Cell Proteomics. 2005;4:873–886. doi: 10.1074/mcp.T500007-MCP200. [DOI] [PubMed] [Google Scholar]
- Lessard J, Wu JI, Ranish JA, Wan M, Winslow MM, Staahl BT, Wu H, Aebersold R, Graef IA, Crabtree GR. An essential switch in subunit composition of a chromatin remodeling complex during neural development. Neuron. 2007;55:201–215. doi: 10.1016/j.neuron.2007.06.019. [DOI] [PMC free article] [PubMed] [Google Scholar]
- Li Kw, Hornshaw MP, Van Der Schors RC, Watson R, Tate S, Casetta B, Jimenez CR, Gouwenberg Y, Gundelfinger ED, Smalla KH, Smit AB. Proteomics analysis of rat brain postsynaptic density: Implications of the diverse protein functional groups for the integration of synaptic physiology. J Biol Chem. 2003 doi: 10.1074/jbc.M303116200. [DOI] [PubMed] [Google Scholar]
- Liao L, McClatchy DB, Park SK, Xu T, Lu B, Yates JR., 3rd Quantitative analysis of brain nuclear phosphoproteins identifies developmentally regulated phosphorylation events. J Proteome Res. 2008a;7:4743–4755. doi: 10.1021/pr8003198. [DOI] [PMC free article] [PubMed] [Google Scholar]
- Liao L, Park SK, Xu T, Vanderklish P, Yates JR., 3rd Quantitative proteomic analysis of primary neurons reveals diverse changes in synaptic protein content in fmr1 knockout mice. Proc Natl Acad Sci U S A. 2008b;105:15281–15286. doi: 10.1073/pnas.0804678105. [DOI] [PMC free article] [PubMed] [Google Scholar]
- Lim H, Eng J, Yates JR, 3rd, Tollaksen SL, Giometti CS, Holden JF, Adams MW, Reich CI, Olsen GJ, Hays LG. Identification of 2D-gel proteins: a comparison of MALDI/TOF peptide mass mapping to mu LC-ESI tandem mass spectrometry. J Am Soc Mass Spectrom. 2003;14:957–970. doi: 10.1016/s1044-0305(03)00144-2. [DOI] [PubMed] [Google Scholar]
- Lindstrom DL, Squazzo SL, Muster N, Burckin TA, Wachter KC, Emigh CA, McCleery JA, Yates JR, 3rd, Hartzog GA. Dual roles for Spt5 in pre-mRNA processing and transcription elongation revealed by identification of Spt5-associated proteins. Mol Cell Biol. 2003;23:1368–1378. doi: 10.1128/MCB.23.4.1368-1378.2003. [DOI] [PMC free article] [PubMed] [Google Scholar]
- Liu H, Sadygov RG, Yates JR., 3rd A model for random sampling and estimation of relative protein abundance in shotgun proteomics. Anal Chem. 2004;76:4193–4201. doi: 10.1021/ac0498563. [DOI] [PubMed] [Google Scholar]
- Loo RR, Dales N, Andrews PC. Surfactant effects on protein structure examined by electrospray ionization mass spectrometry. Protein Sci. 1994;3:1975–1983. doi: 10.1002/pro.5560031109. [DOI] [PMC free article] [PubMed] [Google Scholar]
- Lu B, Ruse C, Xu T, Park SK, Yates J., 3rd Automatic validation of phosphopeptide identifications from tandem mass spectra. Anal Chem. 2007;79:1301–1310. doi: 10.1021/ac061334v. [DOI] [PMC free article] [PubMed] [Google Scholar]
- Lunn ML, Nassirpour R, Arrabit C, Tan J, McLeod I, Arias CM, Sawchenko PE, Yates JR, 3rd, Slesinger PA. A unique sorting nexin regulates trafficking of potassium channels via a PDZ domain interaction. Nat Neurosci. 2007;10:1249–1259. doi: 10.1038/nn1953. [DOI] [PubMed] [Google Scholar]
- Mansouri FA, Motamedi F, Fathollahi Y, Atapour N, Semnanian S. Augmentation of LTP induced by primed-bursts tetanic stimulation in hippocampal CA1 area of morphine dependent rats. Brain Res. 1997;769:119–124. doi: 10.1016/s0006-8993(97)00608-2. [DOI] [PubMed] [Google Scholar]
- McClatchy DB, Liao L, Park SK, Venable JD, Yates JR. Quantification of the synaptosomal proteome of the rat cerebellum during post-natal development. Genome Res. 2007;17:1378–1388. doi: 10.1101/gr.6375007. [DOI] [PMC free article] [PubMed] [Google Scholar]
- Molloy MP. Two-dimensional electrophoresis of membrane proteins using immobilized pH gradients. Anal Biochem. 2000;280:1–10. doi: 10.1006/abio.2000.4514. [DOI] [PubMed] [Google Scholar]
- Moon JI, Jung YW, Ko BH, De Pinto V, Jin I, Moon IS. Presence of a voltage-dependent anion channel 1 in the rat postsynaptic density fraction. Neuroreport. 1999;10:443–447. doi: 10.1097/00001756-199902250-00001. [DOI] [PubMed] [Google Scholar]
- Motoyama A, Venable JD, Ruse CI, Yates JR., 3rd Automated ultra-high-pressure multidimensional protein identification technology (UHP-MudPIT) for improved peptide identification of proteomic samples. Anal Chem. 2006;78:5109–5118. doi: 10.1021/ac060354u. [DOI] [PubMed] [Google Scholar]
- Motoyama A, Xu T, Ruse CI, Wohlschlegel JA, Yates JR., 3rd Anion and cation mixed-bed ion exchange for enhanced multidimensional separations of peptides and phosphopeptides. Anal Chem. 2007;79:3623–3634. doi: 10.1021/ac062292d. [DOI] [PMC free article] [PubMed] [Google Scholar]
- Munton RP, Tweedie-Cullen R, Livingstone-Zatchej M, Weinandy F, Waidelich M, Longo D, Gehrig P, Potthast F, Rutishauser D, Gerrits B, et al. Qualitative and quantitative analyses of protein phosphorylation in naive and stimulated mouse synaptosomal preparations. Mol Cell Proteomics. 2007;6:283–293. doi: 10.1074/mcp.M600046-MCP200. [DOI] [PubMed] [Google Scholar]
- Nesvizhskii AI, Vitek O, Aebersold R. Analysis and validation of proteomic data generated by tandem mass spectrometry. Nat Methods. 2007;4:787–797. doi: 10.1038/nmeth1088. [DOI] [PubMed] [Google Scholar]
- Nielsen PA, Olsen JV, Podtelejnikov AV, Andersen JR, Mann M, Wisniewski JR. Proteomic mapping of brain plasma membrane proteins. Mol Cell Proteomics. 2005;4:402–408. doi: 10.1074/mcp.T500002-MCP200. [DOI] [PubMed] [Google Scholar]
- Oda Y, Huang K, Cross FR, Cowburn D, Chait BT. Accurate quantitation of protein expression and site-specific phosphorylation. Proc Natl Acad Sci U S A. 1999;96:6591–6596. doi: 10.1073/pnas.96.12.6591. [DOI] [PMC free article] [PubMed] [Google Scholar]
- Oh-Ishi M, Satoh M, Maeda T. Preparative two-dimensional gel electrophoresis with agarose gels in the first dimension for high molecular mass proteins. Electrophoresis. 2000;21:1653–1669. doi: 10.1002/(SICI)1522-2683(20000501)21:9<1653::AID-ELPS1653>3.0.CO;2-9. [DOI] [PubMed] [Google Scholar]
- Old WM, Meyer-Arendt K, Aveline-Wolf L, Pierce KG, Mendoza A, Sevinsky JR, Resing KA, Ahn NG. Comparison of label-free methods for quantifying human proteins by shotgun proteomics. Mol Cell Proteomics. 2005;4:1487–1502. doi: 10.1074/mcp.M500084-MCP200. [DOI] [PubMed] [Google Scholar]
- Olsen JV, Blagoev B, Gnad F, Macek B, Kumar C, Mortensen P, Mann M. Global, in vivo, and site-specific phosphorylation dynamics in signaling networks. Cell. 2006;127:635–648. doi: 10.1016/j.cell.2006.09.026. [DOI] [PubMed] [Google Scholar]
- Olsen JV, Macek B, Lange O, Makarov A, Horning S, Mann M. Higher-energy C-trap dissociation for peptide modification analysis. Nat Methods. 2007;4:709–712. doi: 10.1038/nmeth1060. [DOI] [PubMed] [Google Scholar]
- Ong SE, Blagoev B, Kratchmarova I, Kristensen DB, Steen H, Pandey A, Mann M. Stable isotope labeling by amino acids in cell culture, SILAC, as a simple and accurate approach to expression proteomics. Mol Cell Proteomics. 2002;1:376–386. doi: 10.1074/mcp.m200025-mcp200. [DOI] [PubMed] [Google Scholar]
- Pan Q, Shai O, Lee LJ, Frey BJ, Blencowe BJ. Deep surveying of alternative splicing complexity in the human transcriptome by high-throughput sequencing. Nat Genet. 2008 doi: 10.1038/ng.259. [DOI] [PubMed] [Google Scholar]
- Panchaud A, Affolter M, Moreillon P, Kussmann M. Experimental and computational approaches to quantitative proteomics: status quo and outlook. J Proteomics. 2008;71:19–33. doi: 10.1016/j.jprot.2007.12.001. [DOI] [PubMed] [Google Scholar]
- Paradela A, Albar JP. Advances in the analysis of protein phosphorylation. J Proteome Res. 2008;7:1809–1818. doi: 10.1021/pr7006544. [DOI] [PubMed] [Google Scholar]
- Park KS, Mohapatra DP, Misonou H, Trimmer JS. Graded regulation of the Kv2.1 potassium channel by variable phosphorylation. Science. 2006;313:976–979. doi: 10.1126/science.1124254. [DOI] [PubMed] [Google Scholar]
- Payne AH, Glish GL. Tandem mass spectrometry in quadrupole ion trap and ion cyclotron resonance mass spectrometers. Methods Enzymol. 2005;402:109–148. doi: 10.1016/S0076-6879(05)02004-5. [DOI] [PubMed] [Google Scholar]
- Peng J. Evaluation of proteomic strategies for analyzing ubiquitinated proteins. BMB Rep. 2008;41:177–183. doi: 10.5483/bmbrep.2008.41.3.177. [DOI] [PubMed] [Google Scholar]
- Peng J, Elias JE, Thoreen CC, Licklider LJ, Gygi SP. Evaluation of multidimensional chromatography coupled with tandem mass spectrometry (LC/LC-MS/MS) for large-scale protein analysis: the yeast proteome. J Proteome Res. 2003;2:43–50. doi: 10.1021/pr025556v. [DOI] [PubMed] [Google Scholar]
- Peng J, Kim MJ, Cheng D, Duong DM, Gygi SP, Sheng M. Semiquantitative proteomic analysis of rat forebrain postsynaptic density fractions by mass spectrometry. J Biol Chem. 2004;279:21003–21011. doi: 10.1074/jbc.M400103200. [DOI] [PubMed] [Google Scholar]
- Perkins DN, Pappin DJ, Creasy DM, Cottrell JS. Probability-based protein identification by searching sequence databases using mass spectrometry data. Electrophoresis. 1999;20:3551–3567. doi: 10.1002/(SICI)1522-2683(19991201)20:18<3551::AID-ELPS3551>3.0.CO;2-2. [DOI] [PubMed] [Google Scholar]
- Petyuk VA, Qian WJ, Chin MH, Wang H, Livesay EA, Monroe ME, Adkins JN, Jaitly N, Anderson DJ, Camp DG, 2nd, et al. Spatial mapping of protein abundances in the mouse brain by voxelation integrated with high-throughput liquid chromatography-mass spectrometry. Genome Res. 2007;17:328–336. doi: 10.1101/gr.5799207. [DOI] [PMC free article] [PubMed] [Google Scholar]
- Piomelli D, Astarita G, Rapaka R. A neuroscientist's guide to lipidomics. Nat Rev Neurosci. 2007;8:743–754. doi: 10.1038/nrn2233. [DOI] [PubMed] [Google Scholar]
- Pu L, Bao GB, Xu NJ, Ma L, Pei G. Hippocampal long-term potentiation is reduced by chronic opiate treatment and can be restored by re-exposure to opiates. J Neurosci. 2002;22:1914–1921. doi: 10.1523/JNEUROSCI.22-05-01914.2002. [DOI] [PMC free article] [PubMed] [Google Scholar]
- Rahbar AM, Fenselau C. Unbiased examination of changes in plasma membrane proteins in drug resistant cancer cells. J Proteome Res. 2005;4:2148–2153. doi: 10.1021/pr0502370. [DOI] [PubMed] [Google Scholar]
- Rajagopalan KV, Fridovich I, Handler P. Competitive inhibition of enzyme activity by urea. J Biol Chem. 1961;236:1059–1065. [PubMed] [Google Scholar]
- Ransone LJ. Detection of protein-protein interactions by coimmunoprecipitation and dimerization. Methods Enzymol. 1995;254:491–497. doi: 10.1016/0076-6879(95)54034-2. [DOI] [PubMed] [Google Scholar]
- Resing KA, Meyer-Arendt K, Mendoza AM, Aveline-Wolf LD, Jonscher KR, Pierce KG, Old WM, Cheung HT, Russell S, Wattawa JL, et al. Improving reproducibility and sensitivity in identifying human proteins by shotgun proteomics. Anal Chem. 2004;76:3556–3568. doi: 10.1021/ac035229m. [DOI] [PubMed] [Google Scholar]
- Rigaut G, Shevchenko A, Rutz B, Wilm M, Mann M, Seraphin B. A generic protein purification method for protein complex characterization and proteome exploration. Nat Biotechnol. 1999;17:1030–1032. doi: 10.1038/13732. [DOI] [PubMed] [Google Scholar]
- Rush J, Moritz A, Lee KA, Guo A, Goss VL, Spek EJ, Zhang H, Zha XM, Polakiewicz RD, Comb MJ. Immunoaffinity profiling of tyrosine phosphorylation in cancer cells. Nat Biotechnol. 2005;23:94–101. doi: 10.1038/nbt1046. [DOI] [PubMed] [Google Scholar]
- Russell WK, Park ZY, Russell DH. Proteolysis in mixed organic-aqueous solvent systems: applications for peptide mass mapping using mass spectrometry. Anal Chem. 2001;73:2682–2685. doi: 10.1021/ac001332p. [DOI] [PubMed] [Google Scholar]
- Sadygov RG, Cociorva D, Yates JR., 3rd Large-scale database searching using tandem mass spectra: looking up the answer in the back of the book. Nat Methods. 2004;1:195–202. doi: 10.1038/nmeth725. [DOI] [PubMed] [Google Scholar]
- Sandra K, Moshir M, D'Hondt F, Verleysen K, Kas K, Sandra P. Highly efficient peptide separations in proteomics Part 1. Unidimensional high performance liquid chromatography. J Chromatogr B Analyt Technol Biomed Life Sci. 2007 doi: 10.1016/j.jchromb.2007.10.034. [DOI] [PubMed] [Google Scholar]
- Santoni V, Molloy M, Rabilloud T. Membrane proteins and proteomics: un amour impossible? Electrophoresis. 2000;21:1054–1070. doi: 10.1002/(SICI)1522-2683(20000401)21:6<1054::AID-ELPS1054>3.0.CO;2-8. [DOI] [PubMed] [Google Scholar]
- Schindler J, Lewandrowski U, Sickmann A, Friauf E, Nothwang HG. Proteomic analysis of brain plasma membranes isolated by affinity two-phase partitioning. Mol Cell Proteomics. 2006;5:390–400. doi: 10.1074/mcp.T500017-MCP200. [DOI] [PubMed] [Google Scholar]
- Schirmer EC, Florens L, Guan T, Yates JR, 3rd, Gerace L. Nuclear membrane proteins with potential disease links found by subtractive proteomics. Science. 2003;301:1380–1382. doi: 10.1126/science.1088176. [DOI] [PubMed] [Google Scholar]
- Schmidt A, Kellermann J, Lottspeich F. A novel strategy for quantitative proteomics using isotope-coded protein labels. Proteomics. 2005;5:4–15. doi: 10.1002/pmic.200400873. [DOI] [PubMed] [Google Scholar]
- Schroeder MJ, Webb DJ, Shabanowitz J, Horwitz AF, Hunt DF. Methods for the detection of paxillin post-translational modifications and interacting proteins by mass spectrometry. J Proteome Res. 2005;4:1832–1841. doi: 10.1021/pr0502020. [DOI] [PubMed] [Google Scholar]
- Shannon P, Markiel A, Ozier O, Baliga NS, Wang JT, Ramage D, Amin N, Schwikowski B, Ideker T. Cytoscape: a software environment for integrated models of biomolecular interaction networks. Genome Res. 2003;13:2498–2504. doi: 10.1101/gr.1239303. [DOI] [PMC free article] [PubMed] [Google Scholar]
- Shen Y, Zhao R, Berger SJ, Anderson GA, Rodriguez N, Smith RD. High-efficiency nanoscale liquid chromatography coupled on-line with mass spectrometry using nanoelectrospray ionization for proteomics. Anal Chem. 2002;74:4235–4249. doi: 10.1021/ac0202280. [DOI] [PubMed] [Google Scholar]
- Shevchenko A, Shevchenko A. Evaluation of the efficiency of in-gel digestion of proteins by peptide isotopic labeling and MALDI mass spectrometry. Anal Biochem. 2001;296:279–283. doi: 10.1006/abio.2001.5321. [DOI] [PubMed] [Google Scholar]
- Shevchenko A, Tomas H, Havlis J, Olsen JV, Mann M. In-gel digestion for mass spectrometric characterization of proteins and proteomes. Nat Protoc. 2006;1:2856–2860. doi: 10.1038/nprot.2006.468. [DOI] [PubMed] [Google Scholar]
- Shimura H, Hattori N, Kubo S, Mizuno Y, Asakawa S, Minoshima S, Shimizu N, Iwai K, Chiba T, Tanaka K, Suzuki T. Familial Parkinson disease gene product, parkin, is a ubiquitin-protein ligase. Nat Genet. 2000;25:302–305. doi: 10.1038/77060. [DOI] [PubMed] [Google Scholar]
- Shin JB, Streijger F, Beynon A, Peters T, Gadzala L, McMillen D, Bystrom C, Van der Zee CE, Wallimann T, Gillespie PG. Hair bundles are specialized for ATP delivery via creatine kinase. Neuron. 2007;53:371–386. doi: 10.1016/j.neuron.2006.12.021. [DOI] [PMC free article] [PubMed] [Google Scholar]
- Siuti N, Kelleher NL. Decoding protein modifications using top-down mass spectrometry. Nat Methods. 2007;4:817–821. doi: 10.1038/nmeth1097. [DOI] [PMC free article] [PubMed] [Google Scholar]
- Speers AE, Blackler AR, Wu CC. Shotgun analysis of integral membrane proteins facilitated by elevated temperature. Anal Chem. 2007;79:4613–4620. doi: 10.1021/ac0700225. [DOI] [PubMed] [Google Scholar]
- Speers AE, Wu CC. Proteomics of integral membrane proteins--theory and application. Chem Rev. 2007;107:3687–3714. doi: 10.1021/cr068286z. [DOI] [PubMed] [Google Scholar]
- Spellman DS, Deinhardt K, Darie CC, Chao MV, Neubert TA. Stable isotopic labeling by amino acids in cultured primary neurons: application to brain-derived neurotrophic factor-dependent phosphotyrosine-associated signaling. Mol Cell Proteomics. 2008;7:1067–1076. doi: 10.1074/mcp.M700387-MCP200. [DOI] [PMC free article] [PubMed] [Google Scholar]
- Steen H, Kuster B, Fernandez M, Pandey A, Mann M. Detection of tyrosine phosphorylated peptides by precursor ion scanning quadrupole TOF mass spectrometry in positive ion mode. Anal Chem. 2001;73:1440–1448. doi: 10.1021/ac001318c. [DOI] [PubMed] [Google Scholar]
- Steward O, Schuman EM. Compartmentalized synthesis and degradation of proteins in neurons. Neuron. 2003;40:347–359. doi: 10.1016/s0896-6273(03)00635-4. [DOI] [PubMed] [Google Scholar]
- Stolz DB, Jacobson BS. Examination of transcellular membrane protein polarity of bovine aortic endothelial cells in vitro using the cationic colloidal silica microbead membrane-isolation procedure. J Cell Sci. 1992;103(Pt 1):39–51. doi: 10.1242/jcs.103.1.39. [DOI] [PubMed] [Google Scholar]
- Strader MB, Tabb DL, Hervey WJ, Pan C, Hurst GB. Efficient and specific trypsin digestion of microgram to nanogram quantities of proteins in organic-aqueous solvent systems. Anal Chem. 2006;78:125–134. doi: 10.1021/ac051348l. [DOI] [PubMed] [Google Scholar]
- Sutton MA, Schuman EM. Local translational control in dendrites and its role in long-term synaptic plasticity. J Neurobiol. 2005;64:116–131. doi: 10.1002/neu.20152. [DOI] [PubMed] [Google Scholar]
- Syka JE, Coon JJ, Schroeder MJ, Shabanowitz J, Hunt DF. Peptide and protein sequence analysis by electron transfer dissociation mass spectrometry. Proc Natl Acad Sci U S A. 2004a;101:9528–9533. doi: 10.1073/pnas.0402700101. [DOI] [PMC free article] [PubMed] [Google Scholar]
- Syka JE, Marto JA, Bai DL, Horning S, Senko MW, Schwartz JC, Ueberheide B, Garcia B, Busby S, Muratore T, et al. Novel linear quadrupole ion trap/FT mass spectrometer: performance characterization and use in the comparative analysis of histone H3 post-translational modifications. J Proteome Res. 2004b;3:621–626. doi: 10.1021/pr0499794. [DOI] [PubMed] [Google Scholar]
- Tan F, Zhang Y, Mi W, Wang J, Wei J, Cai Y, Qian X. Enrichment of phosphopeptides by fe(3+)-immobilized magnetic nanoparticles for phosphoproteome analysis of the plasma membrane of mouse liver. J Proteome Res. 2008;7:1078–1087. doi: 10.1021/pr700655d. [DOI] [PubMed] [Google Scholar]
- Tannu NS, Hemby SE. Methods for proteomics in neuroscience. Prog Brain Res. 2006;158:41–82. doi: 10.1016/S0079-6123(06)58003-3. [DOI] [PubMed] [Google Scholar]
- Thiede B, Hohenwarter W, Krah A, Mattow J, Schmid M, Schmidt F, Jungblut PR. Peptide mass fingerprinting. Methods. 2005;35:237–247. doi: 10.1016/j.ymeth.2004.08.015. [DOI] [PubMed] [Google Scholar]
- Trinidad JC, Thalhammer A, Specht CG, Lynn AJ, Baker PR, Schoepfer R, Burlingame AL. Quantitative analysis of synaptic phosphorylation and protein expression. Mol Cell Proteomics. 2008;7:684–696. doi: 10.1074/mcp.M700170-MCP200. [DOI] [PubMed] [Google Scholar]
- Valera AG, Diaz-Hernandez M, Hernandez F, Ortega Z, Lucas JJ. The ubiquitin-proteasome system in Huntington's disease. Neuroscientist. 2005;11:583–594. doi: 10.1177/1073858405280639. [DOI] [PubMed] [Google Scholar]
- Van den Oever MC, Goriounova NA, Wan Li K, Van der Schors RC, Binnekade R, Schoffelmeer AN, Mansvelder HD, Smit AB, Spijker S, De Vries TJ. Prefrontal cortex AMPA receptor plasticity is crucial for cue-induced relapse to heroin-seeking. Nat Neurosci. 2008 doi: 10.1038/nn.2165. [DOI] [PubMed] [Google Scholar]
- Villen J, Beausoleil SA, Gerber SA, Gygi SP. Large-scale phosphorylation analysis of mouse liver. Proc Natl Acad Sci U S A. 2007;104:1488–1493. doi: 10.1073/pnas.0609836104. [DOI] [PMC free article] [PubMed] [Google Scholar]
- Vissers JP, Chervet JP, Salzmann JP. Sodium dodecyl sulphate removal from tryptic digest samples for on-line capillary liquid chromatography/electrospray mass spectrometry. J Mass Spectrom. 1996;31:1021–1027. doi: 10.1002/(SICI)1096-9888(199609)31:9<1021::AID-JMS384>3.0.CO;2-G. [DOI] [PubMed] [Google Scholar]
- Walikonis RS, Jensen ON, Mann M, Provance DW, Jr, Mercer JA, Kennedy MB. Identification of proteins in the postsynaptic density fraction by mass spectrometry. J Neurosci. 2000;20:4069–4080. doi: 10.1523/JNEUROSCI.20-11-04069.2000. [DOI] [PMC free article] [PubMed] [Google Scholar]
- Wang ET, Sandberg R, Luo S, Khrebtukova I, Zhang L, Mayr C, Kingsmore SF, Schroth GP, Burge CB. Alternative isoform regulation in human tissue transcriptomes. Nature. 2008 doi: 10.1038/nature07509. [DOI] [PMC free article] [PubMed] [Google Scholar]
- Want EJ, Nordstrom A, Morita H, Siuzdak G. From exogenous to endogenous: the inevitable imprint of mass spectrometry in metabolomics. J Proteome Res. 2007;6:459–468. doi: 10.1021/pr060505+. [DOI] [PubMed] [Google Scholar]
- Washburn MP, Wolters D, Yates JR., 3rd Large-scale analysis of the yeast proteome by multidimensional protein identification technology. Nat Biotechnol. 2001;19:242–247. doi: 10.1038/85686. [DOI] [PubMed] [Google Scholar]
- Wells L, Vosseller K, Cole RN, Cronshaw JM, Matunis MJ, Hart GW. Mapping sites of O-GlcNAc modification using affinity tags for serine and threonine post-translational modifications. Mol Cell Proteomics. 2002;1:791–804. doi: 10.1074/mcp.m200048-mcp200. [DOI] [PubMed] [Google Scholar]
- Wilkins MR, Pasquali C, Appel RD, Ou K, Golaz O, Sanchez JC, Yan JX, Gooley AA, Hughes G, Humphery-Smith I, et al. From proteins to proteomes: large scale protein identification by two-dimensional electrophoresis and amino acid analysis. Biotechnology (N Y) 1996;14:61–65. doi: 10.1038/nbt0196-61. [DOI] [PubMed] [Google Scholar]
- Willis D, Li KW, Zheng JQ, Chang JH, Smit A, Kelly T, Merianda TT, Sylvester J, van Minnen J, Twiss JL. Differential transport and local translation of cytoskeletal, injury-response, and neurodegeneration protein mRNAs in axons. J Neurosci. 2005;25:778–791. doi: 10.1523/JNEUROSCI.4235-04.2005. [DOI] [PMC free article] [PubMed] [Google Scholar]
- Wisztorski M, Croix D, Macagno E, Fournier I, Salzet M. Molecular MALDI imaging: an emerging technology for neuroscience studies. Dev Neurobiol. 2008;68:845–858. doi: 10.1002/dneu.20623. [DOI] [PubMed] [Google Scholar]
- Wolters DA, Washburn MP, Yates JR., 3rd An automated multidimensional protein identification technology for shotgun proteomics. Anal Chem. 2001;73:5683–5690. doi: 10.1021/ac010617e. [DOI] [PubMed] [Google Scholar]
- Wu CC, MacCoss MJ, Howell KE, Matthews DE, Yates JR., 3rd Metabolic labeling of mammalian organisms with stable isotopes for quantitative proteomic analysis. Anal Chem. 2004;76:4951–4959. doi: 10.1021/ac049208j. [DOI] [PubMed] [Google Scholar]
- Wu CC, MacCoss MJ, Howell KE, Yates JR., 3rd A method for the comprehensive proteomic analysis of membrane proteins. Nat Biotechnol. 2003;21:532–538. doi: 10.1038/nbt819. [DOI] [PubMed] [Google Scholar]
- Wu L, Han DK. Overcoming the dynamic range problem in mass spectrometry-based shotgun proteomics. Expert Rev Proteomics. 2006;3:611–619. doi: 10.1586/14789450.3.6.611. [DOI] [PubMed] [Google Scholar]
- Xu TV, D J, Park SK, Cociorva D, Lu B, Liao L, Wohlschlegel J, Hewel J, Yates JR. ProLuCID, a fast and sensitive tandem mass spectra-based protein identification program. Mol Cell Proteomics. 2006;5(10):S174. [Google Scholar]
- Yao X, Freas A, Ramirez J, Demirev PA, Fenselau C. Proteolytic 18O labeling for comparative proteomics: model studies with two serotypes of adenovirus. Anal Chem. 2001;73:2836–2842. doi: 10.1021/ac001404c. [DOI] [PubMed] [Google Scholar]
- Yates JR, 3rd, McCormack AL, Schieltz D, Carmack E, Link A. Direct analysis of protein mixtures by tandem mass spectrometry. J Protein Chem. 1997;16:495–497. doi: 10.1023/a:1026365528484. [DOI] [PubMed] [Google Scholar]
- Yates JR, Cociorva D, Liao L, Zabrouskov V. Performance of a linear ion trap-Orbitrap hybrid for peptide analysis. Anal Chem. 2006;78:493–500. doi: 10.1021/ac0514624. [DOI] [PubMed] [Google Scholar]
- Yoshimura Y, Yamauchi Y, Shinkawa T, Taoka M, Donai H, Takahashi N, Isobe T, Yamauchi T. Molecular constituents of the postsynaptic density fraction revealed by proteomic analysis using multidimensional liquid chromatography-tandem mass spectrometry. J Neurochem. 2004;88:759–768. doi: 10.1046/j.1471-4159.2003.02136.x. [DOI] [PubMed] [Google Scholar]
- Zaia J. Mass spectrometry and the emerging field of glycomics. Chem Biol. 2008;15:881–892. doi: 10.1016/j.chembiol.2008.07.016. [DOI] [PMC free article] [PubMed] [Google Scholar]
- Zhang X, Poo MM. Localized synaptic potentiation by BDNF requires local protein synthesis in the developing axon. Neuron. 2002;36:675–688. doi: 10.1016/s0896-6273(02)01023-1. [DOI] [PubMed] [Google Scholar]
- Zhou Y, Bhatia I, Cai Z, He QY, Cheung PT, Chiu JF. Proteomic analysis of neonatal mouse brain: evidence for hypoxia- and ischemia-induced dephosphorylation of collapsin response mediator proteins. J Proteome Res. 2008;7:2507–2515. doi: 10.1021/pr800108k. [DOI] [PubMed] [Google Scholar]
- Zubarev RA, Horn DM, Fridriksson EK, Kelleher NL, Kruger NA, Lewis MA, Carpenter BK, McLafferty FW. Electron capture dissociation for structural characterization of multiply charged protein cations. Anal Chem. 2000;72:563–573. doi: 10.1021/ac990811p. [DOI] [PubMed] [Google Scholar]