

Abstract
Rationale and Objectives
Long circulating core-encapsulated gadolinium (CE-Gd) liposomal nanoparticles that have surface conjugated polyethylene glycol are a promising platform technology for use as blood pool T1-based magnetic resonance (MR) contrast agents. The objective of this study was to investigate the effect of liposome size and internal (core) Gd concentration on the T1 relaxivity of CE-Gd liposomes.
Materials and Methods
Twelve different liposomal formulations were synthesized and characterized, resulting in a size (50, 100, 200, and 400 nm) and core Gd-concentration (200, 350, and 500 mM) “matrix” of test samples. Subsequently, CE-Gd liposomes were diluted in deionized water (four diluted samples) and molar T1 relaxivity (r1) measurements were performed at 2- and 7-T MR field strengths.
Results
The r1 of CE-Gd liposomes was inversely related to the liposome size. The largest change in r1 was observed between liposomes that were extruded through 50- and 100-nm filter membranes. At both field strengths, the variation in internal gadolinium concentration did not show any significant correlation (α ≤ 0.05) with r1.
Conclusions
The size of CE-Gd liposomal nanoparticles significantly affects the T1 relaxivity. An inverse relation was observed between liposome size and T1 relaxivity. The T1 relaxivity did not change significantly with core Gd concentration over the measured concentration range.
Keywords: Liposome, long circulating, blood pool contrast agent, MR, gadolinium
The utility of blood pool contrast agents is gradually increasing in the field of magnetic resonance imaging (MRI) (1-3). Blood pool contrast agents have longer in vivo circulation half-lives compared to traditional MRI contrast agents. As a result, these agents provide for optimal imaging over an extended time in comparison to conventional agents. This also enables the ability to image over a larger anatomic region and at higher spatial resolution, both of which increase the duration of scanning. Blood pool contrast agents fall into two major classes: macromolecular-based and nanoparticle-based. Liposomes are spherical vesicles of between 50 and 400 nm, composed of a lipid bilayer surrounding an aqueous internal core. They represent one specific “platform technology” within the nanoparticle class of blood pool agents and have begun to demonstrate utility as blood pool MRI contrast agents in preclinical imaging (4-7).
Traditionally, liposomal-based contrast agents contain the signal generating moiety (eg, paramagnetic metal chelates in the case of MRI) within the central core of the liposome (7,8). This core encapsulation alters their pharmacokinetic properties of the signal molecules. For example, free gadolinium chelates (Gd-chelates) are rapidly eliminated from systemic circulation via the renal system. The Gd-chelates within the core of a liposome are protected from glomerular filtration and are therefore not rapidly filtered by the kidneys. Elimination of the Gd-chelates is dictated by the biodistribution and elimination of the carrier particle, the liposome, which is eliminated by the reticuloendothelial system. The conventional core-encapsulated Gd (CE-Gd) liposomal nanoparticles initially served well as T1-based contrast agents for hepatic imaging because of rapid sequestration by the reticuloendothelial system (9). With the development of Stealth technology (modification of liposome by conjugation of polyethylene glycol to the surface), extended intravascular circulatory half-lives of up to 18 hours were obtained. This facilitated the concept of the blood pool contrast agent as opposed to hepatic contrast agent. Long-circulating CE-Gd nanoparticles (liposomes) have been used as blood pool contrast agents in small animal imaging (6,7).
The CE of Gd-chelates within the liposomal core alters the relaxivities (r1 and r2) compared to free Gd-chelates. Previous studies have investigated the effect of bilayer composition on the T1 relaxivity of conventional CE-Gd liposomal nanoparticles (10,11). In this study, the effect of liposome size and internal Gd concentration on the T1 relaxivity of CE-Gd liposomes was investigated. CE-Gd liposomes of different liposome sizes and various internal Gd concentrations were synthesized. T1 relaxivities of CE-Gd liposomes were determined in deionized (DI) water at both 2 and 7 T.
MATERIALS AND METHODS
Synthesis of CE-Gd Liposomes
To study the effects of internal Gd concentration, three different Gd solutions were used for CE-Gd liposome synthesis. The most concentrated Gd solution contained 500 mM gadodiamide (Omniscan, GE HealthCare, Princeton, NJ). Gd solutions of 350 and 200 mM were prepared by diluting the 500 mM solution with DI water.
For CE-Gd liposome preparation, a lipid mixture consisting of 1,2-Dipalmitoyl-sn-glycero-3-phosphocholine (Genzyme, Cambridge, MA), cholesterol (Sigma-Aldrich, St. Louis, MO), and 1,2-distearoyl-sn-glycero-3-phosphoethanolamine-N-[methoxy(poly(ethylene glycol))-2000] (Genzyme) in the ratio 55:40:5 was dissolved in ethanol at 60°C. Subsequently, the previously described ethanol solution was mixed with one of the three Gd solutions described previously and stirred for 2 hours at 60°C. The total concentration of lipids in the solution was 150 mM. Depending on the final size of the liposomes desired, the solution was sequentially extruded at 60°C through a high-pressure extruder (Northern Lipids, Vancouver, BC, Canada) with 10 passes through a 400-nm Nuclepore membrane (Waterman, Newton, MA), 10 passes through a 200-nm Nuclepore membrane, 10 passes through a 100-nm Nuclepore membrane, and 10 passes through a 50-nm Nuclepore membrane. The resulting solution was diafiltered using a MicroKros module (Spectrum Laboratories, Rancho Dominguez, CA) of 400-kDa molecular weight cutoff to remove unencapsulated Gd-chelate molecules. To demonstrate reproducibility in the synthesis process, three batches of liposomes were prepared at each of the different liposome size for a core Gd concentration of 500 mM.
Characterization of CE-Gd Liposomes
After the diafiltration process, the size distribution of liposomes in the final formulation was determined by dynamic light scattering using a ZetaPlus Analyzer (Brookhaven Instruments, Chapel House, UK). Gd measurements were performed by diluting the CE-Gd liposomes in 2% nitric acid and then quantifying using inductively coupled plasma optical emission spectroscopy (Model Optima 4300D, Perkin Elmer, Norwalk, CT) operating at a wavelength of 336.223 nm.
Measurement of T1 Relaxation Times
Preparation of samples for MRI experiment
Samples with Gd concentrations ranging between 0.1 and 1 mM (four samples) were prepared by diluting the CE-Gd liposomes in DI water. A total of 48 samples (three Gd concentrations, four liposome sizes, and four diluted samples) were prepared for the imaging experiment. Diluted samples of free Gd-chelate, gadoteridol (Prohance, Bracco Diagnostics), were also prepared for T1 measurements.
MRI system
Imaging experiments were performed at two MRI field strengths. A 2-T, 30-cm bore, Oxford magnet with shielded gradients up to 200 mT/m and rise times of 200 μm was used for imaging at low field strength. The system is controlled by a Signa EXCITE console (Version 12.4, GE Medical Systems, Milwaukee, WI). A 9-cm diameter birdcage radiofrequency body coil was used for transmit and receive in all experiments. A 7-T, 12-cm bore Magnex magnet with shielded gradients up to 770 mT/m and rise times of 100 μm was used for imaging at high field strength. The system is controlled by a Signa EXCITE console (Version 12.4, GE Medical Systems). A 7-cm diameter birdcage radiofrequency body coil was used for transmit and receive in all experiments. The temperature in the MRI scanner was maintained at 36.5 ± 0.5°C throughout the experiment by an automated feedback system that regulated heated airflow through the magnet bore.
MRI pulse sequence
The T1 relaxation times of the samples were determined using a spin-echo sequence. The following imaging parameters were used for experiments performed on a 2-T scanner: echo time (TE) = 8 ms, repetition time (TR) varied 30 to 14,000 ms, slice thickness = 5 mm, bandwidth = 31.25 kHz, image matrix = 256 × 128, number of excitations = 1. The following imaging parameters were used for experiments performed on 7 T scanner: TE = 8 ms, TR was varied from 30 to 14,000 ms, slice thickness = 5 mm, bandwidth = 31.25 kHz, image matrix = 256 × 128, number of excitations = 1.
Data analysis
Postprocessing of data was done in ImageJ using the MRI Analysis plugin (provided by Karl Schmidt). T1 relaxation times were calculated on a pixelwise basis using the simplex algorithm fit to the exponential equation for a spin echo sequence. The data were represented as mean ± standard deviation, where standard deviations were calculated using Gaussian law of error propagation (12). A plot of T1 relaxation rate (1/T1) versus Gd concentration yielded straight line with the slope defined as the T1 relaxivity (r1). Statistical analysis was performed using the analysis of covariance methodology.
RESULTS
The volume-based mean diameters of liposomes were determined by dynamic light scattering (Table 1). The standard deviation in the mean size for liposomes extruded through 50- and 100-nm filter membranes was within 10 nm. The standard deviation in the mean size for liposomes extruded through 200- and 400-nm filter membranes was within 20 and 50 nm, respectively. The standard deviation in the Gd concentration after the dialysis process was within 10 mM. The longitudinal magnetizations had recovered for most of the samples within the repetition times used in the experiments (Fig 1). Plots of T1 relaxation rate versus Gd concentration yielded linear correlation for all samples with coefficient of determination, R2 value, greater than 0.98 (Fig 2). An inverse relationship between r1 and liposome size was observed for CE-Gd liposomes at 2 T (Fig 3). The largest change in r1 was observed between liposomes that were extruded through 50- and 100-nm filter membranes. A comparison of r1 for the four liposome sizes indicated each to be significantly different from one another (α = 0.05). Similar behavior was observed for experiments performed at 7 T (Fig 3). In comparison, the free Gd-chelate demonstrated higher r1 than all of the CE-Gd formulations.
Table 1. Dynamic Light Scattering Determined Diameter (nanometers) of Core-encapsulated Gadolinium (CE-Gd) Liposomes.
| CE-Gd Concentration (mM) |
|||
|---|---|---|---|
| Nuclepore Size (nm) | 200 | 350 | 500 |
| 50 | 75.3 | 70.5 | 72.6 |
| 100 | 100.7 | 94.1 | 94.5 |
| 200 | 154.1 | 153.4 | 160.8 |
| 400 | 253.5 | 310.3 | 274.2 |
Figure 1.
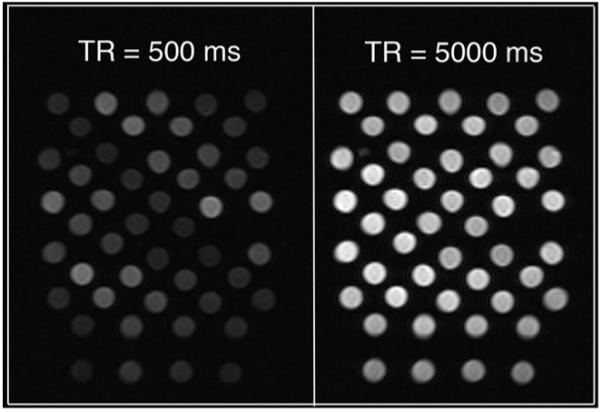
Representative images of core-encapsulated gadolinium liposome phantoms during T1-weighted imaging experiment at 2 T. TR, repetition time.
Figure 2.

Plots of T1 relaxation rate (R1) versus gadolinium concentration for core-encapsulated gadolinium (CE-Gd) liposomes of different liposome sizes, at 2 T (left) and 7 T (right). The CE-Gd liposomes were prepared using 350-mM gadodiamide solution. R1 values were calculated as the inverse of T1 relaxation times (T1), where T1 values were determined using the simplex algorithm fit to the exponential equation for a spin-echo sequence. MR, magnetic resonance.
Figure 3.

Plots of T1 relaxivity (r1) versus liposome size for core-encapsulated gadolinium liposomes containing different core gadolinium concentration at 2 T (left) and 7 T (right). For comparison, the r1 of free Gd-chelate, gadoteridol (Prohance), is also included in the plots. MR, magnetic resonance.
At both field strengths, variation in the internal Gd concentration did not show any significant correlation (α ≤ 0.05) with r1 for the same liposome size. The r1 values obtained at 2 T were significantly higher (α ≤ 0.05) than values obtained at 7 T.
DISCUSSION
The T1 relaxation process depends on the interaction of Gd ions with the nearby water molecules. However, in the case of CE-Gd liposomal contrast agents, the relaxation rate is proportional to two factors: 1) the diffusion rate of water molecules across the lipid bilayer and 2) the interaction of water molecules, present in the liposome core, with the Gd ions. The diffusion rate is given as the product of permeability coefficient (P, centimeters per second) and lipid surface area (S, centimeters squared). The interaction of water molecules with the Gd ions is proportional to the concentration of Gd ions in the liposome core, which is inversely proportional to the internal volume of liposome (V). As a result, the relaxation rate is proportional to the lipid bilayer permeability (P) and the surface area to volume ratio of the liposomes (S/V). For a given lipid concentration, the S/V ratio of liposome is inversely related to the liposome size (Fig 4). The observed trend in r1 for different liposome sizes, obtained in this study, was very similar to the trend in S/V ratio for different liposome sizes. Barsky et al (13) showed, using mathematic models, that the r1 of conventional CE-Gd liposomal agents is proportional to the surface area of the liposome. The results from our study therefore correlate well with previous mathematic models. In this study, we investigated CE-Gd liposomal nanoparticles that were extruded through filter pore sizes ranging from 50 to 400 nm. Although preparation of larger liposomes is feasible, the in vivo circulation time decreases dramatically and would therefore be ineffective for use in imaging experiments with long scan times (14,15). The preparation of liposomes smaller than 50 nm in size present several technical challenges using the extrusion technique and therefore was considered the limit on the lower size.
Figure 4.
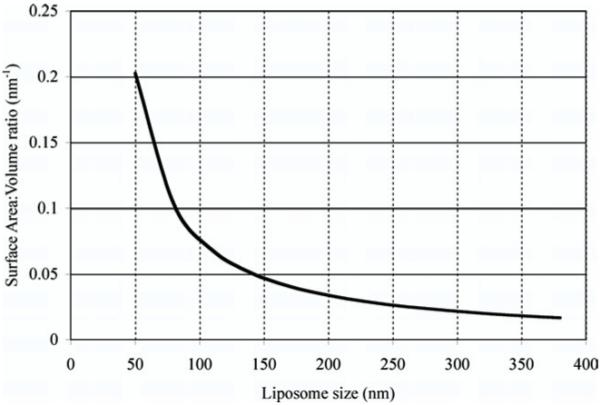
Theoretical estimation of surface area to volume ratio for various liposome sizes.
Tilcock et al (10) showed that the presence of cholesterol had a major effect on the r1 of conventional CE-Gd liposomal agents. Their study demonstrated that in the absence of cholesterol, the permeability of the bilayer was considerably increased. Consequently, the r1 of liposomal agents also increased. However, in the absence of cholesterol, the liposomes were not stable, resulting in leakage of Gd that was encapsulated within the liposomes. Therefore, in our study, cholesterol was used in the liposomal preparation to ensure stable encapsulation of Gd inside liposomes. The stability of CE-Gd liposomal agents is also important in vivo to maintain constant opacification of the blood pool compartment for longer periods.
Fosshiem et al (11) studied the effect of phospholipid carbon-chain length on the r1 of CE-Gd liposomal agents. They observed that the longer carbon-chain length phospholipids reduced water permeability through the bilayer, which consequently resulted in lower r1 of CE-Gd liposomal agents. In our study, a short chain-length (16-carbon length) phospholipid was used for the liposomal preparation to achieve high r1. The internal Gd concentration did not show any correlation with r1 for various CE-Gd liposomes. This may suggest that the external protons are completely relaxed on entering the internal aqueous core of the liposomes, even for the lowest Gd concentration.
The r1 of CE-Gd liposomes were lower than the r1 of free Gd-chelate. The lower r1 is a result of limited water exchange across the lipid bilayer and the reduced interaction between the external water molecules and the encapsulated Gd ions. However, the benefits of using CE-Gd for in vivo small animal imaging arises from the intravascular nature of the nanoparticle agent that result in higher contrast-to-noise ratio between the blood and the surrounding tissues compared to free Gd-chelate (6,7). Further, the long in vivo circulation times of CE-Gd agents provide an extended window for imaging that has enabled high-resolution imaging of microvascular features in small animals (Bucholz E, unpublished data, 2008).
In conclusion, the effect of liposome size and Gd concentration on the T1 relaxivity of long circulating CE-Gd liposomal contrast agents was studied. The smallest size CE-Gd liposomes provided the highest T1 relaxivity. The core Gd concentration did not show any significant correlation with T1 relaxivity over the measured ranges.
Footnotes
This work was supported by NIH/NCRR National Biomedical Technology Resource Center grants (P41 RR005959, NCI R24 CA092656, NHLBI RO1 HL055348) and a research grant from the American Society of Neuroradiology (S.M.).
REFERENCES
- 1.Klessen C, Hein PA, Huppertz A, et al. First-pass whole-body magnetic resonance angiography (MRA) using the blood-pool contrast medium gadofosveset trisodium: comparison to gadopentetate dimeglumine. Invest Radiol. 2007;42:659–664. doi: 10.1097/RLI.0b013e318063c635. [DOI] [PubMed] [Google Scholar]
- 2.Goyen M, Edelman M, Perreault P, et al. MR angiography of aortoiliac occlusive disease: a phase III study of the safety and effectiveness of the blood-pool contrast agent MS-325. Radiology. 2005;236:825–833. doi: 10.1148/radiol.2363040577. [DOI] [PubMed] [Google Scholar]
- 3.Mohs AM, Lu ZR. Gadolinium(III)-based blood-pool contrast agents for magnetic resonance imaging: status and clinical potential. Expert Opin Drug Deliv. 2007;4:149–164. doi: 10.1517/17425247.4.2.149. [DOI] [PubMed] [Google Scholar]
- 4.Unger E, Needleman P, Cullis P, et al. Gadolinium-DTPA liposomes as a potential MRI contrast agent. Work in progress. Invest Radiol. 1988;23:928–932. doi: 10.1097/00004424-198812000-00010. [DOI] [PubMed] [Google Scholar]
- 5.Weissig VV, Babich J, Torchilin VV. Long-circulating gadolinium-loaded liposomes: potential use for magnetic resonance imaging of the blood pool. Colloids Surf B Biointerfaces. 2000;18:293–299. doi: 10.1016/s0927-7765(99)00155-1. [DOI] [PubMed] [Google Scholar]
- 6.Ayyagari AL, Zhang X, Ghaghada KB, et al. Long-circulating liposomal contrast agents for magnetic resonance imaging. Magn Reson Med. 2006;55:1023–1029. doi: 10.1002/mrm.20846. [DOI] [PubMed] [Google Scholar]
- 7.Ghaghada KB, Bockhorst KH, Mukundan S, Jr, et al. High-resolution vascular imaging of the rat spine using liposomal blood pool MR agent. AJNR Am J Neuroradiol. 2007;28:48–53. [PMC free article] [PubMed] [Google Scholar]
- 8.Tilcock C, Unger E, Cullis P, et al. Liposomal Gd-DTPA: preparation and characterization of relaxivity. Radiology. 1989;171:77–80. doi: 10.1148/radiology.171.1.2928549. [DOI] [PubMed] [Google Scholar]
- 9.Unger EC, Winokur T, MacDougall P, et al. Hepatic metastases: liposomal Gd-DTPA-enhanced MR imaging. Radiology. 1989;171:81–85. doi: 10.1148/radiology.171.1.2928550. [DOI] [PubMed] [Google Scholar]
- 10.Tilcock C, MacDougall P, Unger E, et al. The effect of lipid composition on the relaxivity of Gd-DTPA entrapped in lipid vesicles of defined size. Biochim Biophys Acta. 1990;1022:181–186. doi: 10.1016/0005-2736(90)90112-2. [DOI] [PubMed] [Google Scholar]
- 11.Fossheim SL, Fahlvik AK, Klaveness J, et al. Paramagnetic liposomes as MRI contrast agents: influence of liposomal physicochemical properties on the in vitro relaxivity. Magn Reson Imaging. 1999;17:83–89. doi: 10.1016/s0730-725x(98)00141-6. [DOI] [PubMed] [Google Scholar]
- 12.Rohrer M, Bauer H, Mintorovitch J, et al. Comparison of magnetic properties of MRI contrast media solutions at different magnetic field strengths. Invest Radiol. 2005;40:715–724. doi: 10.1097/01.rli.0000184756.66360.d3. [DOI] [PubMed] [Google Scholar]
- 13.Barsky D, Putz B, Schulten K, et al. Theory of paramagnetic contrast agents in liposome systems. Magn Reson Med. 1992;24:1–13. doi: 10.1002/mrm.1910240102. [DOI] [PubMed] [Google Scholar]
- 14.Huang SK, Lee KD, Hong K, et al. Microscopic localization of sterically stabilized liposomes in colon carcinoma-bearing mice. Cancer Res. 1992;52:5135–5143. [PubMed] [Google Scholar]
- 15.Litzinger DC, Buiting AM, van Rooijen N, et al. Effect of liposome size on the circulation time and intraorgan distribution of amphipathic poly-(ethylene glycol)-containing liposomes. Biochim Biophys Acta. 1994;1190:99–107. doi: 10.1016/0005-2736(94)90038-8. [DOI] [PubMed] [Google Scholar]