Abstract
Complementary methods using liquid chromatography - tandem quadrupole mass spectrometry (LC-MS/MS) and comprehensive two-dimensional gas chromatography-time-of-flight mass spectrometry (GC × GC-TOF-MS) were developed and applied to determine targeted metabolites involved in central carbon metabolism [including tricarboxylic acid cycle, serine cycle, ethylmalonyl-coenzyme A (ethylmalonyl-CoA) pathway and poly-β-hydroxybutyrate cycle] of the bacterium Methylobacterium extorquens AM1 grown on two carbon sources, ethylamine (C2) and succinate (C4). Nucleotides, acyl-CoAs and a few volatile metabolites in cell extracts of M. extorquens AM1 were readily separated using either hydrophilic interaction liquid chromatography or reversed-phase liquid chromatography, and detected with good sensitivity by MS/MS. However, volatile intermediates within a low mass range (<300 m/z), especially at low abundance (such as glyoxylic acid and others <500 nM), were more effectively analyzed by GC × GC-TOF-MS which often provided better sensitivity, resolution and reproducibility. The complementary nature of the LC-based and GC-based methods allowed the comparison of 39 metabolite concentrations (the lowest level was at 139.3 nM). The overlap between the LC and GC-based methods of 7 metabolites provided a basis to check for consistency between the two methods, and thus provided some validation of the quantification accuracy. The abundance change of 20 intermediates further suggested differences in pathways linked to C2 and C4 metabolism.
Keywords: LC-MS/MS, GC × GC-TOF-MS, metabolomics, targeted metabolite, Methylobacterium extorquens AM1, central carbon metabolism
1. Introduction
Metabolomics has attained increasing attention in recent years as one of the global “omics” approaches, since it more closely reflects the activity of a cell at the functional level than other approaches such as genomics and proteomics. Depending on the research goals, there are two major strategies that have been developed within the metabolomic field [1]: (i) targeted metabolite analysis is an approach in which absolute quantities of identified key metabolites are determined, (ii) untargeted metabolite analysis is the comprehensive analysis of the entire known and unknown metabolome, and is suitable for the discovery of new metabolites and novel functions.
For targeted analysis, mass spectrometry (MS) in combination with various separation methods, such as gas chromatography (GC-MS) and liquid chromatography (LC-MS) provides a powerful capability to measure many metabolites. Since GC-MS has a high separation efficiency and robustness, it is widely applied for metabolite profiling in plants and microorganisms [2, 3]. LC-MS, especially reversed-phase liquid chromatography (RPLC) with MS, has been used for analyzing complex samples such as urine [4]. Recently, a new hydrophilic interaction liquid chromatography (HILIC) technique that offers an advantage in separation of small polar compounds is also becoming increasingly popular to measure the intermediates involved in central carbon metabolism [5, 6]. This versatile separation technique of LC provides the possibility for the simultaneous analysis of different classes of important metabolites [7]. However, owing to the wide range of physiochemical properties and concentration ranges of low molecular weight metabolites, some groups of metabolites such as nucleotides, acyl-coenzyme A’s (acyl-CoAs) and carboxylic acids can be better detected on one platform than the other. As a result, it is compelling to consider combining GC-based and LC-based instrumentation (with MS detection) for the same samples to increase the total number of detected compounds or classes of compounds [8]. For example, by use of a combination of separation techniques with MS, a high number of classes of metabolites were identified in yeast cells and Escherichia coli cells, respectively [9, 10].
Detection sensitivity and reproducibility are other important features of metabolite quantification for a complex biological sample since many metabolites are present at low abundance. Multiple reaction monitoring (MRM, MS/MS) strategies utilizing triple quadrupole mass spectrometry, and more recently high-resolution mass spectrometry using time-of-flight MS (TOF-MS), LTQ orbitrap or Fourier transform mass spectrometry are usually preferred to address these challenges [11, 12]. While the MRM mode cannot provide information to identify unknown analytes, LC coupled to a triple quadrupole mass spectrometer (LC-MS/MS) generally offers the best quantitative sensitivity and reproducibility for targeted analytes [13]. Moreover, metabolite separation and quantification can be further improved by applying comprehensive two-dimensional (2D) separation techniques, such as LC × LC and GC × GC, which provide a dramatic increase in the peak capacity [14, 15]. GC × GC-TOF-MS is the coupling of comprehensive 2D-GC with TOF-MS, which has been successfully applied to a number of complex sample analyses, including yeast samples, environmental samples and pesticides [16–18]. In addition, various chemometrics tools such as principal component analysis, partial least square analysis and Fisher ratio analysis, have been used for differentiating complex data obtained by LC-MS and GC-MS [19, 20]. Parallel factor analysis (PARAFAC) and Fisher ratio analysis developed by the Synovec group have been demonstrated to be effective GC × GC-TOF-MS chromatographic deconvolution techniques for targeted metabolites analysis and as a discovery tool for untargeted metabolites analysis, respectively [19, 21].
Among the best-characterized model organisms for the study of one-carbon metabolism is the facultatively methylotrophic bacterium Methylobacterium extorquens AM1, which is able to use different metabolic pathways for both energy generation and carbon assimilation when it is grown on different types of substrates (such as C1 substrate, e.g., methanol; C2 substrate, e.g., ethylamine; C4 substrate, e.g., succinate) [22]. The available genome sequence of M. extorquens AM1 has further provided the ability to perform integrated metabolism studies by applying proteomic and metabolomic approaches [23, 24]. It has been suggested that M. extorquens AM1 grown on a C2 substrate uses a significantly different set of metabolic pathways compared with a C4 substrate [25, 26]. In this report, we have explored the metabolism of M. extorquens AM1 grown on these two substrates. In order to do so, we have combined the complementary methods of LC-MS/MS (both RPLC and HILIC), and GC × GC-TOF-MS to analyze the central carbon metabolic pathways, including the tricarboxylic acid (TCA) cycle, serine cycle, ethylmalonyl-CoA pathway and poly-β-hydroxybutyrate (PHB) cycle of M. extorquens AM1 and to identify the differences between cells grown on ethylamine (C2) and succinate (C4). In addition, Fisher ratio analysis has been applied to GC × GC-TOF-MS data to confirm the accuracy of targeted metabolites analysis and, additionally, to discover broader metabolic differences.
2. Experimental
2.1 Chemicals
All standards of nucleotides, acyl-CoAs, small peptides, amino acids and organic acids were of analytical grade and obtained from Sigma (St. Louis, MO, USA). Absolute ethanol (EMD Chemicals, Gibbstown, NJ, USA) was used in the cell extraction. For GC × GC-TOF-MS sample derivatization, pyridine was purchased from EMD Chemicals, and the trimethylsilylation (TMS) reagent [N, O-bis(trimethylsilyl)trifluoroacetamide (BSTFA) + trimethylchlorosilane (TMCS)], 99:1) and methoxyamine hydrochloride were both obtained from Sigma. [2H6]Salicylic acid, labeled ATP (13C10, 15N5) and labeled acetyl-CoA (13C2) were obtained from Sigma, and were used as internal standards (I.S.s). Solvents used for liquid chromatography were of LC-MS grade (Fisher Scientific, Fair Lawn, NJ, USA). Millipore purified water was used in the preparation of standards and sample solutions.
2.2 Growth conditions of M. extorquens AM1 and sample preparation
M. extorquens AM1 (rifamycin-resistant strain) was grown in liquid batch cultures in the minimal medium as described previously [27]. Ethylamine (20 mM) and succinate (15 mM) were used as the substrates. Rifamycin was added at 50 μg/mL and the culture temperature was maintained at 28 °C.
3 mL of the cell culture, at OD = 1.0 ± 0.2, was carefully and rapidly pipetted into the center of 25 mL 4-(2-hydroxyethyl)-1-piperazineethanesulfonic acid (HEPES)-buffered (70 mM, pH 6.8) aqueous 60% methanol (v/v) solution (−40°C). The quenched biomass was precipitated in a refrigerated centrifuge (6 min, 10 000 rpm, −20 °C; Dupont Sorvall RC5B, Waltham, MA, USA). The supernatant was removed, and the cell pellets were resuspended in 5 mL of the same methanol solution and again centrifuged for 6 min at 10 000 rpm. This entire extraction procedure was carried out in at least four replicates on different samples. Cell pellets were used for intracellular metabolites extraction as described below.
Most of the metabolite classes were extracted by using a previously reported protocol with minor modifications [23]. 13C10- and 15N5-labeled ATP and [2H6]salicylic acid were added as the I. S.s to correct for variation due to sample extraction and injection. 1 mL of boiling HEPES buffered ethanol solution (75/25 v/v ethanol/water, pH 5.2) was added to a given cell pellet and incubated at 100°C for 3 min. The extracted cell suspension was cooled on ice for 3 min and the cell debris was removed by centrifugation at 5000 rpm for 5 min. The cell-free metabolite extract was again centrifuged at 14 000 rpm for 8 min. The supernatant was transfered into a 2 mL glass vial and dried in a vacuum centrifuge (CentriVap Concentrator System, Labconco, MO, USA) to complete dryness. The dried sample, prior to analysis using LC-MS/MS, was redissolved in 100 μL purified water for analysis. The dried sample that was analyzed by GC × GC-TOF-MS was further derivatized in two steps [28]. First, keto groups were methoximated by adding 50 μL methoxyamine solution (25 mg/mL methoxyamine hydrochloride in pyridine) and incubating at 60°C for 30 min. In the second step, trimethylsiylation was performed by adding 50 μL TMS reagent (BSTFA/TMCS, 99:1) and heating at 60°C for 60 min.
NADH and NADPH were extracted by a hot alkaline extraction method [29]. Briefly, 0.8 mL of 0.8 N KOH at 85°C with 1% (v/v) Triton X-100 was added to a given cell pellet, and the mixture was incubated for 3 min at 85 °C. After cooling on ice for 3 min, the mixture was centrifuged at 5,000 rpm at 4°C for 5 min. The supernatant was partially neutralized with HClO4 to pH 10 and centrifuged at 14 000 rpm for 8 min. The supernatant was analyzed by LC-MS/MS immediately.
For short-chain acyl-CoAs, acid extraction method was used [30]. 13C2-Labeled acetyl-CoA was added as an I.S. A 500-μL volume of trichloroacetic acid (TCA) (15 %, w/v) was added to a given cell pellet and vortexed 5 min at 4 °C. The mixture was then centrifuged at 14 000 rpm at 4°C for 5 min. The supernatant was loaded onto a solid-phase extraction column (Waters Oasis HBL 1 mL, preconditioned with 2 mL methanol followed by 2 mL 0.15% TCA). The column was washed with 2 mL 0.15% TCA, and eluted with 1.5 mL methanol with 1% ammonium hydroxide. The elution solvent was evaporated to dryness by vacuum centrifuge as described above. The dried sample was redissolved in 100 μL purified water for LC-MS/MS analysis.
2.3 Metabolite analysis strategy
Figure 1 illustrates a workflow that combined LC-MS/MS and GC × GC-TOF-MS to obtain a comprehensive targeted metabolites analysis of M. extorquens AM1 grown on two different carbon sources.
Figure 1.
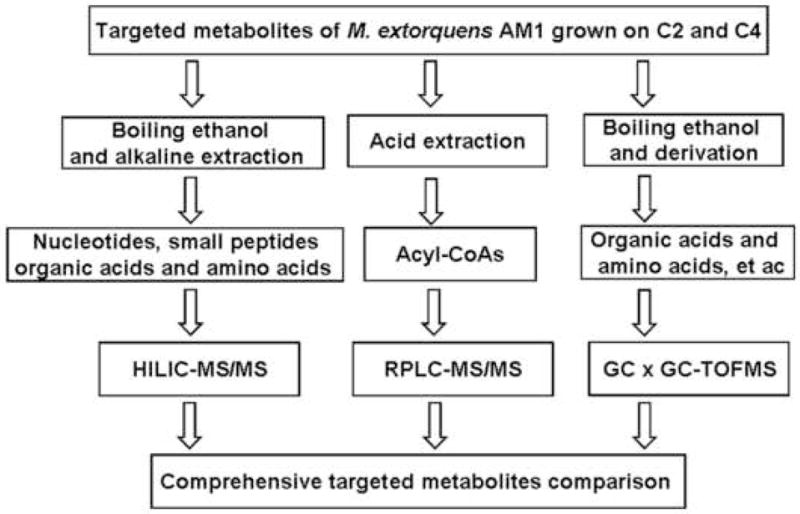
The work flow for comprehensive metabolite comparison of M. extorquens AM1 grown on C2 (ethylamine) and C4 (succinate) substrates by using a combination of LC-MS/MS and GC × GC-TOF-MS methods.
2.3.1 LC-MS/MS measurement
LC-MS/MS experiments were carried out on a Waters (Milford, MA, USA) LC-MS system consisting of a 1525μ binary HPLC pump with a 2777C autosampler coupled to a Quattro Micro API triple-quadrupole mass spectrometer (Micromass, Manchester, UK).
The mass spectrometer was operated in both the positive (3.5 kV) and negative (3.0 kV) electrospray ionization (ESI) modes and scanned using the MRM mode. Nitrogen was used as desolvation gas at 600 L/h and as cone gas at 50 L/h. The syringe pump was used to infuse standards in 50:50 methanol:water at a flow rate of 5 μL/min for MS/MS parameter determination. The mass spectrometer was first operated in Q1MS mode to confirm detection of the parent ion. It was then operated in MS/MS mode to look for the product ions for the selected parent. The collision energy and product ion mass were selected to optimize the signal-to-noise ratio. The MRM pairs of standard metabolites were glycine (ESI+, 75.9→29.9), serine (ESI+, 106.0→59.9), 3-hydroxybutyric acid (ESI−, 103.0→59.0), fumaric acid (ESI−, 114.9→70.9), malic acid (ESI−, 132.9→115), ethlymalonic acid (ESI−, 131.0→86.9), mesaconic acid (ESI−, 128.9→84.9), methylsuccinic acid (ESI−, 131.0→86.9), pyruvate (ESI−, 86.8→42.8), phosphoenolpyruvate (ESI−, 166.9→78.8), AMP (ESI+, 348.0→136.1), ADP (ESI+, 428.0→136.0), ATP (ESI+, 508.0→136.1), NAD (ESI+, 664.0→428.1), NADP (ESI+, 744.0→136.1), NADH (ESI+, 666.0→514.1), NADPH (ESI+, 746.0→729.1), glutathione oxidized (ESI+, 613.0→231.1), glutathione reduced (ESI+, 308.0→162.0), acetyl-CoA (ESI+, 810.1→303.3), butyryl-CoA (ESI+, 838.1→331.3), propionyl-CoA (ESI+, 824.1→317.3), hydroxybutyryl-CoA (ESI+, 854.1→347.3), succinyl-CoA (ESI+, 868.1→361.3).
LC solvents for the HILIC column (Luna NH2, 250 mm × 2 mm, 5 μm, Phenomenex, Torrance, CA, USA) method were the following: mobile phase A consisted of 20 mM ammonium acetate + 0.05% (v/v) ammonium hydroxide (28%) in water/acetonitrile/(95:5, v/v), pH 8.50, while mobile phase B was acetonitrile. The following linear gradient was used: 85%–0% B for 15 min, 0% B for 4 min, 0%–85% B for 1 min, 85% B for 15 min. The total run time was 35 min at 0.15 mL/min. For the reversed-phase (RP) column (YMC ODS-AQ, 100 mm × 2 mm, 3 μm, Waters) method, mobile phase A was 20 mM ammonium acetate in water with 0.16% (v/v) acetic acid, and mobile phase B was acetonitrile with 0.16% (v/v) acetic acid. A linear gradient was used: 5% B for 2 min, 5%–31.0% B for 16 min, 31.0%–90% B for 1 min, 90% B for 2 min, 90%–5% B for 1 min and 5% B for 10 min. The total run time was 32 min at 0.20 mL/min. The injection volume was 10 μL for both methods. The eluent from the LC column was directed into the ion source of mass spectrometer. The dwell time for each MRM transition was 0.1 s. All peaks were integrated using the Masslynx Quanlynx Applications Manager (version 4.1) software.
2.3.2 GC × GC-TOF-MS measurement
GC × GC-TOF-MS experiments were performed using a LECO Pegasus III time-of-flight mass spectrometer with the 4D upgrade (LECO Corp., St. Joseph, MI, USA). Column 1 was a 20 m Rtx-5 capillary column with an internal diameter of 250 μm and a film thickness of 0.5 μm and column 2 was a 2 m Rtx-200 (Restek, Bellefonte, PA, USA) with a 180 μm internal diameter and 0.2 μm film thickness. The two columns were joined by a cryogenic modulator with a modulation period of 1.5 s with a hot pulse time of 0.40 s. Ultra high purity helium was used as the carrier gas at constant flow mode of 1 mL/min. 1 μL of a given sample was injected in triplicate in split-less mode via an Agilent 7683 autosampler. The inlet temperature was set at 280°C. The temperature program used for column 1 began at 60 °C with a hold time of 0.25 min, then increased at 8 °C/min to 280 °C with a hold time at 280 °C for 10 min. Column 2 was held in a separate oven which was initially set at 70 °C and followed the same temperature program as column 1. The ion source temperature was set to 250 °C. Mass spectra were collected from m/z 40 to 600 at 100 spectra/s with a 5 min solvent delay.
2.3.3 Calibration curve and limit of detection
Calibration curves were obtained by analyzing standard solutions at seven concentrations ranging from 20 nM to 50 μM (20, 100, 500, 1000, 2500, 10 000, 50 000 nM). The limit of detection (LOD) was determined based on a calibration curve for each metabolite of interest (S/N >3).
2.4 Statistics and data processing
The experimental data were presented as the mean of four independent experiments. The significance of differences between the two different culture conditions was determined by t-tests (Microcal Origin 5.0). A p-value less than 0.05 was considered statistically significant. For GC × GC-TOF-MS, a target-analyte PARAFAC was used to deconvolute overlapping chromatographic peak profiles and mass spectra. The algorithm isolated the pure component peak profile and the pure mass spectrum of an individual component from overlapping peaks and background noise for quantification and identification, respectively [21]. The Fisher ratio analysis was written using Matlab 7.0.4 (The Mathworks, Natick, MA, USA). The algorithm extracted the individual m/z chromatogram and converted them into Matlab variables [19].
3. Results
3.1 Targeted metabolites analysis based on LC-MS/MS
In initial experiments, a HILIC column was used to separate and measure five classes of metabolites included nucleotides, acyl-CoAs, organic acids, small peptides and amino acids (Table 1) [5]. We found it difficult to separate all of the acyl-CoA compounds from other metabolites, and significant peak tailing for butyryl-CoA and acetyl-CoA with the HILIC column was also observed (data not shown for brevity). To obtain better analytical performance, complementary to the HILIC system, a C18 column (YMC AQ) combined with an aqueous-based mobile-phase produced a reversed-phase LC system, which was implemented to determine acyl-CoA metabolites [31].
Table 1.
Limit of detection (LOD, on column injected standards) for metabolites analyzed in targeted metabolites approach. For LC-MS/MS, metabolites were determined by HILIC-MS/MS except for Acyl-CoAs which were determined by RPLC-MS/MS.
| Metabolites | LOD (pmol) GC × GC-TOFMS | LOD (pmol) LC-MS/MS | Metabolites | LOD (pmol) GC × GC-TOFMS | LOD (pmol) LC-MS/MS |
|---|---|---|---|---|---|
| Amino acids | Mesaconic acid | 0.05 | 10 | ||
| Alanine | 0.03 | a | Methylsuccinic acid | 0.03 | 1 |
| Aspartic acid | 0.25 | a | Pyruvate | 0.015 | 7 |
| Cysteine | 0.25 | a | Phosphoenolpyruvate | 0.50 | 5 |
| Glutamic acid | 0.10 | a | Methylmalonic aicd | 0.05 | a |
| Glutamine | 0.25 | a | 2-Methylmalic acid | 0.04 | a |
| Glycine | 0.003 | 7.5 | Oxalic acid | 0.03 | a |
| Isoleucine | 0.02 | a | Glyceric acid | 0.03 | a |
| Leucine | 0.03 | a | Nucleotides | ||
| Phenylalanine | 0.25 | a | AMP | b | 1 |
| Proline | 0.05 | a | ADP | b | 2 |
| Serine | 0.05 | 2 | ATP | b | 2 |
| Threonine | 0.05 | a | NAD | b | 0.5 |
| Tyrosine | 0.10 | a | NADP | b | 0.5 |
| Valine | 0.025 | a | NADH | b | 2 |
| Carboxylic acids | NADPH | b | 4 | ||
| 3-Hydroxybutyric acid | 0.025 | 3.5 | Small peptides | ||
| α-Ketoglutaric acid | 0.075 | a | Glutathione oxidized | b | 1 |
| Citric acid | 0.075 | a | Glutathione reduced | b | c |
| Fumaric acid | 0.05 | 3 | Acyl-CoAs | ||
| Succinic acid | 0.05 | a | Acetyl-CoA | b | 2 |
| Malic acid | 0.05 | 0.5 | Butyryl-CoA | b | 1 |
| Glycolic acid | 0.005 | a | Hydroxybutyryl-CoA | b | 2 |
| Glyoxylic acid | 0.05 | a | Propionyl-CoA | b | 0.5 |
| Ethylmalonic acid | 0.05 | 1.5 | Succinyl-CoA | b | 0.5 |
: not applied to LC-MS/MS
: not applied to GC × GC-TOF-MS
: the analyte is not sufficiently stable to measure
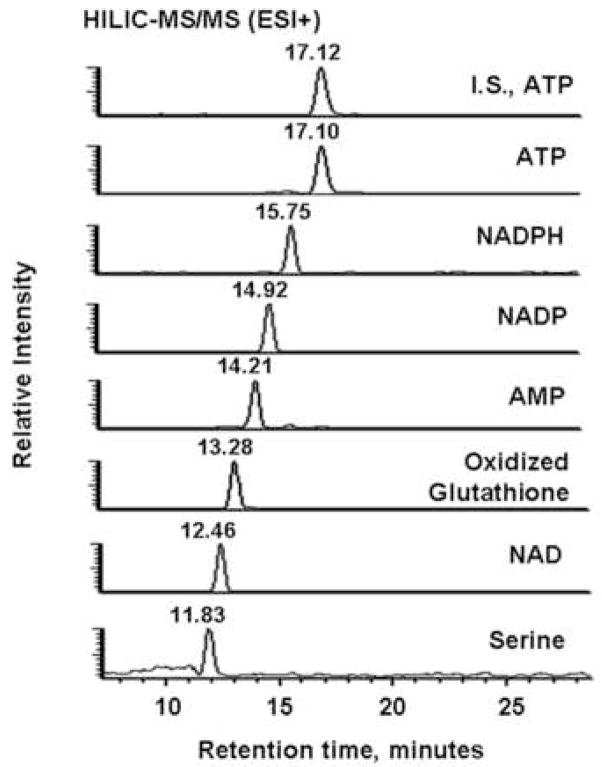
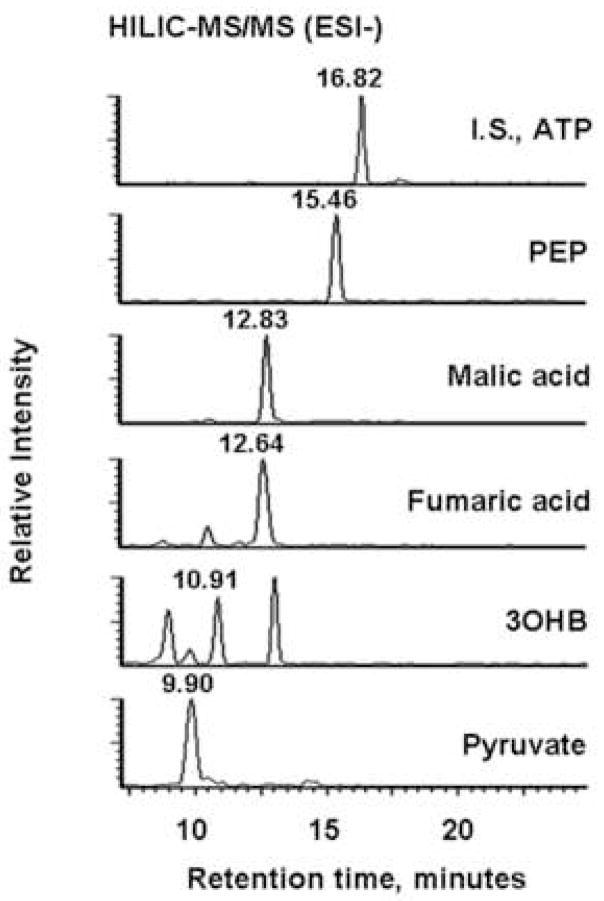
Figure 2 shows typical HILIC-MS/MS and RPLC-MS/MS chromatograms of extracts from M. extorquens AM1 grown on ethylamine. The HILIC column provided good retention and separation of nucleotides, small peptides and a few volatile metabolites with typical peak widths around 30 s (Figure 2A and B). The LOD (defined as the lowest concentration at which the signal-to-noise ratio is larger than 3) of most of these compounds ranged from around 0.5 to 4 pmol on column, and only glycine, mesaconic acid and pyruvate exhibited relatively poor sensitivities in the 7–10 pmol range. The RPLC separation produced generally better peak shapes and elution for acyl-CoAs, and yielded LODs, below 2 pmol (Figure 2C). Accordingly, Table 1 lists the name, analytical method and LOD for each targeted metabolite.
Figure 2.
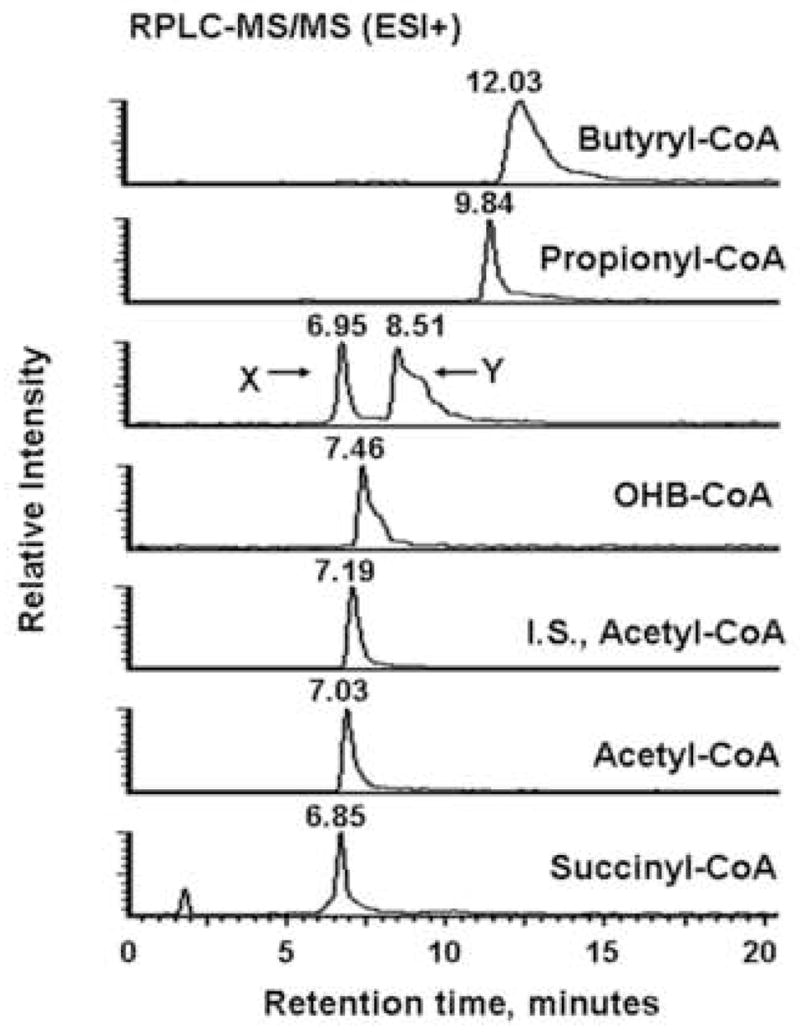
Typical LC-MS/MS chromatograms of targeted metabolites for extracts from M. extorquens AM1 grown on the ethylamine. (A) MRM-based measurement of the indicated seven metabolites and I.S. 13C10, 15N5-labeled ATP detected in positive ion mode. (B) Analogous data from negative mode. PEP, phosphoenolpyruvate; 3OHB, 3-hydroxybutyric acid. (C) Acyl-CoAs measurement in positive ion mode. 13C2-Labeled acetyl-CoA was the I.S. OHB-CoA, 3-hydroxybutyryl-CoA. Compounds labeled X and Y eluted at 6.75 min and 8.31 min and likely were methylsuccinyl-CoA and ethylmalonyl-CoA.
For most of the carboxylic acids, decarboxylation or the loss of water were the most intense fragmentation patterns. For example, the pseudomolecular ion m/z = 103 of 3-hydroxybutyric acid gave rise to a main product ion m/z = 59 resulting from decarboxylation. Also, the same transition 103 to 59 was observed at 9 min and 13 min from M. extorquens AM1 cell extracts (Figure 2 B). Therefore, these non-specific transitions could produce false positives in the complex mixtures found in cell extracts. In addition, some intermediates of interest for methylotrophic metabolism, such as glyoxylic acid, methylsuccinic acid and ethylmaonic acid were difficult to detect in M. extorquens AM1 cell extracts by LC-MS/MS (data not shown).
3.2 Targeted metabolites analysis based on GC × GC-TOF-MS
As a complementary approach, and to provide a more comprehensive coverage of the metabolites analyzed, we used GC × GC-TOF-MS followed by data processing using laboratory-written software, PARAFAC [21], to analyze small molar mass metabolites, primarily derivatized organic acids and amino acids. For most of the standards of volatile metabolites, the LODs ranged from 0.003 to 0.1 pmol, and the remaining metabolites had LODs below 0.5 pmol (Table l). Figure 3 shows a typical GC × GC-TOF-MS chromatogram of M. extorquens AM1 extract from ethylamine-grown cells plotted as a total ion current (TIC) 2D contour plot. In this chromatogram, more than 2,500 peaks were detected. Since cell extracts have a complex chemical composition, data analysis can become complicated due to interferences, solvent artifacts, and overlapping metabolite signals. The PARAFAC software allows for a precise and accurate quantification by mathematically resolving the GC × GC-TOF-MS signal from co-eluting compounds, thus providing the three profiles (column 1 peak, column 2 peak and mass spectrum for each metabolite). The resolved mass spectra obtained in the PARAFAC analyzed time window can be submitted to mass spectral database for a mass spectral search and identification [23].
Figure 3.
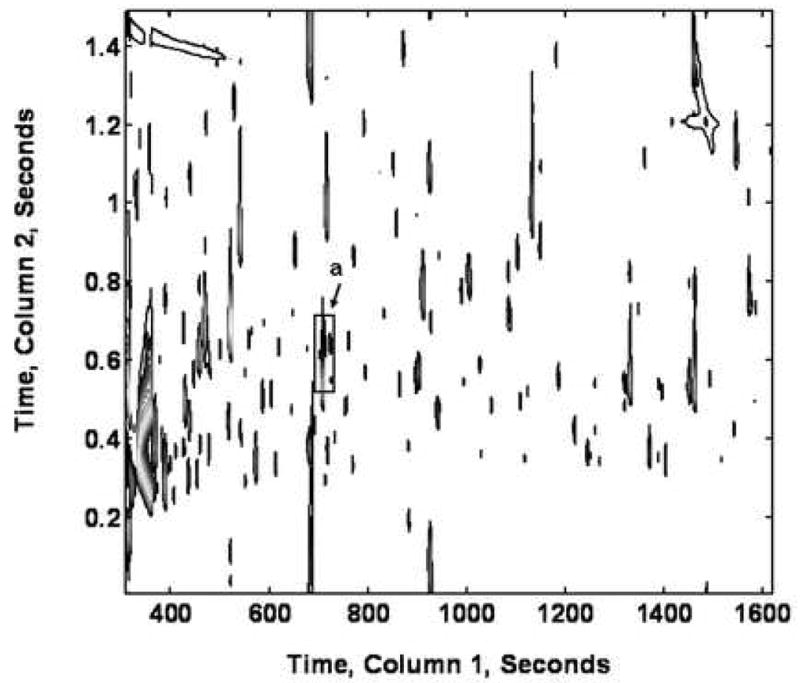
TIC contour plot of an ethylamine culture extract analyzed by GC × GC-TOF-MS as methoximed and trimethylsilylated derivatives. The box region (a) was identified as glycine (column 1, 714 s and column 2, 0.62 s).
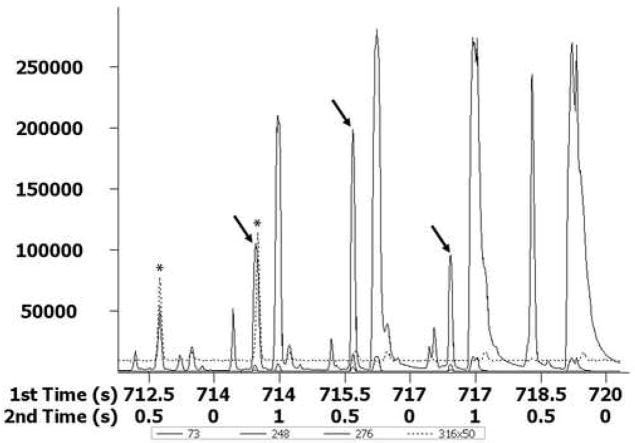
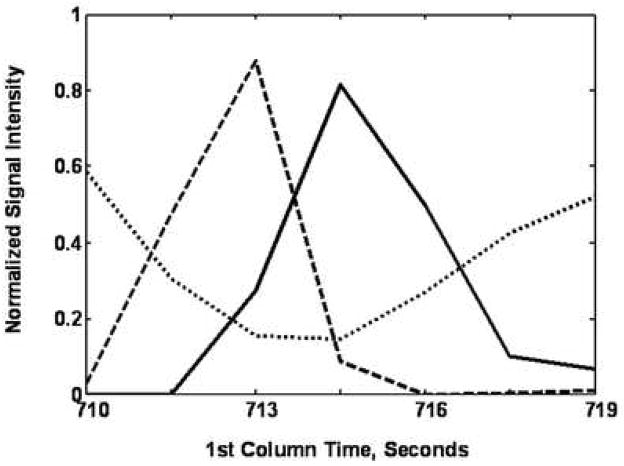
Examples of using PARAFAC on GC × GC-TOF-MS data are shown in Figure 4. Glycine was partially separated from other components by 2D-GC (Figure 4A). When PARAFAC was applied, the glycine peak was successfully mathematically resolved from the other overlapping components on both column 1 and column 2 (Figure 4B and C). The mathematically resolved signal for glycine was reconstructed to produce the 3D peak, by taking the cross product of the column 1 and column 2 peak profile vectors (Figure 4D). Integration of the 3D peak produced a peak volume used for quantification relative to an I. S. normalized peak volume for glycine.
Figure 4.
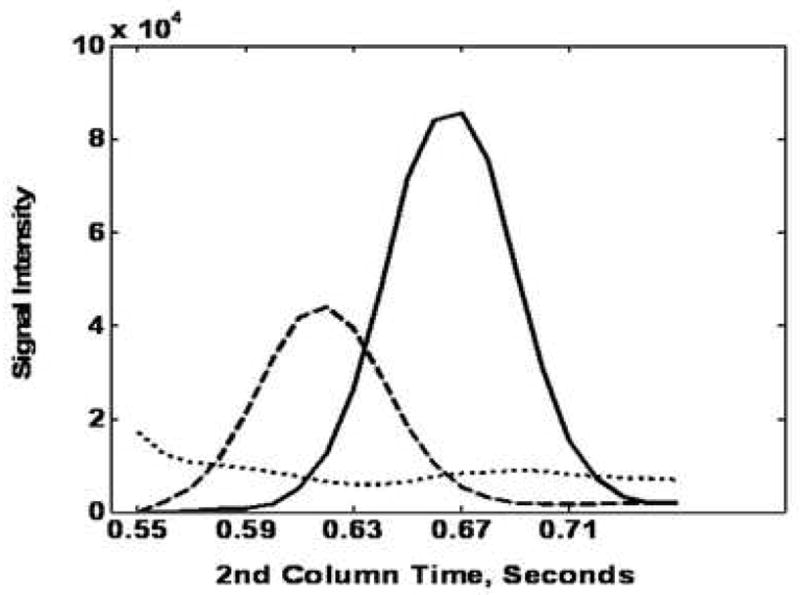
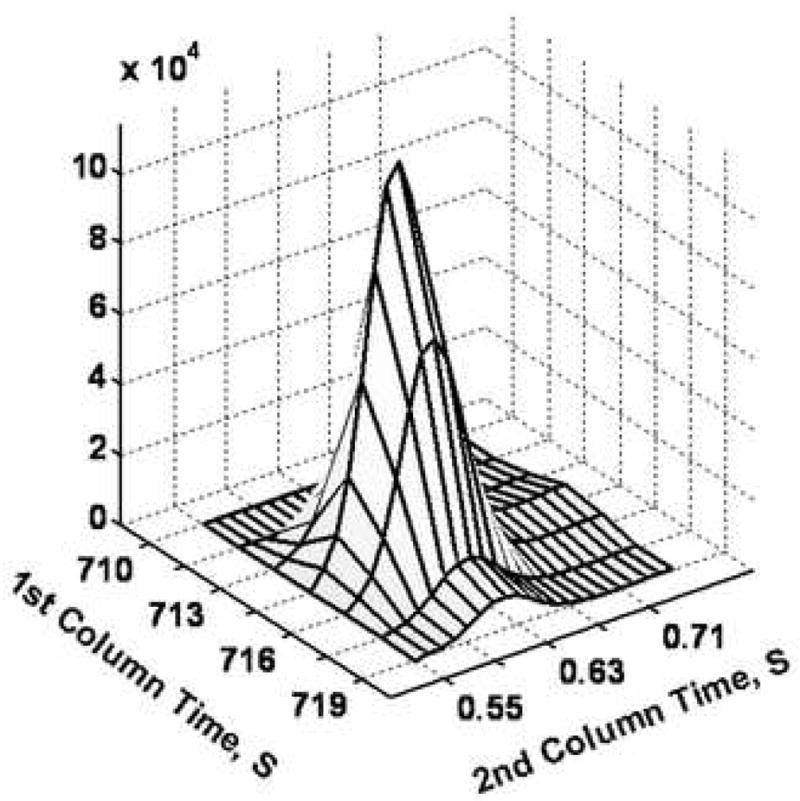
Demonstration of using PARAFAC for the quantification of a peak that was partially separated by the 2D separation (GC × GC-TOF-MS). (A) Raw data (vector) plot of the boxed region (a) in Figure 3 at mass channels (m/z) 73, 248, 276 and 316. The peaks (mass channels, 73, 248 and 276) with the arrows on top were identified as glycine, tri-TMS. The peaks (mass channel, 316) with the stars on top were overlapping component. (B) Column 1 profiles with glycine (solid line). (C) Column 2 profiles, with glycine (solid line). (D) 3D reconstruction of the glycine peak, obtained by taking the cross product of the column 1 and column 2 peak profiles for glycine from (B) and (C).
3.3 Intracellular metabolites changes for cells grown on two different carbon sources
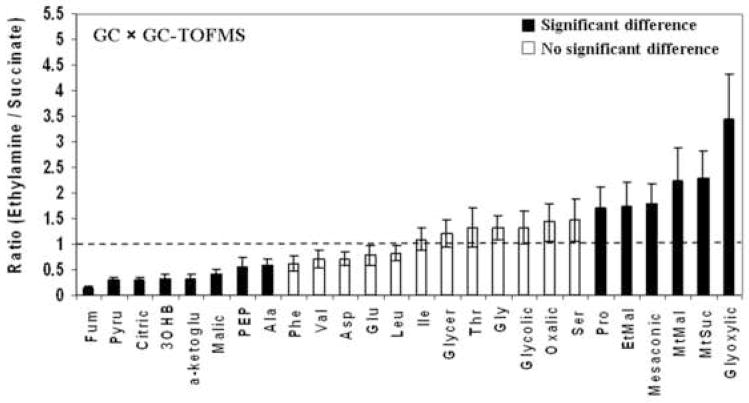
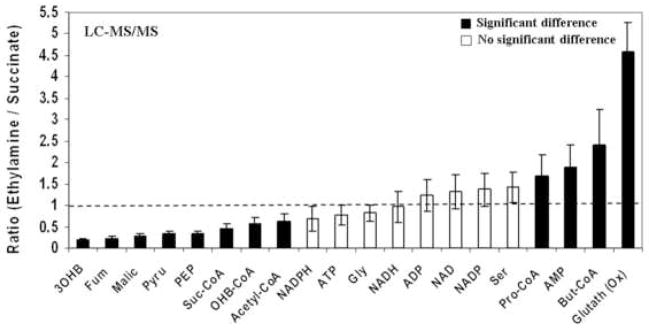
Using the above procedures, 39 targeted intermediates were analyzed, with quantitative information obtained, and 20 of them were found to differ significantly between the two carbon sources. Quantitative results summarized in Tables 2 and 3 are averages of four replicates, with an average relative standard deviation (RSD) of 18 % for GC × GC-TOF-MS and 20 % for LC-MS/MS, respectively. This average level of an RSD is typical for the anticipated biological variation, and is not significantly impacted due to the analytical methodology. The RSDs of NADH and NADPH were higher than 20% due to their instability during the sample extraction [29]. Seven volatile metabolites [serine, glycine, pyruvate, fumaric acid, malic acid, phosphoenolpyruvate (PEP) and 3-hydroxybutyric acid] were determined by both LC-based and GC-based methods, thus providing the opportunity to compare the performance of both methods relative to each other. However, glyoxylic acid, ethylmalonic acid, methylsuccinic acid and mesaconic acid were only able to be detected reproducibly by GC × GC-TOF-MS. The lowest concentration for a given metabolite from cells determined by LC-MS/MS was for 3-hydroxybutyryl-CoA at 0.073 μmol/g (injection concentration at 669.4 nM), and determined by GC × GC-TOF-MS for ethylmalonic acid at 0.015 μmol/g (injection concentration at 139.3 nM).
Table 2. List of metabolite concentrations determined by GC × GC-TOF-MS.
The absolute concentration of metabolites in M. extorquens AM1 cell extracts in picomole per gram of cell. Re/s is the ratio of intracellular metabolite concentrations in ethylamine and succinate cultures. The bold metabolites represent a significant difference (p < 0.05) between ethylamine and succinate cultures.
| Metabolites | Succinate (μmol/g) | Ethylamine (μmol/g) | Re/s |
|---|---|---|---|
| Alanine | 2.00 ± 0.28 | 1.18 ± 0.18 | 0.59 ± 0.11 |
| Valine | 0.88 ± 0.17 | 0.62 ± 0.11 | 0.70 ± 0.18 |
| Leucine | 0.92 ± 0.10 | 0.75 ± 0.11 | 0.81 ± 0.15 |
| Isoleucine | 0.49 ± 0.06 | 0.54 ± 0.09 | 1.10 ± 0.23 |
| Proline | 1.11 ± 0.18 | 1.90 ± 0.35 | 1.71 ± 0.42 |
| Glycine | 0.46 ± 0.08 | 0.61 ± 0.01 | 1.33 ± 0.23 |
| Serine | 0.24 ± 0.04 | 0.35 ± 0.08 | 1.46 ± 0.41 |
| Threonine | 1.37 ± 0.27 | 1.81 ± 0.39 | 1.32 ± 0.38 |
| Aspartic acid | 0.31 ± 0.04 | 0.22 ± 0.03 | 0.71 ± 0.13 |
| Glutamic acid | 20.93 ± 3.49 | 16.57 ± 2.96 | 0.79 ± 0.19 |
| Phenylalanine | 0.16 ± 0.02 | 0.10 ± 0.02 | 0.63 ± 0.15 |
| Pyruvate | 1.85 ± 0.40 | 0.52 ± 0.10 | 0.28 ± 0.09 |
| 3-Hydroxybutyric acid | 0.91 ± 0.17 | 0.30 ± 0.05 | 0.33 ± 0.08 |
| Glyceric acid | 0.60 ± 0.10 | 0.72 ± 0.10 | 1.20 ± 0.26 |
| Fumaric acid | 0.62 ± 0.13 | 0.086 ± 0.011 | 0.14 ± 0.02 |
| Malic acid | 2.13 ± 0.33 | 0.85 ± 0.15 | 0.40 ± 0.09 |
| α-Ketoglutaric acid | 0.81 ± 0.13 | 0.27 ± 0.04 | 0.33 ± 0.07 |
| Citric acid | 2.12 ± 0.48 | 0.60 ± 0.09 | 0.28 ± 0.07 |
| Succinic acid | a | 0.38 ± 0.06 | b |
| Phosphoenolpyruvate | 1.23 ± 0.24 | 0.70 ± 0.14 | 0.57 ± 0.16 |
| Oxalic acid | 0.75 ± 0.13 | 1.07 ± 0.19 | 1.43 ± 0.35 |
| Glycolic acid | 1.57 ± 0.29 | 2.09 ± 0.34 | 1.33 ± 0.33 |
| Methylsuccinic acid | 0.027 ± 0.005 | 0.062 ± 0.009 | 2.30 ± 0.54 |
| Mesaconic acid | 0.056 ± 0.010 | 0.100 ± 0.014 | 1.78 ± 0.40 |
| Methylmalonic aicd | 0.035 ± 0.006 | 0.078 ± 0.019 | 2.23 ± 0.66 |
| Ethylmalonic acid | 0.015 ± 0.003 | 0.026 ± 0.005 | 1.73 ± 0.48 |
| Glyoxylic acid | 0.032 ± 0.006 | 0.11 ± 0.02 | 3.43 ± 0.90 |
: not available as succinate was present as a carbon source
: not defined
Table 3. List of metabolite concentrations determined by LC-MS/MS.
The absolute concentration of metabolites in M. extorquens AM1 cell extracts in picomole per gram of cell. Re/s is the ratio of intracellular metabolite concentrations in ethylamine and succinate cultures. The bold metabolites denote a significant difference (p < 0.05) between ethylamine and succinate cultures.
| Metabolites | Succinate (μmol/g) | Ethylamine (μmol/g) | Re/s |
|---|---|---|---|
| ATP | 2.84 ± 0.61 | 2.22 ± 0.45 | 0.78 ± 0.23 |
| ADP | 1.53 ± 0.37 | 1.89 ± 0.35 | 1.23 ± 0.38 |
| AMP | 0.27 ± 0.06 | 0.51 ± 0.08 | 1.89 ± 0.51 |
| NAD | 1.51 ± 0.36 | 2.00 ± 0.36 | 1.32 ± 0.40 |
| NADP | 0.36 ± 0.08 | 0.49 ± 0.08 | 1.36 ± 0.37 |
| NADH | 1.26 ± 0.35 | 1.22 ± 0.30 | 0.97 ± 0.36 |
| NADPH | 1.21 ± 0.40 | 0.84 ± 0.21 | 0.69 ± 0.29 |
| Glyine | 0.28 ± 0.05 | 0.23 ±0.03 | 0.82 ± 0.18 |
| Serine | 0.19 ± 0.04 | 0.27 ± 0.04 | 1.42 ± 0.36 |
| Pyruvate | 1.51 ± 0.23 | 0.50 ± 0.08 | 0.33 ± 0.07 |
| Fumaric acid | 0.69 ± 0.15 | 0.15 ± 0.02 | 0.22 ± 0.05 |
| Malic acid | 1.33 ± 0.30 | 0.37 ± 0.06 | 0.28 ± 0.08 |
| Phosphoenolpyruvate | 0.75 ± 0.13 | 0.25 ± 0.04 | 0.33 ± 0.08 |
| 3-Hydroxybutyric acid | 0.59 ± 0.12 | 0.11 ± 0.02 | 0.19 ± 0.05 |
| Butyryl-CoA | 0.48 ± 0.12 | 1.16 ± 0.26 | 2.42 ± 0.81 |
| Propionyl-CoA | 0.29 ± 0.07 | 0.49 ± 0.08 | 1.69 ± 0.49 |
| 3-Hydroxybutyryl-CoA | 0.13 ± 0.03 | 0.073 ± 0.013 | 0.56 ± 0.14 |
| Acetyl-CoA | 0.64 ± 0.14 | 0.40 ± 0.07 | 0.62 ± 0.16 |
| Succinyl-CoA | 0.37 ± 0.07 | 0.17 ± 0.03 | 0.46 ± 0.12 |
The abundance ratio for metabolites measured at two growth media conditions was then assessed. Figure 5 shows the abundance ratios in the ethylamine (C2) samples relative to the succinate (C4) samples. Ratios outside the 1.0 ± 0.2 range indicated significant difference of absolute concentration (p<0.05) for each metabolite. The ratios of most of the amino acids and nucleotides were not significantly different in extracts of cells grown on either ethylamine or succinate. The exceptions were alanine, which was lower in ethylamine, and proline and AMP, which were higher in ethylamine. For the carboxylic acids, citric acid, fumaric acid, malic acid, pyruvate, 3-hydroxybutyric acid, α-ketoglutaric acid and PEP were found to be less abundant in ethylamine samples (ratio < 0.6), while methylsuccinic, methylmalonic and glyoxylic acid were observed to be more abundant in ethylamine samples (ratio > 1.4). For the acyl-CoAs compounds, the ethylamine samples had 2.3-fold higher butyryl-CoA and 1.6 fold higher propionyl-CoA compared to the succinate samples, while succinyl-CoA and 3-hydroxybutyryl-CoA were lower in ethylamine samples (ratio < 0.6). In addition, oxidized glutathione was four times higher in ethylamine culture samples compared to succinate culture samples.
Figure 5.
The abundance ratio of intracellular metabolites of M. extorquens AM1 cells between ethylamine culture and succinate culture: (A) GC × GC-TOF-MS, (B) LC-MS/MS. The abbreviation used are α-ketoglu, α-ketoglutaric acid; Pyru, pyruvate; Fum, fumaric acid; Glycer, glyceric acid; MtMal, methylmalonic acid; 3OHB, 3-hydroxybutyric acid; EtMal, ethylmalonic acid; MtSuc, methylsuccinic acid; PEP, phosphoenolpyruvate; Suc-CoA, Succinyl-CoA; OHB-CoA, 3-hydroxybutyryl-CoA; Pro-CoA, Propionyl-CoA; But-CoA, Butyryl-CoA; Glutath (Ox), oxidized glutathione.
3.4 Untargeted metabolite identification based on the Fisher ratio method and PARAFAC
Fisher ratio analysis calculates a Fisher ratio for each data point in the 2D separation space of the GC × GC-TOF-MS data based on the ratio of the class-to-class variation and within-class variation, therefore it is well suited for the analysis of data sets of biological samples, and for discovery-based applications in which class membership is known beforehand, which is the case here, with the C2 and C4 growth conditions [19]. More importantly, Fisher ratio analysis can reduce the entire data set in an automated fashion to locate sample class-differentiating peak locations, thereby greatly decreasing the amount of data included in a comparison study. In this study, 21 GC × GC-TOF-MS chromatograms (11 ethylamine samples and 10 succinate samples) were submitted to Fisher ratio analysis. Fisher ratios for mass channels m/z 40 to 400 were summed to obtain a 2D sum of Fisher ratios plot (Figure 6). The locations of the top 28 peaks with the greatest 2D sum of Fisher ratio values were analyzed via PARAFAC, and the mass spectra obtained further matched to library mass spectra. The class-distinguishing metabolites for 16 of these peaks were identified, while 12 compounds were not found in the available libraries and not identified. Of the 16 identified metabolites, 7 (pyruvate, alanine, 3-hydroxybutyric acid, methylsuccinic acid, fumaric acid, α-ketoglutaric acid and citric acid) had been found to have significant differences in the targeted metabolites analysis. Therefore in these cases, Fisher ratio analysis also confirmed the findings of the targeted metabolites analysis. The identified differentiating metabolites between ethylamine cultures and succinate cultures were further accurately quantified by using PARAFAC software. Retention times, peak volumes (Vs for peak volume in succinate and Ve for peak volume in ethylamine), library match scores, and the abundance ratios of ethylamine to succinate (Ve/Vs) are listed in Table 4.
Figure 6.
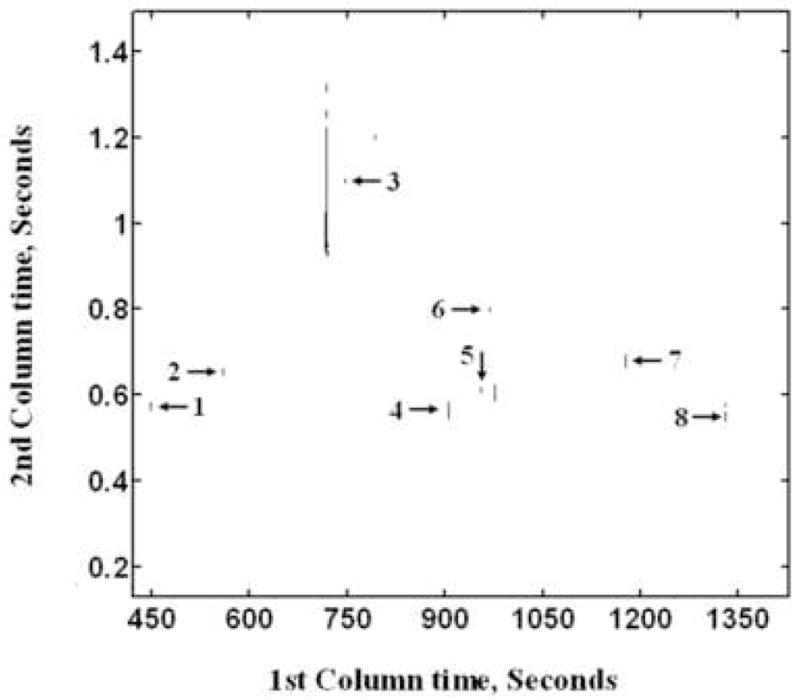
The 2D sum of Fisher ratio plots for m/z 40 to 400. Compounds identified by matching to library mass spectra are labeled as (1) pyruvate, (2) 3-hydroxybutyric acid, (3) fumaric acid, (4) 3-oxoglutaric acid, (5) 2-hydroxyglutaric acid, (6) α-ketoglutaric acid, (7) citric acid, (8) palmitic acid.
Table 4.
Metabolites identified by Fisher ratio analysis at m/z 40 to m/z 400. tR, 1 and tR, 2 are the retention time in the first column and second column, respectively. The peak volume in ethylamine samples (Ve) and in succinate samples (Vs) were calculated by using PARAFAC (cross product of column 1 profile with column 2 profile and peak volume measured relative to baseline). Re/s is the ratio of Ve to Vs. The bold metabolites were quantified by the targeted metabolite analysis.
| Metabolites | tR, 1 (s) | tR, 2 (s) | Match value | Vs | Ve | Re/s |
|---|---|---|---|---|---|---|
| Pyruvate | 450.0 | 0.57 | 902 | 1.76e6 ±0.39e6 | 4.99e5 ± 0.95e5 | 0.28 ± 0.08 |
| Lactic acid | 460.5 | 0.62 | 960 | 2.21e6 ± 0.37e6 | 8.52e5 ± 1.19e5 | 0.39 ± 0.08 |
| Alanine | 502.5 | 1.39 | 925 | 4.21e6 ± 0.59e6 | 2.48e6 ± 0.37e6 | 0.59 ± 0.12 |
| 3-Hydroxybutyric acid | 559.5 | 0.65 | 878 | 2.76e6 ± 0.52e6 | 8.39e5 ± 1.42e5 | 0.30 ± 0.07 |
| Benzoic acid | 654.0 | 0.87 | 923 | 1.05e7 ± 0.19e7 | 3.62e6 ± 0.45e6 | 0.34 ± 0.07 |
| Glycerol | 684.0 | 0.36 | 904 | 1.67e7 ± 0.35e7 | 9.69e6 ± 1.74e6 | 0.58 ± 0.16 |
| Methylsuccinic acid | 729.0 | 0.95 | 882 | 2.26e5 ± 0.41e5 | 4.80e5 ± 0.72e5 | 2.22 ± 0.51 |
| Fumaric acid | 748.5 | 1.10 | 935 | 1.09e6 ± 0.23e6 | 1.52e5 ± 0.20e5 | 0.14 ± 0.03 |
| 2-Methylmalic acid | 880.5 | 0.71 | 831 | 6.61e5 ± 1.45e5 | 2.32e5 ± 0.44e5 | 0.35 ±0.10 |
| 3-Oxoglutaric acid | 906.0 | 0.57 | 739 | a | 7.31e6 ± 1.46e6 | b |
| 2-Hydroxyglutaric acid | 955.5 | 0.61 | 830 | a | 4.60e5 ±0.78e5 | b |
| α-Ketoglutaric acid | 969.0 | 0.80 | 929 | 1.37e6 ± 0.22e6 | 4.35e5 ± 0.65e5 | 0.32 ± 0.07 |
| Glycerol-3-phosphate | 1134.0 | 1.01 | 938 | 2.52e7 ± 0.53e7 | 1.01e7 ± 0.17e7 | 0.40 ± 0.10 |
| Citric acid | 1179.0 | 0.67 | 943 | 5.78e6 ± 1.32e6 | 1.27e6 ± 0.19e6 | 0.22 ± 0.06 |
| Myristic acid | 1186.5 | 0.56 | 928 | 5.25e6 ± 0.84e6 | 2.38e6 ± 0.45e6 | 0.45 ± 0.11 |
| Palmitic acid | 1332.0 | 0.56 | 936 | 3.19e7 ± 0.57e7 | 8.21e6 ±1.89e6 | 0.26 ± 0.07 |
: not detected
: not defined
4. Discussion
The major objective of this work was to develop and apply a comprehensive metabolomic approach to compare the change of central metabolites pools of M. extorquens AM1 cells grown on two different carbon sources. In this regard, a single assay that would detect as many central metabolites as possible would greatly facilitate physiological studies. Recent advances in LC column technology, such as an HILIC column separation coupled to ESI-MS/MS, allow the detection of many non-volatile and volatile compounds in a single run, while volatile compounds have been well-known to be suited for analysis by GC-MS [5, 6, 11]. In this study, we initially assessed detection of intermediates involved in central carbon metabolism by using LC-MS/MS methods (Table 1). Our focus was not only to set up an analytical method to measure analytes of standards, but also to determine concentrations of metabolites in M. extorquens AM1 cells extracts.
Several classes of polar metabolites of M. extorquens AM1 cell extracts, such as nucleotides, some organic acids and short-chain acyl-CoA compounds, showed good separation and peak sensitivity using LC-MS/MS (Figure 2 and Table 1, 3). Acyl-CoAs were somewhat challenging for LC since they are often poorly separated using typical reversed-phase LC methods, or HILIC chromatography without ion-pairing [32]. Here, we applied a C18 column with hydrophilic properties and a corresponding mobile phase to improve the separation of acyl-CoAs, and avoided the addition of a traditional ion-pairing agent due to its adverse affect on the ESI process [33]. For the targeted organic and amino acids, their standards, for the most part, could be effectively determined by HILIC-MS/MS and representative metabolites, i.e. pyruvate, glycine, serine, PEP and 3-hydroxybutyric acid were determined from M. extorquens AM1 cell extracts, as well (Figure 2 and Table 3). This was consistent with published reports showing it was possible to measure the pool sizes of polar volatile metabolites from complex biology extracts using HILIC-MS/MS [5, 6, 34]. However, some other carboxylic acids, which were known to be of specific importance for M. extorquens AM1 growth, were either not reproducibly detected (methylmalonic and mesaconic acids) or not detected at all (glyoxylic acid) in LC-MS chromatograms of M. extorquens AM1. This result was likely due to their low concentrations (injection concentration at 500 nM or lower) or inherent ion suppression. In addition, some isomers, such as methylsuccinic acid and ethylmalonic acid, which have the same MRM transition and can not be fully separated by LC, are difficult to be clearly distinguished. For malic and fumaric acids having similar chemical structures and close chromatographic retention times, the in-source loss of water from malic acid contributed to a fumaric acid signal response (Figure 2B). Therefore, although the LC-MS/MS methods have a specificity in the nucleotides, acyl-CoAs and amino acids of the targeted metabolites list, there are key sensitivity and resolution issues in analyses of volatile compounds in biological samples, especially within the low mass range (m/z <300).
The combination of LC-MS methods with GC-MS methods can provide greater coverage of the metabolome. Vanderwerf et al. were able to detect more than 100 metabolite peaks from E. coli by using combined GC-MS and LC-MS methods [9]. A similar result was achieved by Tu et al. from Sacccharomyces cerevisiae, in which 29 metabolites were only detected by GC-MS and 12 metabolites by LC-MS only [10]. In our case, GC × GC-TOF-MS overcame the low detection sensitivity and poor separation issues of LC-MS/MS for many key metabolites, like those noted above, and also could minimize the risk of false identification. As expected, the LOD of amino acids and organic acids was generally lower when they were analyzed by GC × GC-TOF-MS (Table 1). Since many overlapping compounds could contribute to the intensity of the chromatographic signal at the selected m/z and interfere with the accurate quantification of metabolites, each of the targeted metabolites in the cell extracts was further quantified by using PARAFAC. PARAFAC was shown many times to remove background noise and mathematically resolve co-eluting components (Figures 4), e.g., it was successfully used to deconvolute completely overlapping peaks of two amino acids or two isomers organic acids. As a result, GC × GC-TOF-MS and PARAFAC determined many low abundance metabolites, exhibiting an average RSD of 18% for the samples (Table 2), which is a very good precision for samples with biological and preparation variations. Moreover, of the 7 representative volatile metabolites that could be determined by both GC × GC-TOF-MS and LC-MS/MS, all except fumaric acid showed a consistently lower concentration in the LC-MS/MS measurement, probably due to ESI ion suppression and matrix effects, but their abundance ratio was found to be quite similar in most cases (Table 2 and 3, Figure 5). This overlap between the GC × GC-TOF-MS and LC-MS/MS methods, albeit a modest number of metabolites, was highly useful as a quality control for the quantification of metabolites by the different analytical methods. The current research reported herein provides a good example showing that combining GC × GC-TOF-MS and LC-MS/MS is a useful strategy for global metabolite analysis, since their complementary nature aids to maximize the number of metabolites and their overlap characteristic helps to validate accuracy. In addition, the determined metabolite concentrations showed a general reproducibility with RSD < 19 %. It is likely that some of these concentrations represent minimum estimates due to metabolite degradation [35].
The presented LC-MS/MS and GC × GC-TOF-MS methods, in concert, allowed us to make a global comparison of metabolite pool sizes between ethylamine and succinate cultures. For example, several intermediates of the TCA cycle, such as citric acid, α-ketoglutaric acid and succinyl-CoA were found to be in low abundance under the ethylamine growth conditions. This is a reflection that these are different metabolic modes using different pathways for growth and was consistent with the much slower growth rate of ethylamine-grown cells as compared to succinate-grown cells. A few compounds were significantly elevated in the ethylamine samples, including two that have been suggested to be part of a pathway for converting acetyl-CoA to glyoxylic acid [36]: glyoxylic acid itself and methylsuccininc acid (the acid derivative of the intermediate methylsuccinyl-CoA). In addition, butyryl-CoA that is not part of the proposed pathway was elevated in the ethylamine sample, suggesting it may have specific roles in C2 metabolism. 3-hydroxybutyric acid measured by GC × GC-TOF-MS had a lower concentration in ethylamine samples, which matched well the result from the LC-MS/MS that 3-hydroxybutyryl-CoA in the ethylamine sample was lower than in the succinate sample. Finally, Fisher ratio analysis was applied to GC × GC-TOF-MS data to investigate the possibility of discovering other differences between ethylamine and succinate samples. Fisher ratio analysis found that 3-oxoglutaric acid and 2-hydroxyglutaric acid have significantly higher amounts in ethylamine samples, which implies they might play an important role in C2 metabolism. Also myristic and palmitic acid concentrations were increased in the succinate samples, suggesting that fatty acids and other lipids synthesis might be another important metabolic difference between C2 and C4 cultures.
5. Conclusions
The combination of LC-MS/MS and GC × GC-TOF-MS methods were developed and applied to determine 39 targeted metabolites involved in central carbon metabolism of M. extorquens AM1 grown on two carbon sources. The metabolites with low volatility, including nucleotides and acyl-CoAs, were ideal for the LC-MS/MS measurement with RSD <20%. Volatile intermediates (within low mass range <300m/z) at low concentrations (<500 nM) were better quantification by GC × GC-TOF-MS from M. extorquens AM1 cell extracts. GC × GC-TOF-MS and PARAFAC data analysis improved the sensitivity and separation issue for these intermediates, providing reproducible measurement of many low abundance carboxylic acids (concentrations ranged from 139 nM to 500 nM). The results demonstrate that the combination of LC-MS/MS and GC × GC-TOF-MS is a good strategy for comprehensive metabolites analysis, and the results provide a valuable insight for analyzing metabolic modes that are linked to C2 and C4 metabolism.
Acknowledgments
We would like to thank Jamin C. Hoggard and Elizabeth M. Humston for assistance with the GC × GC-TOF-MS instrumentation and data analysis procedures. This work was funded by a grant to M.E.L. from NIGMS (GM58933) and a China Scholarship Council scholarship to S.Y.
Footnotes
Publisher's Disclaimer: This is a PDF file of an unedited manuscript that has been accepted for publication. As a service to our customers we are providing this early version of the manuscript. The manuscript will undergo copyediting, typesetting, and review of the resulting proof before it is published in its final citable form. Please note that during the production process errors may be discovered which could affect the content, and all legal disclaimers that apply to the journal pertain.
References
- 1.Hollywood K, Brison DR, Goodacre R. Proteomics. 2006;6:4716. doi: 10.1002/pmic.200600106. [DOI] [PubMed] [Google Scholar]
- 2.Fiehn O. Trends Anal Chem. 2008;27:261. doi: 10.1016/j.trac.2008.01.007. [DOI] [PMC free article] [PubMed] [Google Scholar]
- 3.Koek M, Muilwijk B, van der Werf MJ, Hankemeier T. Anal Chem. 2006;78:1272. doi: 10.1021/ac051683+. [DOI] [PubMed] [Google Scholar]
- 4.Kind T, Tolstikov V, Fiehn O, Weiss RH. Anal Biochem. 2007;363:185. doi: 10.1016/j.ab.2007.01.028. [DOI] [PubMed] [Google Scholar]
- 5.Bajad SU, Lu W, Kimball EH, Yuan J, Peterson C, Rabinowitz JD. J Chromatogr A. 2006;1125:76. doi: 10.1016/j.chroma.2006.05.019. [DOI] [PubMed] [Google Scholar]
- 6.Tolstikov VV, Fiehn O. Anal Biochem. 2002;301:298. doi: 10.1006/abio.2001.5513. [DOI] [PubMed] [Google Scholar]
- 7.Gika HG, Theodoridis GA, Wilson ID. J Sep Sci. 2008;31:1598. doi: 10.1002/jssc.200700644. [DOI] [PubMed] [Google Scholar]
- 8.Garcia DE, Baidoo EE, Benke PI, Pingitore F, Tang Y, Villa S, Keasling JD. Curr Opin Micro. 2008;11:233. doi: 10.1016/j.mib.2008.04.002. [DOI] [PubMed] [Google Scholar]
- 9.van der Werf MJ, Overkamp KM, Muilwijk B, Coulier L, Hankemeier T. Anal Biochem. 2007;370:17. doi: 10.1016/j.ab.2007.07.022. [DOI] [PubMed] [Google Scholar]
- 10.Tu BP, Mohler RE, Liu JC, Dombek KM, Young ET, Synovec RE, McKnight SL. Proc Natl Acad Sci USA. 2007;104:16886. doi: 10.1073/pnas.0708365104. [DOI] [PMC free article] [PubMed] [Google Scholar]
- 11.Kiefer P, Portais JC, Vorholt JA. Anal Biochem. 2008;382:94. doi: 10.1016/j.ab.2008.07.010. [DOI] [PubMed] [Google Scholar]
- 12.Luo B, Groenke K, Takors R, Wandrey C, Oldiges M. J Chromatogr A. 2007;1147:153. doi: 10.1016/j.chroma.2007.02.034. [DOI] [PubMed] [Google Scholar]
- 13.Rabinowitz JD. Expert Rev Proteomics. 2007;4:187. doi: 10.1586/14789450.4.2.187. [DOI] [PubMed] [Google Scholar]
- 14.Horie K, Kimura H, Ikegami T, Iwatsuka A, Saad N, Fiehn O, Tanaka N. Anal Chem. 2007;79:3764. doi: 10.1021/ac062002t. [DOI] [PubMed] [Google Scholar]
- 15.Tranchida PQ, Dugo P, Dugo G, Mondello L. J Chromatogr A. 2004;1054:3. [PubMed] [Google Scholar]
- 16.Mohler RE, Dombek KM, Hoggard JC, Young ET, Synovec RE. Anal Chem. 2006;78:2700. doi: 10.1021/ac052106o. [DOI] [PMC free article] [PubMed] [Google Scholar]
- 17.Welthagen W, Schnelle-Kreis J, Zimmermann R. J Chromatogr A. 2003;1019:233. doi: 10.1016/j.chroma.2003.08.053. [DOI] [PubMed] [Google Scholar]
- 18.Zrostlikova J, Hajslova J, Cajka T. J Chromatogr A. 2003;1019:173. doi: 10.1016/s0021-9673(03)01302-5. [DOI] [PubMed] [Google Scholar]
- 19.Pierce KM, Hoggard JC, Hope JL, Rainey PM, Hoofnagle AN, Jack RM, Wright RW, Synovec RE. Anal Chem. 2006;78:5068. doi: 10.1021/ac0602625. [DOI] [PubMed] [Google Scholar]
- 20.Yang S, Lu S, Yuan Y. Biochim Biophys Acta. 2008;1781:123. doi: 10.1016/j.bbalip.2007.11.005. [DOI] [PubMed] [Google Scholar]
- 21.Hoggard JC, Synovec RE. Anal Chem. 2007;79:1611. doi: 10.1021/ac061710b. [DOI] [PubMed] [Google Scholar]
- 22.Chistoserdova L, Chen SW, Lapidus A, Lidstrom ME. J Bacteriol. 2003;185:2980. doi: 10.1128/JB.185.10.2980-2987.2003. [DOI] [PMC free article] [PubMed] [Google Scholar]
- 23.Guo X, Lidstrom ME. Biotech Bioeng. 2008;99:929. doi: 10.1002/bit.21652. [DOI] [PubMed] [Google Scholar]
- 24.Bosch G, Skovran E, Xia QW, Wang T, Taub F, Miller JA, Lidstrom ME, Murray H. Proteomics. 2008;8:3494. doi: 10.1002/pmic.200800152. [DOI] [PMC free article] [PubMed] [Google Scholar]
- 25.Dunstan PM, Drabble WT, Anthony C. Biochem J. 1972b;128:107. doi: 10.1042/bj1280107. [DOI] [PMC free article] [PubMed] [Google Scholar]
- 26.Large PJ, Quayle JR. Biochem J. 1963;87:386. doi: 10.1042/bj0870386. [DOI] [PMC free article] [PubMed] [Google Scholar]
- 27.Peel D, Quayle JR. Biochem J. 1961;81:465. doi: 10.1042/bj0810465. [DOI] [PMC free article] [PubMed] [Google Scholar]
- 28.Avery EL, Dunstan RH, Nell JA. Arch Environ Contam Toxicol. 1998;35:229. doi: 10.1007/s002449900371. [DOI] [PubMed] [Google Scholar]
- 29.Guo X, Lidstrom ME. Arch Microbiol. 2006;186:139. doi: 10.1007/s00203-006-0131-7. [DOI] [PubMed] [Google Scholar]
- 30.Wadler C, Cronan JE. Anal Biochem. 2007;368:17. doi: 10.1016/j.ab.2007.05.031. [DOI] [PMC free article] [PubMed] [Google Scholar]
- 31.Dalluge JJ, Gort S, Hobson R, Selifonova O, Amore F, Gokarn R. Anal Bioanal Chem. 2002;374:835. doi: 10.1007/s00216-002-1554-x. [DOI] [PubMed] [Google Scholar]
- 32.Cao L, Chiou W, Tang H, Cheng X, Camp HS, Burns DJ. J Chromatogr B. 2007;853:303. doi: 10.1016/j.jchromb.2007.03.029. [DOI] [PubMed] [Google Scholar]
- 33.Gao S, Bhoopathy S, Zhang ZP, Wright DS, Jenkins R, Karnes HT. J Pharm Biomed Anal. 2006;40:679. doi: 10.1016/j.jpba.2005.05.022. [DOI] [PubMed] [Google Scholar]
- 34.Godejohann M. J Chromatogr A. 2007;1156:87. doi: 10.1016/j.chroma.2006.10.053. [DOI] [PubMed] [Google Scholar]
- 35.Kimball E, Rabinowitz JD. Anal Biochem. 2006;358:273. doi: 10.1016/j.ab.2006.07.038. [DOI] [PMC free article] [PubMed] [Google Scholar]
- 36.Erb TJ, Berg IA, Brecht V, Müller M, Fuchs G, Alber BE. Proc Natl Acad Sci USA. 2007;104:10631. doi: 10.1073/pnas.0702791104. [DOI] [PMC free article] [PubMed] [Google Scholar]


