

Abstract
Dendritic cell (DC) development begins in the bone marrow but is not completed until after immature progenitors reach their sites of residence in lymphoid organs. The hematopoietic growth factors regulating these processes are poorly understood. Here we examine the effects of FMS-like tyrosine kinase 3 (Flt3) signaling on macrophage DC progenitors (MDP) in the bone marrow and on peripheral DCs. We find that the MDP compartment is responsive to super–physiologic levels of Flt3 ligand (Flt3L) but is not dependent on Flt3 for its homeostatic maintenance in vivo. In contrast, Flt3 is essential in regulation of homeostatic DC development in the spleen where it is required to maintain normal numbers of DCs by controlling their division in the periphery.
Introduction
Dendritic cells (DC) are a heterogeneous group of specialized antigen presenting cells that maintain peripheral tolerance and induce adaptive immune responses1,2. Three major groups of DCs have been defined: antigen-presenting conventional DCs (cDCs) found in lymphoid organs such as spleen; type I interferon secreting plasmacytoid DC (pDC); and migratory DC (mDC) such as epidermal Langerhans cells or dermal DC which capture antigens and deliver them to T cells in lymphoid organs3,4.
cDCs, some tissue macrophages, and monocytes originate from a common precursor designated as macrophage DC progenitor (MDP)5,6. Others have uncovered a common DC precursor (CDP) that is restricted to cDC and pDC development but the macrophage potential of CDP and its precise relationship to MDP was not determined7,8. Nevertheless, MDP, CDP or their progeny enter the circulation and are rapidly cleared due to migration into lymphoid tissues where they undergo a limited number of cell divisions while differentiating into DCs9. DC proliferation in the spleen contributes to maintaining the size of the peripheral DC pool and can also prolong antigen presentation9-11. Little is known about how DC proliferation in the periphery is regulated, and among the known DC growth factors, only lymphotoxin-β has been implicated in helping maintain CD8− cDC homeostasis by regulating cell division in the periphery10.
Flt3 (Flk2, CD135) is broadly expressed on early hematopoietic precursors in the bone marrow12. Consistent with this expression pattern, Flt3 ligand (Flt3L, Flk2L) injection increases the numbers of early myeloid and lymphoid progenitors, but not committed T or B cell precursors and this is accompanied by increases in peripheral DCs13,14, granulocytes, monocytes, and polymorphonuclear neutrophils (PMN) leading to the conclusion that the effect of Flt3L is BM restricted12. In addition, inhibition of Flt3-mediated signals results in reduced numbers of peripheral DC15,16. However, addition of Flt3L to cultured DC precursors has only modest effects on their proliferative expansion and the effects of Flt3L on DC precursors and peripheral DC were not examined in vivo5,7,8. Here we report on the role of Flt3 on DC development in the bone marrow and in peripheral lymphoid organs and show that it is an important regulator of homeostatic DC division in the periphery in vivo.
Results
BM-resident DC progenitors
Bone marrow derived DC (BMDC) precursors, or MDP do not express lineage markers (Lin− = CD3−CD19−NK1.1−I-Ab−CD11c−B220−Ter119−CD11b−Gr-1−) and were originally identified by expression of Kit (CD117), CX3CR1 promoter driven transgenic GFP, making analysis in mutant mouse strains cumbersome5. MDPs can also give rise to monocytes and some tissue macrophages5,6. Recently defined common dendritic cell precursors (CDP) (Lin−KitintFlt3+CSF1R+) give rise to pDC and cDC in vivo7,8. To further define DC progenitors we purified Lin− cells expressing CSF1R and analyzed their developmental potential in vitro and in vivo (Fig. 1).
Figure 1.

Identification of cDC progenitors. (a) Flow cytometry of Lineage-negative (Lin− = CD3−CD19−B220−NK1.1−CD11c−CD11b−Ter119−Gr-1−) BM (top) and spleen (bottom) cells analyzed for the expression of Kit and Sca-1 (left column). Sca-1− (middle column) but not Sca-1+ (right column) cells in the BM express CSF1R. This analysis was performed twice on spleen cells and over 50 times on BM cells. (b) Colony assays in semisolid medium. Total BM (squares), Lin−CSF1R+ (triangles), or Lin−CSF1R− (circles) cells were cultured in the presence of erythropoietin and IL-3 (burst forming unit-erythroid cell, BFU-E), or erythropoietin alone (colony forming unit-erythroid cell, CFU-E). Colony growth in GM-CSF, CSF1, and Flt3L was analyzed after 7 days. Colony assays were performed 4 times in duplicates. (c) Flow cytometry of spleen cells 14 days after adoptive transfer of purified Lin−CSF1R+Kit− (middle), or Lin−CSF1R+Kit+ (bottom) cells. Spleen cells were gated on live (DAPI−) CD3−CD19−NK1.1−Ter119−, donor cells (CD45.2+), and analyzed for expression of Gr-1 (polymorphonuclear neutrophils, PMN), F4/80 (red-pulp macrophages, RP-Mp), PDCA1 (pDC), CD11b, CD11c, and CD8 (monocytes and cDC). CD8+ cDC are depicted in dark green dots. Data are representative for 10 transfers. (d) Flow cytometry showing Lin− BM cells analyzed for the expression of CX3CR1, Kit and CSF1R (top), or CSF1R, Kit and Flt3 (bottom) showing phenotype correlation between Lin−Kit+CX3CR1+ (MDP* 5), Lin−CSF1R+ cells (MDPΔ, this paper), and CDP7. The original MDPs were defined as Lin−Kit+CX3CR1+ cells5 (MDP* top left). Analysis was repeated twice. (e) Flow cytometry of Lin−CX3CR1+Kit+ (MDP5) (top), Lin−CX3CR1+Kit− (middle), and Lin−CSFR1+Kit− (bottom) cells analyzed 14 days after transfer33. Dot plots were gated on donor–derived cells (CD45.2+). Transfers were performed twice.
We found that ∼8 % of all Lin−Sca-1− cells express CSF1R in the bone marrow (absolute number: 7.2 × 10⁴ ± 0.3 per 2 femura, n = 7) (Fig. 1a). This fraction is rapidly proliferating (35 ± 4 % of the cells are in S or G2 phase of cell cycle [n = 4]) (Supplementary Fig. 1 online) and does not include early self-renewing hematopoietic precursors (Sca-1+ cells) (Fig. 1a). Lin−CSF1R+ cells respond to GM-CSF in vitro by giving rise to DCs, which are Gr-1−MHCII+CD11c± (Supplementary Fig. 2 online) but fail to respond to CSF1, or erythropoietin with or without IL-3 (Fig. 1b). Although the majority of the cells in GM-CSF treated cultures were DCs there was little expansion (3-fold) indicating that this progenitor population undergoes only a limited number of cell divisions prior to differentiation in response to GM-CSF (Lin−Kit+CSF1R− cells expanded 18-fold). Consistent with the work of others, in vitro colony formation in response to Flt3L was undetectable (7 and Fig. 1b). We conclude that Lin−CSF1R+ cells are devoid of early and late erythroid progenitor cells and that they produce DCs in response to GM-CSF in vitro. In contrast, Lin−CSF1R− cells respond to GM-CSF in vitro by giving rise to cells with diverse phenotypes (Fig. 1b, Supplementary Fig. 2 online).
In adoptive transfer experiments purified Lin−CSF1R+ cells (Supplementary Fig. 3 online) gave rise exclusively to spleen CD8+ CD8− cDC and SIGNR1+ marginal zone macrophages but not pDC, PMN, red pulp macrophages (F4/80+) or metallophilic macrophages (Ser-4+) irrespective of Kit expression (Fig. 1c and Supplementary Fig. 4 online). In contrast Lin−Kit+CSF1R− cells gave rise to all other myeloid cell types (not shown). No donor-derived cells were detected in the BM of recipients suggesting that Lin−CSF1R+ cells cannot migrate back to their site of origin (not shown).
MDP were originally defined as Lin− cells expressing a CX3CR1 promoter driven GFP transgene, Kit5, and CSF1R6 (Fig. 1d). Lin−CX3CR1+ cells contain Kit+ and Kit− cells and both populations have identical DC potential in adoptive transfer experiments in vivo (Fig. 1e), thus Lin−CX3CR1+Kit+ and Lin−CX3CR1+Kit− cells are MDPs (Fig. 1d). Lin−CX3CR1+ cells are heterogenous in expression of CSF1R (44%, 21% Kit+ and 23% Kit−) (Fig. 1d) but all Lin−CSF1R+ cells are CX3CR1+ (data not shown). 75% of Lin−CSF1R+ cells (36% Kit+ and 39% Kit−) express Flt3 (Fig. 1d), and when separated on the basis of Flt3 expression cDC progenitor potential is concentrated in Flt3+ cells in vivo (data not shown). Lin−CSF1R+Flt3− cells fail to give rise to any other cell type (data not shown). CDP7 (Lin−KitintFlt3+CSF1R+) represents <39 % of Lin−CSF1R+ cells and is therefore included in MDP (Fig. 1d). We conclude that BM derived Lin−CSF1R+ cells give rise to cDCs in vivo and that when analyzing Flt3 mutant mice (see below) the Lin−CSF1R+ phenotype is sufficient to define MDPs.
Granulocyte monocyte progenitors (GMP), common myeloid progenitors (CMP) and common lymphoid progenitors (CLP) all harbor cDC progenitor activity21,22. To determine how MDPs relate to these other progenitor fractions we analyzed Lin−Kit+CX3CR1+ 5 and Lin−CSF1R+ MDPs for expression of CD34 and FcγRII/III (CD16/32) (Supplementary Fig. 5 online). We found that both MDPs overlap with GMP and CMP, and due to the restricted in vivo developmental potential of MDP we conclude that GMP and CMP are mixed progenitor populations that contain MDPs23.
Flt3L effects on MDPs
To determine how Flt3L impacts DC development we examined the effects of its administration on bone marrow and peripheral DCs. Following administration of Flt3L, expression of its receptor, Flt3, was down-regulated on MDPs and on spleen cDC indicating a rapid response to Flt3L in all DC compartments (Fig. 2a, and data not shown). MDPs (Lin−CSF1R+ (Fig. 2b) or Lin−Kit+CX3CR1+ cells in CX3CR1-GFP transgenic mice (Supplementary Fig. 6 online) were increased by a factor of ∼10, whereas GMP and CMP only increased by a factor of ∼5, and MEP, a megakaryocytic and erythroid prone progenitor cell was unaffected (12 and Supplementary Fig. 6 and Supplementary Fig. 7 online). However, Flt3L treatment did not alter the developmental potential of MDPs on a per cell basis as measured by adoptive transfer experiments where MDPs from Flt3L treated and untreated mice had the same ability to give rise to cDCs (Fig. 2c). We conclude that Flt3L increases the numbers of MDPs but does not alter their ability to give rise to DCs.
Figure 2.

Effects of Flt3 ligand (Flt3L) stimulation. (a) Flow cytometry of spleen cells (top) gated on CD3−CD19−NK1.1−Ter119− and BM cells (bottom) gated on Lin− (CD3−CD19−B220−NK1.1−CD11b−CD11c−Gr1−Ter119−) Sca-1− cells from mice injected with Flt3L or PBS daily for 8 days. Colors represent distinct myeloid cell types as described above dot plots including percentages of indicated populations (top). Analysis was performed 4 times. (b) Absolute number of spleen cells, cDC, pDC, monocytes, PMN and red pulp macrophages (top), and MDPs in BM (bottom) in response to sustained Flt3L stimulation over a time course of 8 days. Data are representative for 2 independent experiments. (c) Developmental potential of Lin−CSF1R+ cells with and without stimulation of Flt3L. Mice were stimulated with Flt3L over a time course of 6 days before purification of Lin−CSF1R+ cells. cDC yield was calculated based on 105 injected cells. Data are representative for 4 independent experiments. (d) Injection of Flt3L results in mobilization of myeloid progenitors from the BM into the spleen. Mice were stimulated with Flt3L over a time course of 6 days. Spleen cells from Flt3L treated (CD45.2+) and congenic untreated mice (CD45.1+) were mixed, depleted for cDC, and injected into irradiated recipients (CD45.1+CD45.2+). Contribution of either donor to CD3−CD19−B220−NK1.1−Ter119−CD11b−CD11c−Gr1− immature spleen cells is depicted for ‘Input’. Contribution of spleen cells from Flt3L treated (open bars) and untreated (closed bars) to spleen cDC, PMN, and monocytes was analyzed after 6 days. Data are representative for 2 independent experiments.
In the spleen, absolute numbers of cDC, pDC, PMN, monocytes, and red pulp macrophages were increased in response to Flt3L (Fig. 2a,b). To determine whether Flt3L injection also alters the numbers of DC precursors in spleen we performed adoptive transfer experiments with mixtures of Flt3L treated and untreated DC–depleted splenocytes (Fig. 2d). Donor populations were depleted of DC, thus, de novo generated cDC developed from intrasplenic precursors. The relative increase in DC from the Flt3L treated spleens suggests that DC progenitors are mobilized to the spleen after Flt3L treatment (Fig. 2d).
Reduced numbers of cDC and pDC in Flt3−/− mice
To further investigate the role of Flt3 in DC development we examined Flt3 deficient mice (Flt3−/− mice17). Absence of Flt3 led to reduced numbers of pDC (Fig. 3a,b) and cDC (Fig. 3c), more pronounced in younger mice24,25, but MDP (Fig. 3j) and spleen pre-cDC19 (Fig. 3h and Supplementary Fig. 7 online) numbers remained unaltered. The reduction in cDC and pDC was not due to a general defect in myeloid cells since monocytes, PMN, Ser-4+ metallophilic and SIGNR-1+ marginal zone macrophages were not significantly altered (Fig. 3d-f, Supplementary Fig. 8 online). Surprisingly no further reductions in pDC or cDC were observed in double mutant mice lacking Flt3 and granulocyte-macrophage colony-stimulating factor receptor (GM-CSFR) (Supplementary Fig. 9 online). Thus, GM-CSFR is not required for DC development in vivo even in the absence of Flt3. We conclude that there is a specific DC defect in the spleen of Flt3−/− mice.
Figure 3.

Myeloid compartments in Flt3−/− mice. (a) Representative flow data showing reduced numbers of cDC, pDC in Flt3−/− mice. Spleen cells from 4 week old mice were gated on CD3−CD19−NK1.1−Ter119− cells (top), and the relative contribution of myeloid cells was determined in wild-type (left) and Flt3−/− (right) mice. Spleen cells were counted (f) and absolute cell numbers calculated for pDC (CD3−CD19−NK1.1−Ter119−Gr-1−PDCA1+, b), cDC (CD3−CD19−NK1.1−Ter119−Gr-1−PDCA1−F4/80−CD11c+, c), Monocytes (CD3−CD19−NK1.1−Ter119−PDCA1−F4/80−CD11c−Gr-1−/loCD11b+, d), and PMN (CD3−CD19−NK1.1−Ter119−Gr-1+, e). To determine frequencies of intrasplenic cDC progenitors19 medium density cells were counted (g), and numbers of pre-cDC calculated (CD3−CD19−NK1.1−Ter119−CD45RA−/loCD11c+CD43+SIRP-αlo, h). Absolute cell numbers of BM cells were counted (i) and MDP (Lin−CSF1R+) numbers calculated (j). Each point represents one mouse assayed at 2, 4 or 9 weeks of age as indicated.
Flt3 in DC homeostasis
To determine whether the DC defect in Flt3−/− mice is cell intrinsic we compared BM chimeras in which Flt3−/− or wild-type cells were engrafted in wild-type mice and analyzed 4 months later (Fig. 4a). Recipients showed comparable levels of Flt3−/− and wild-type hematopoetic stem cell (HSC) engraftment as determined by flow cytometry (Lin−Kit+Sca-1+ [KSL] cells, data not shown) and similar numbers of PMN, red pulp–macrophages (RP-Mp), and monocytes (Mono) but there were decreased numbers of Flt3−/− pDCs and cDCs (Fig. 4a). We conclude that the DC deficiency in Flt3−/− mice is cell intrinsic.
Figure 4.
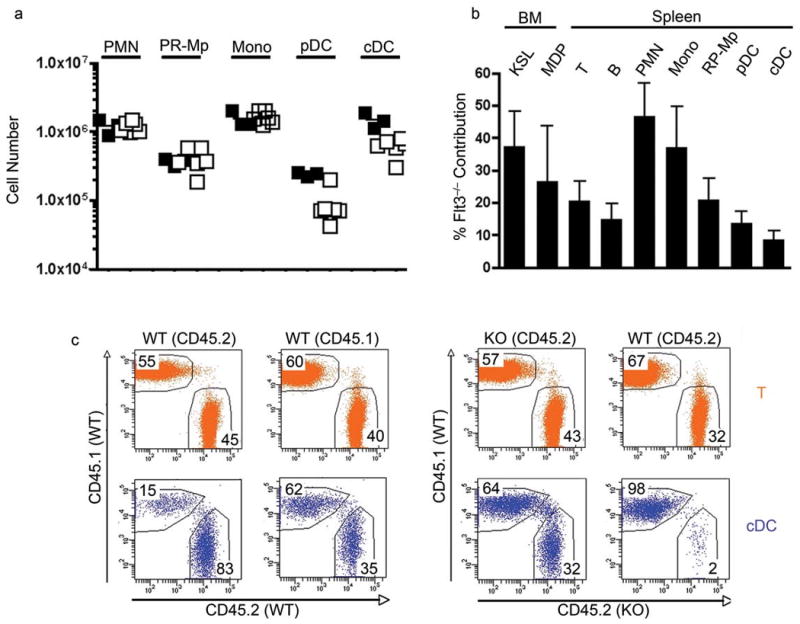
DC development in Flt3−/− bone marrow chimeras. (a) Absolute numbers of wild-type (closed squares) and Flt3−/− (open squares) spleen PMN, RP–macrophages, monocytes, pDC, and cDC in bone marrow chimeras 4 months after injection of Lin−Kit+ cells into lethally irradiated recipients. Each square represents an individual mouse. (b) Mixed bone marrow chimeras. Relative contribution of Flt3−/− (CD45.2+) cells to BM HSC (KSL, Kit+Sca–1+Lin−), MDP (Lin−CSF1R+), and spleen T cells (CD3+), B cells (CD19+), PMN, monocytes, RP–macrophages, pDC and cDC was determined 1.5 months after transfer. Data was pooled from 3 recipient mice and is representative for 2 independent experiments. (c) Parabiosis between wild-type controls and wild-type or Flt3−/− mice for 5 weeks. Dot plots were gated on spleen T cells (CD3+) (orange, upper panels) and cDCs (CD3−CD19−Ter119−NK1.1−Gr1−PDCA1−F4/80−CD11chi) (blue, lower panels), and analyzed for contribution of either parabiotic partner. Origin of cells was determined using distinct CD45 isoforms (wild-type : wild-type CD45.1+ : CD45.2+; wild-type : Flt3−/− CD45.1+ : CD45.2+).
To directly compare the developmental potential of mutant and wild-type progenitors we constructed mixed BM chimeras and analyzed them after 1.5 months (Fig. 4b and Supplementary Fig. 10 online). In the bone marrow, HSCs and MDPs were reconstituted to comparable levels and in the periphery, PMN and monocyte reconstitution was 47% and 37%, respectively (Fig. 4b). In contrast, Flt3−/− contribution to both subsets of DCs, RP-Mp and as reported previously, T and B lymphocytes was very low, indicating specific defects in the generation of these lineages in the absence of Flt3 (17 and Fig. 4b). The defects in DCs were more pronounced than MDPs suggesting the existence of a Flt3 dependent checkpoint for DC development beyond the MDP stage (Fig. 4b).
To further investigate the possible role of Flt3 in peripheral DC homeostasis we parabiosed Flt3−/− with wild-type mice and compared them to parabiosed congenic wild-type mice (Fig. 4c and Supplementary Fig. 11 online). In contrast to controls, only 2 % of the cDC in the spleen of the wild-type parabiotic partner were of Flt3−/− origin and a disproportionate number of wild-type cDCs were found in the Flt3−/− spleen when compared to wild-type vs. wild-type controls (WT into WT: 15 %; WT into Flt3−/− : 64 %) (Fig. 4c and Supplementary Fig. 11 online). To determine whether the imbalance in Flt3−/− vs. wild-type parabionts was due to reduced DC progenitor potential or to decreased numbers of progenitors we transplanted a mixture of purified MDPs from wild-type and Flt3−/− mice into irradiated recipients. 11 days after transfer the majority of cDC were of wild-type origin suggesting that Flt3−/− MDPs had a decreased potential to develop into cDCs (Fig. 5a). To determine whether this difference in DC differentiation potential between wild-type and Flt3−/− MDPs was Flt3L dependent we transferred the mixture of the two types of MDPs into Flt3L−/− mice. In contrast to the wild-type recipient, the ratio of wild-type and Flt3−/− cDCs in spleen of Flt3L−/− recipients reflected the input ratio of MDPs (Fig. 5a). The same result was obtained by transplantation of peripheral blood (PB) cells containing circulating cDC precursors (Fig. 5a). Thus, in the absence of Flt3L, wild-type and Flt3 mutant MDPs and PB-resident cDC precursors have the same potential to develop into cDCs. We conclude that Flt3 is an important mediator of DC development after the MDP and circulating cDC precursor stage.
Figure 5.

Flt3 in peripheral expansion. (a) Adoptive transfer of mixed BM Lin−CSF1R+ (MDP, left) or white blood cells (WBC, right) from wild-type and Flt3−/− mice into mildly irradiated wild-type (top) or Flt3L−/− (bottom) recipient mice. Plots show percentage contribution of wild-type (open bars) and Flt3−/− (closed bars) to the input and to reconstituted cDCs after 11 days. Data from 3 independent experiments are pooled. Contribution of Flt3−/− cells after transfer into wild-type mice is significantly reduced (MDP in wild-type: P = 0.001, WBC in wild-type: P = 0.04, MDP in Flt3L−/−: P = 0.2, WBC in Flt3L−/− P = 0.2; analyzed by paired t-test). (b,c) Reduced BrdU incorporation into Flt3−/− cDC compared to wild-type cells in the same microenvironment. (b) Wild-type versus Flt3−/− mixed BM chimeras were generated and BrdU incorporation into cDC (CD3−CD19−Ter119−NK1.1−F4/80−PDCA1−CD11c+) measured. Dot plots show representative FACS analysis of BrdU incorporation into cDC after a pulse of 2 hours. WT : WT chimeras (top) were analyzed in parallel with Flt3−/− : WT chimeras (bottom). Percentages indicate frequencies of BrdU incorporation into either CD45.2+ or CD45.2− (WT : WT or WT : Flt3−/−) cells in mixed BM chimeras. (c) Plots represent pooled data of BrdU incorporation into MDP (top) and cDC (bottom) after a pulse of 2 hours (left) or into pDC (top) and cDC (bottom) after a pulse of 4 days (right). BrdU incorporation into Flt3−/− cDC was significantly reduced after a pulse of 2 hours (P = 0.018) or 4 days (P = 0.011). BrdU incorporation was not significantly different in Flt3−/− MDP after a pulse of 2 hours (P = 0.26) or in Flt3−/− pDC after a pulse of 4 days (P = 0.56). P values were determined by paired t-test comparing the increments in BrdU incorporation in either WT : WT or Flt3−/− : WT cells in the same mouse. (d) Carboxyfluorescein diacetate succinimidyl diester (CFSE) dilution 5 days after transfer of mixed Lin−CSF1R+ wild-type (CD45.1+) and Flt3−/− (CD45.2+) cells into irradiated recipient mice. Cells were gated on CD3−CD19−NK1.1−Ter119−Gr1−PDCA1−CD11chiMHCII+ cells (left dot plot), and contribution of both donor cell types determined after exclusion of recipient cDC (right dot plot). Histograms depict retention of CFSE in wild-type (green color, upper histogram) or Flt3−/− (orange color, lower histogram) cells. Data is representative for three independent experiments. (e) CFSE dilution 6 days after transfer of wild-type spleen and LN cells (7 × 10⁶) into wild-type (left) or Flt3L−/− (right) mice. Histograms were gated on donor CD11chi cells and depict level of CFSE labeling. Shown are 2 out of 6 different recipient mice for each group.
To analyze proliferation of Flt3-deficient and -proficient cells in the same microenvironment we generated BM chimeras and measured BrdU incorporation into MDP and cDC after a pulse of 2 hours (Fig. 5b,c). There was no difference in BrdU uptake in MDP, confirming Flt3-independent generation. In contrast, Flt3−/− cDC incorporated less BrdU than Flt3+ cDC, suggesting that in situ cDC proliferation depends on Flt3 (Fig. 5b,c). After a BrdU pulse of 4 days Flt3−/− cDC incorporated ∼10 % less BrdU than wild-type cells, but pDC show no difference in BrdU incorporation compared to wild-type pDC, suggesting that a distinct mechanism underlies paucity of pDC in Flt3−/− mice (Fig. 5c).
To determine whether a defect in cell division in the periphery contributes to the DC defect in the absence of Flt3 we transferred mixtures of CFSE labeled Flt3−/− and wild-type MDPs into irradiated recipients and measured cell division by CFSE dilution. We found that Flt3−/− cells divided less than wild-type cells in the spleen suggesting that Flt3 regulates DC cell division in the periphery (Fig. 5d). To examine the effects of Flt3 on peripheral DC division directly we injected CFSE labeled spleen and LN cells into un-irradiated wild-type and Flt3L−/− mice and measured cDC proliferation by dye dilution. DC proliferation was readily detected in wild-type mice but difficult to document in Flt3L−/− recipients (Fig. 5e). We conclude that Flt3 regulates DC division in the periphery in the steady state.
Discussion
We have shown that mice deficient in Flt3 show abnormalities in lymphoid tissue resident cDC and pDC. The effects of Flt3 deficiency are most evident in the periphery where this receptor is essential for homeostatic expansion of DC progenitors in lymphoid organs.
In contrast to migratory DCs such as Langerhans cells which are derived from Gr–1+ monocytes26, lymphoid tissue resident cDC are derived from hematopoietic precursors, which have been called MDP or CDP5,7,8. MDP were initially defined by expression of a CX3CR1 driven GFP transgene, and could only be studied in mice bearing this marker5. We have established that MDPs can also be identified by expression of CSF1R and absence of lineage markers including CD11c and CD11b (Lin−CSF1R+). MDP are rapidly dividing cells exclusively found in the BM multipotent progenitor compartment (Sca-1−) and make up to 0.2 % of the nucleated cells in the marrow. They are restricted to the BM suggesting that they are a non–circulating population, a finding, which is also supported by lack of transfer in parabiosed mice. The original Lin−Kit+CX3CR1 expressing MDP include the Lin−CSF1R+ MDP and have equivalent developmental potential in vivo. However, Lin−CSF1R+ MDP include Kit+ and Kit− cells, which have identical differentiation potential. Despite homogenous expression of CSF1R, MDP like CDP fail to proliferate in response to CSF1 in vitro which may be secondary to their isolation using anti-CSF1R antibodies7. In vivo, MDP are developmentally restricted in that they do not give rise to granulocytes, erythroid cells, pDC, red pulp (F4/80+), or metallophilic macrophages (Ser 4+), but they do have the potential to produce cDCs and SIGNR1+ marginal zone macrophages when injected intravenously. CDPs are Lin−CSF1R+ cells which are further defined by being KitintFlt3+. These cells constitute a fraction of the MDPs. In contrast to MDP (5 and this study), CDP give rise to cDC and pDC in vivo7. However, CDP-derived pDC constituted small numbers of graft-derived cells, which were increased by Flt3L treatment of the recipients7. We failed to detect MDP-derived pDC over 0.6% (±0.9 [n = 20]) after injection into irradiated recipients but this may have been due to the fractional contribution of CDP to the overall number of MDP. Moreover, in our experiments, presence of small numbers of PDCA1+ cells was always accompanied by presence of small numbers of PMN (1.3 % ± 3.5 [n = 20]), a cell type not analyzed in previous studies, suggesting alternative possibility that CDP were contaminated with small numbers of multipotent progenitors. Thus, we conclude that the developmental potential of MDP is restricted to cDC and marginal zone macrophages. We find that like CDPs, MDPs express Flt3, and that Kit appears to be dispensable for MDP isolation. In conclusion, CDPs overlap with Lin−CSF1R+ MDPs as do GMP, and CMP, which may account for the observation that DC progenitors are found in both of these hematopoietic precursor populations21,23,27.
Like many other hematopoietic progenitors in the bone marrow including ST-HSCs, CLPs, CMPs, and GMPs, MDPs express Flt312,28,29. All of these cells expand in response to exogenous Flt3L, but we find that the effects of Flt3L on MDPs is more pronounced than on any other defined progenitor12,30. Nevertheless, deletion of Flt3L has only modest effects on bone marrow cellularity and does not alter the relative frequency of myeloid progenitors29,31. The only prominent hematopoetic developmental defect in Flt3L−/− mice is in pro- and pre-B cell development29. Flt3 deletion shows even milder effects with no significant alteration in bone marrow cellularity, but Flt3−/− progenitors have a reduced ability to competitively reconstitute the T and myeloid cell lineages in mixed bone marrow adoptive transfer experiments 17. Consistent with these findings Flt3L alone is not sufficient to support robust growth of MDP in vitro 5,7 and the numbers of MDPs were unaffected by absence of Flt3. Thus, the MDP compartment is increased in response to superphysiologic levels of Flt3L, but its maintenance is independent of Flt3 in vivo.
Small number of DC progenitors rapidly transit from bone marrow to spleen and lymph nodes via the blood as relatively immature progenitors that do not express surface MHCII or CD11c32. These cells undergo several rounds of cell division while differentiating into cDCs that continue to express Flt39,10,12,15. Inhibition of Flt3-mediated signals results in reduction of DC numbers in vivo, possibly due to increased apoptosis16.
DC division in lymphoid organs is limited, and the peripheral cDC compartment must be continually replenished from blood borne precursors9. Peripheral lymphoid organ DC homeostasis is therefore dependent on the rate of DC progenitor input from blood, cell division and cell death9. Our experiments show that Flt3L can regulate two aspects of peripheral DC homeostasis, progenitor migration and cDC division. The enhanced migration of DC progenitors to spleen in response to Flt3L is consistent with enhanced migration of monocyte and PMN progenitors and the expansion of these cells in the bone marrow12,14. Little is known about the regulation of cDC division in peripheral lymphoid organs. Among the known DC growth factors only lymphotoxin–β has been implicated in helping maintain the homeostasis of the CD8− subset of cDC in spleen by regulating cell division in the periphery10. Our adoptive transfer experiments show that in the absence of Flt3 cDCs are impaired in their ability to undergo homeostatic division and therefore Flt3 is a pivotal growth factor in maintenance of cDC homeostasis in the periphery in steady-state.
In summary, committed DC progenitors in the bone marrow do not require Flt3-mediated signals for their generation, but they expand and emigrate from the bone marrow in response to superphysiologic doses of Flt3L in vivo. In contrast, Flt3 is required for DC homeostasis and the effect is on a novel peripheral checkpoint that regulates cDC division.
Methods
Mice, parabiosis, Flt3L injection
Flt3−/− mice were generated and kindly provided by Ihor Lemischka17, Csf2ra−/− mice were generated and kindly provided by Lorraine Robb and Glenn Begley18. C57BL/6 (B6), B6C57BL/6 Pep3b CD45.1+ (SJL), and CD45.1+CD45.2+ F1 mice were obtained from Jackson Lab or bred at Rockefeller University. Parabiotic mice were produced as described9. Briefly, mice were anesthesized (2.5 % Avertin, Fluka) and shaved. Skin incisions were made in the adjacent sides of two mice from hip to elbow and the ligaments sutured together with chromic gut (Ethicon). Subsequently, the skin of the mice was clipped with with 9 mm stainless steel wound clips to close the skin incisions. Mice were kept on antibiotic and ibuprofen (0.16 mg/l) throughout the following 3 weeks. Flt3L injections: 10 μg rhFlt3L (Amgen) was daily injected subcutaneously in 100 μl PBS. All mice were maintained under specific pathogen free conditions and mouse protocols were approved by the Rockefeller University Animal Care and Use Committee.
Cell preparations, flow cytometry, immunohistology
Spleen and thymus were gently dispersed between frosted slides, and digested for 30 min at 37 °C in PBS with 5 % FCS containing collagenase D (typeII, Roche) at a final concentration of 0.4 U/ml. Cell numbers were determined on a cell analyzer (Calibur, BD), using counting beads (Caltag) and determination of absolute leukocyte numbers was performed according to the manufacturers instructions using Ter119 antibody. Medium density spleen cells (MDP, 1.076-1.084 g/cm3, Optiprep, Sigma) were prepared as described19. Cell preparation for flow cytometry: Before staining with specific antibodies, unspecific binding sites were blocked using total rat Ig (Jackson Lab) and purified FcγRII/III antibody (93, eBioscience). All stainings were performed at 4 °C in PBS with 5% FCS. Immunohistology: Cryosections were fixed in 100% ethanol at -20 °C, unspecific binding sites were blocked with purified FcγRII/III antibody and streptavidine / biotin blocking kit (Vector Laboratories), and stained in PBS with 5% FCS. Following reagents were used for stainings (flow cytometry and immunohistology): CD3 (2C11), CD11c (HL3), CD45RA (14.8), CD43 (S7), SIRPα (P84) (all Pharmingen), CD8 (53–6.7), CD19 (1D3), CD45R (RA3-6B2), CD11b (M1/70), Gr-1 (RB6-8C5), Ter119 (Ter119), Kit (2B8), Sca-1 (D7), CSF1R (AFS98), FcγRII/III (93), CD34 (RAM34), Flt3 (A2F10), I-Ab (MS/114.15.2), F4/80 (BM8), CD45.1 (A20), CD45.2 (104) (all eBioscience), PDCA1 (JFOS-1C2.4.1) (Myltenyi), and CD169 (Ser-4), SIGNR1 (22D1) were self generated and kindly provided by Chae Gyu Park (Rockefeller University). Secondary steps: Streptavidin-Allophycocyanine from Pharmingen, Streptavidine-Pacific Orange, 4′,6-Diamidino-2-Phenylindole (DAPI), anti-fluoresceine-Alexa488 from Molecular Probes, Streptavidin-Phycoerythrine carbocyanine 5.5 from Caltag, anti-hamster Carbocyanine 3 from Jackson Lab.
Methyl cellulose colony assay, liquid cultures
105 total BM cells or 103 isolated progenitors were plated in methyl cellulose containing medium (StemCell Technologies M3334) supplemented with erythropoietin (10 ng/ml), or erythropoietin and IL-3 (50 ng/ml). Erythroid colonies were counted after 48 hours (erythropoietin) or 7 days (erythropoietin and IL-3) as previously described20. Briefly, cultures were overlayed with an equal volume of 0.4 % benzidine in 12 % acetic acid, and scored according to blue staining of colonies. BFU-E colonies contained at least one benzidine+ erythroid cell, and CFU-E colonies were uniformly benzidine+. 2 × 10⁵ sorted total BM cells or 103 isolated progenitors were plated in methyl cellulose containing medium (StemCell Technologies M3231) supplemented with GM-CSF (10 ng/ml), CSF1 (10 ng/ml), or Flt3L (100 ng/ml). Colony formation was assessed after 7 days. For liquid cultures, 2 × 10⁵ total BM cells or 5 × 10⁴ sorted cells were cultured in 1 ml medium supplemented with GM-CSF (10 ng/ml). At day 3 medium was exchanged, and at day 6 cultures were analyzed.
BrdU labeling and detection, CFSE labeling, cell cycle analysis
Mice were injected with BrdU (1mg, i.p.). 2 hours or 4 days later mice were sacrificed and BrdU incorporation was analyzed according to manufacturers instructions (BD). Briefly, cell surface antigens were stained with indicated antibodies, fixed, and permeabilized. BrdU epitopes were exposed by DNAse I digestion for 1 hour at 37 °C and detected using anti-BrdU monoclonal antibody (3D4, BD). For CFSE labeling cells were stained in 5 μM Carboxy Fluoroscein Succinimidyl Ester (CFSE, Molecular Probes) in PBS with 0.1 % FCS at a concentration of 107 cells/ml for 10 minutes at 37 °C. The reaction was quenched by adding an equal volume of 100 % FCS followed by washing 3 times in PBS with 5 % FCS to ensure removal of CFSE. For cell cycle analysis cells were sorted and incubated in 80 % PBS 20 % water 0.1 % TritonX-100 (Sigma) 50 mg/ml propidium iodide (Sigma) and 10 μg/ml RNAse A (Roche) over night at room temperature in the dark. Analysis was performed on a FACS Calibur using doublet discrimination mode.
Cell transfer experiments
Recipient mice were conditioned as indicated (lethal irradiation: 550cGy + 500cGy 3 hours between irradiations, sublethal irradiation: 600cGy) and cell suspensions were injected intravenously approximately 3h after irradiation. Mice were fed antibiotic–supplemented food (TestDiet, Richmond, IN) and given water ad libidum. Following numbers of cell sorter purified progenitors were injected and yielded the given numbers of cDC: Fig. 1c Lin−CSF1R+Kit− input: 3.9 × 10⁵ yield: 750 cDC, Lin−CSF1R+Kit+ input: 2.7 × 10⁵ yield: 2200 cDC (14 days); Fig. 1e CX3CR1-GFP+Kit+ input: 2.1 × 10⁵ yield: 7300 cDC CX3CR1-GFP+Kit− input: 7.2 × 10⁵ yield: 2500 cDC (14 days); CSF1R+Kit− input: 4.3 × 10⁵ yield: 2100 cDC; Fig. 2c MDP w/o Flt3L treatment input: 105 yield: 8910, 5730 cDC, Flt3L treatment input: 3 × 10⁵ yield: 18800, 22600 cDC (9 days). Single and mixed bone marrow chimeras were produced by injecting Lin−Kit+ cells from Flt3−/− or WT or Flt3−/− : WT (CD45.2 : CD45.1) mice into lethally irradiated wild-type recipients (SJL, CD45.1 or SJL×B6 F1, CD45.1+CD45.2+).
Supplementary Material
Acknowledgments
We thank Amgen for the generous gift of rhFlt3L. We are very thankful to Ihor Lemischka for providing Flt3−/− mice, and to Lorraine Robb and Glenn Begley for providing GM-CSFR-deficient (Csf2ra−/−) mice. We thank Chae Gyu Park for providing CD169 and SIGNR1 monoclonal antibodies. We wish to thank R. Steinman and A. Kamphorst for critical reading of the manuscript, and Mayte Suarez–Farinas for help with statistical analysis.
References
- 1.Steinman RM, Hawiger D, Nussenzweig MC. Tolerogenic dendritic cells. Annu Rev Immunol. 2003;21:685–711. doi: 10.1146/annurev.immunol.21.120601.141040. [DOI] [PubMed] [Google Scholar]
- 2.Steinman RM, Banchereau J. Taking dendritic cells into medicine. Nature. 2007;449:419–426. doi: 10.1038/nature06175. [DOI] [PubMed] [Google Scholar]
- 3.Liu YJ. IPC: professional type 1 interferon–producing cells and plasmacytoid dendritic cell precursors. Annu Rev Immunol. 2005;23:275–306. doi: 10.1146/annurev.immunol.23.021704.115633. [DOI] [PubMed] [Google Scholar]
- 4.Villadangos JA, Schnorrer P. Intrinsic and cooperative antigen–presenting functions of dendritic–cell subsets in vivo. Nat Rev Immunol. 2007;7:543–555. doi: 10.1038/nri2103. [DOI] [PubMed] [Google Scholar]
- 5.Fogg DK, et al. A clonogenic bone marrow progenitor specific for macrophages and dendritic cells. Science. 2006;311:83–87. doi: 10.1126/science.1117729. [DOI] [PubMed] [Google Scholar]
- 6.Varol C, et al. Monocytes give rise to mucosal, but not splenic, conventional dendritic cells. J Exp Med. 2007;204:171–180. doi: 10.1084/jem.20061011. [DOI] [PMC free article] [PubMed] [Google Scholar]
- 7.Onai N, et al. Identification of clonogenic common Flt3+M−CSFR+ plasmacytoid and conventional dendritic cell progenitors in mouse bone marrow. Nat Immunol. 2007;8:1207–1216. doi: 10.1038/ni1518. [DOI] [PubMed] [Google Scholar]
- 8.Naik SH, et al. Development of plasmacytoid and conventional dendritic cell subtypes from single precursor cells derived in vitro and in vivo. Nat Immunol. 2007;8:1217–1226. doi: 10.1038/ni1522. [DOI] [PubMed] [Google Scholar]
- 9.Liu K, et al. Origin of dendritic cells in peripheral lymphoid organs of mice. Nat Immunol. 2007;8:578–583. doi: 10.1038/ni1462. [DOI] [PubMed] [Google Scholar]
- 10.Kabashima K, et al. Intrinsic lymphotoxin–beta receptor requirement for homeostasis of lymphoid tissue dendritic cells. Immunity. 2005;22:439–450. doi: 10.1016/j.immuni.2005.02.007. [DOI] [PubMed] [Google Scholar]
- 11.Diao J, Winter E, Chen W, Xu F, Cattral MS. Antigen transmission by replicating antigen–bearing dendritic cells. J Immunol. 2007;179:2713–2721. doi: 10.4049/jimmunol.179.5.2713. [DOI] [PubMed] [Google Scholar]
- 12.Karsunky H, Merad M, Cozzio A, Weissman IL, Manz MG. Flt3 ligand regulates dendritic cell development from Flt3+ lymphoid and myeloid–committed progenitors to Flt3+ dendritic cells in vivo. J Exp Med. 2003;198:305–313. doi: 10.1084/jem.20030323. [DOI] [PMC free article] [PubMed] [Google Scholar]
- 13.Maraskovsky E, et al. Dramatic increase in the numbers of functionally mature dendritic cells in Flt3 ligand–treated mice: multiple dendritic cell subpopulations identified. J Exp Med. 1996;184:1953–1962. doi: 10.1084/jem.184.5.1953. [DOI] [PMC free article] [PubMed] [Google Scholar]
- 14.Brasel K, et al. Hematologic effects of flt3 ligand in vivo in mice. Blood. 1996;88:2004–2012. [PubMed] [Google Scholar]
- 15.Whartenby KA, et al. Inhibition of FLT3 signaling targets DCs to ameliorate autoimmune disease. Proc Natl Acad Sci U S A. 2005;102:16741–16746. doi: 10.1073/pnas.0506088102. [DOI] [PMC free article] [PubMed] [Google Scholar]
- 16.Tussiwand R, Onai N, Mazzucchelli L, Manz MG. Inhibition of natural type I IFN–producing and dendritic cell development by a small molecule receptor tyrosine kinase inhibitor with Flt3 affinity. J Immunol. 2005;175:3674–3680. doi: 10.4049/jimmunol.175.6.3674. [DOI] [PubMed] [Google Scholar]
- 17.Mackarehtschian K, et al. Targeted disruption of the flk2fk2/flt3 gene leads to deficiencies in primitive hematopoietic progenitors. Immunity. 1995;3:147–161. doi: 10.1016/1074-7613(95)90167-1. [DOI] [PubMed] [Google Scholar]
- 18.Robb L, et al. Hematopoietic and lung abnormalities in mice with a null mutation of the common beta subunit of the receptors for granulocyte–macrophage colony–stimulating factor and interleukins 3 and 5. Proc Natl Acad Sci U S A. 1995;92:9565–9569. doi: 10.1073/pnas.92.21.9565. [DOI] [PMC free article] [PubMed] [Google Scholar]
- 19.Naik SH, et al. Intrasplenic steady–state dendritic cell precursors that are distinct from monocytes. Nat Immunol. 2006;7:663–671. doi: 10.1038/ni1340. [DOI] [PubMed] [Google Scholar]
- 20.Waskow C, Terszowski G, Costa C, Gassmann M, Rodewald HR. Rescue of lethal c–KitW/W mice by erythropoietin. Blood. 2004;104:1688–1695. doi: 10.1182/blood-2004-04-1247. [DOI] [PubMed] [Google Scholar]
- 21.Traver D, et al. Development of CD8alpha–positive dendritic cells from a common myeloid progenitor. Science. 2000;290:2152–2154. doi: 10.1126/science.290.5499.2152. [DOI] [PubMed] [Google Scholar]
- 22.D'Amico A, Wu L. The early progenitors of mouse dendritic cells and plasmacytoid predendritic cells are within the bone marrow hemopoietic precursors expressing Flt3. J Exp Med. 2003;198:293–303. doi: 10.1084/jem.20030107. [DOI] [PMC free article] [PubMed] [Google Scholar]
- 23.Wu L, et al. Development of thymic and splenic dendritic cell populations from different hemopoietic precursors. Blood. 2001;98:3376–3382. doi: 10.1182/blood.v98.12.3376. [DOI] [PubMed] [Google Scholar]
- 24.Dakic A, et al. Development of the dendritic cell system during mouse ontogeny. J Immunol. 2004;172:1018–1027. doi: 10.4049/jimmunol.172.2.1018. [DOI] [PubMed] [Google Scholar]
- 25.Sun CM, Fiette L, Tanguy M, Leclerc C, Lo–Man R. Ontogeny and innate properties of neonatal dendritic cells. Blood. 2003;102:585–591. doi: 10.1182/blood-2002-09-2966. [DOI] [PubMed] [Google Scholar]
- 26.Ginhoux F, et al. Langerhans cells arise from monocytes in vivo. Nat Immunol. 2006;7:265–273. doi: 10.1038/ni1307. [DOI] [PMC free article] [PubMed] [Google Scholar]
- 27.Shigematsu H, et al. Plasmacytoid dendritic cells activate lymphoid–specific genetic programs irrespective of their cellular origin. Immunity. 2004;21:43–53. doi: 10.1016/j.immuni.2004.06.011. [DOI] [PubMed] [Google Scholar]
- 28.Christensen JL, Weissman IL. Flk–2 is a marker in hematopoietic stem cell differentiation: a simple method to isolate long–term stem cells. Proc Natl Acad Sci U S A. 2001;98:14541–14546. doi: 10.1073/pnas.261562798. [DOI] [PMC free article] [PubMed] [Google Scholar]
- 29.Sitnicka E, et al. Key role of flt3 ligand in regulation of the common lymphoid progenitor but not in maintenance of the hematopoietic stem cell pool. Immunity. 2002;17:463–472. doi: 10.1016/s1074-7613(02)00419-3. [DOI] [PubMed] [Google Scholar]
- 30.Laouar Y, Welte T, Fu XY, Flavell RA. STAT3 is required for Flt3L–dependent dendritic cell differentiation. Immunity. 2003;19:903–912. doi: 10.1016/s1074-7613(03)00332-7. [DOI] [PubMed] [Google Scholar]
- 31.McKenna HJ, et al. Mice lacking flt3 ligand have deficient hematopoiesis affecting hematopoietic progenitor cells, dendritic cells, and natural killer cells. Blood. 2000;95:3489–3497. [PubMed] [Google Scholar]
- 32.del Hoyo GM, et al. Characterization of a common precursor population for dendritic cells. Nature. 2002;415:1043–1047. doi: 10.1038/4151043a. [DOI] [PubMed] [Google Scholar]
- 33.Herzenberg LA, Tung J, Moore WA, Parks DR. Interpreting flow cytometry data: a guide for the perplexed. Nat Immunol. 2006;7:681–685. doi: 10.1038/ni0706-681. [DOI] [PubMed] [Google Scholar]
Associated Data
This section collects any data citations, data availability statements, or supplementary materials included in this article.