

Abstract
Purpose
A positive outcome in self-reported behavior could be detected erroneously if an intervention caused over-reporting of the targeted behavior. Data collected from a multi-site randomized trial were examined to determine if adolescent girls who received a physical activity intervention over-reported their activity more than girls who received no intervention.
Methods
Activity was measured using accelerometers and self-reports (3-Day Physical Activity Recall, 3DPAR) in cross-sectional samples pre- (6th grade, n=1464) and post-intervention (8th grade, n=3114). Log-transformed accelerometer minutes were regressed on 3DPAR blocks, treatment group, and their interaction, while adjusting for race, BMI, and timing of data collection.
Results
Pre-intervention, the association between measures did not differ between groups, but post-intervention 3DPAR blocks were associated with fewer log-accelerometer minutes of moderate-vigorous physical activity (MVPA) in intervention girls than control girls (p = 0.002). The group difference was primarily in the upper 15% of the 3DPAR distribution, where control girls had >1.7 more accelerometer minutes of MVPA than intervention girls who reported identical activity levels. Group differences in this sub-sample were 8.5–16.2% of the mean activity levels; the intervention was powered to detect a difference of 10%.
Conclusion
Self-report measures should be interpreted with caution when used to evaluate a physical activity intervention.
Keywords: bias (epidemiology), intervention studies, adolescent, exercise, questionnaires, social desirability
INTRODUCTION
Self-report measures of physical activity are a popular means of evaluating physical activity interventions because they are more feasible and less expensive than objective measures of activity (e.g. accelerometers). Among the 76 physical activity intervention studies in a recent review by Salmon et al., 51 relied exclusively on self-report measures (1). Some experts have argued, however, that self-report measures are insufficient for intervention studies because of their potential for misclassification (2, 3). Jacobs et al. reviewed ten of the most commonly used activity self-report questionnaires and found that all were poorly correlated with accelerometer-measured activity (4). Sirard et al. reviewed common self-report measures of activity in children and adolescents and found a wide range of correlations with objective measures of activity (r = −0.10 to 0.88) (5).
Observational studies of self-reported physical activity often acknowledge such misclassification as a limitation, but argue that it is non-differential and assume that effect estimates are conservative. The same logic cannot necessarily be applied to intervention studies because differential misclassification could result from social desirability bias induced by the intervention. Social desirability is “the defensive tendency of individuals to respond in a manner that is consistent with social norms or beliefs” (6). Comparisons of self-reported to objective measures of physical activity have indicated that social desirability is associated with over-reporting among females (7, 8). Interventions, in their effort to encourage individuals to change behavior, may promote social desirability and inadvertently increase over-reporting of that behavior.
Such differential misreporting has been noted in behavioral intervention studies aimed at changing diet behaviors. Espeland et al. (9) reported that participants who were randomized to receive a sodium reduction and weight loss intervention under-reported their sodium intake more than participants randomized to other groups. Harnack et al. (10) similarly found that girls randomized to receive an obesity prevention intervention under-reported their fat and total energy intake compared to control girls.
To our knowledge, no study has examined whether differential over-reporting of physical activity occurs within trials that test interventions to promote physical activity. Identification of such systematic error would contribute to our knowledge of the cognitive and social processes that underlie self-reports of physical activity, and could lead to improvements in the design of instruments (11, 12). Furthermore, if the bias were sufficiently large it could lead to incorrectly concluding that an intervention was efficacious. The purpose of this study was to determine if adolescent girls randomized to receive a physical activity intervention over-reported their activity levels at the conclusion of the intervention compared to girls who received no intervention.
MATERIALS AND METHODS
Subjects
The data were obtained as part of the Trial of Activity for Adolescent Girls (TAAG). TAAG was a multi-center, group-randomized controlled trial, initiated by the National Heart, Lung, and Blood Institute (NHLBI), designed to test an intervention to reduce the decline of physical activity levels in middle school girls (13). TAAG was a collaborative trial among six field centers (the Universities of Arizona, Maryland, Minnesota, and South Carolina, San Diego State University, and Tulane University), the coordinating center at the University of North Carolina, Chapel Hill, and the NHLBI. A Data and Safety Monitoring Board provided oversight and performed an advisory role. Six middle schools were recruited from each field center, for a total of thirty-six schools.
After baseline measurements were collected, three schools at each of the six field centers were randomized to intervention and three to the control condition. The intervention was based on a social-ecological framework (14); intervention activities focused on promoting environmental and policy changes that supported physical activity, training physical education teachers to increase active participation of girls in class, teaching behavioral skills associated with activity in other classes, promoting collaborations with community agencies to increase activity outside of school, and providing cues, messages, and incentives within the school to encourage girls to be active. Further details of the intervention strategies are provided by Elder et al. (14) The intervention component that was directed by TAAG staff began in fall 2003 and lasted through spring 2005, at which time the primary outcome data were collected. The intervention was continued by school and community personnel through spring 2006, but data analyses for this paper only included data through 2005.
Data were obtained from independent cross-sectional samples of girls recruited for measurement at baseline (6th grade, spring 2003) and follow-up (8th grade, spring 2005). Prior to the intervention, a sample of 60 girls per school was randomly selected by the coordinating center and invited to participate in data collection. Of the 2,160 selected, 1,721 consented and participated in data collection (80%), and 1,464 provided complete physical activity data from days that were measured by both accelerometer and self-report (68%). Following the intervention, a sample of 90–120 girls per school, depending on the school size, was randomly selected. Of the 4,123 girls selected, 3,504 consented and participated in data collection (85%), and 3,114 provided complete activity data from days that were measured by both accelerometer and self-report (76%). Parental consent and student assent were obtained prior to each measurement period.
Instruments
The MTI Actigraph® accelerometer (Ft. Walton Beach, FL) was used to measure physical activity objectively. The MTI Actigraph has been the most widely used accelerometer in youth (15–18). Trost et al. reported high correlations between MTI counts and energy expenditure as measured by treadmill ambulation in children age 10–14 (r = 0.87) (18). Janz reported that MTI counts showed moderate to strong correlation with heart rate telemetry in children age 7–15 in uncontrolled, free-living conditions (r = 0.50–0.74) (15).
Activity was measured by the accelerometer in 30-second epochs. The count thresholds for moderate physical activity (MPA) were set at 1,500–2,600 counts 30 sec−1. This lower threshold is equivalent to 4.6 METs and was found to effectively distinguish between slow and brisk walking (19). Activity measured at >2600 counts 30 sec−1, or 6.5 METS, was classified as vigorous physical activity (VPA). This threshold was found to effectively distinguish between brisk walking and running (19).
Participants reported their engagement in specific types of physical activity using the Three-Day Physical Activity Recall (3DPAR). Participants recalled the activities performed over the previous three days, choosing from a list of 70 activities (16, 20). Each day is divided into eighteen 30-minute segments (“blocks”) and the participant reports the “main activity” performed during each block. Participants could report the activity even if they were not engaged for the full 30 minutes. Participants also report the perceived intensity of the activities, choosing from “light,” “moderate,” “hard,” and “very hard.” An algorithm that combined perceived intensity with MET values for each activity (21) was used to identify blocks that were “moderate” or “vigorous.” The 3DPAR is adapted from the Previous Day Physical Activity Recall, which had the highest correlation with objective measures of activity among youth (r = 0.88) of any self-report measure reviewed by Sirard et al. (5). Pate et al. reported a significant, though lower, correlation between the 3DPAR and accelerometer in adolescent girls (r = 0.28–0.46) (20).
Procedures
Each girl was instructed to wear an accelerometer during waking hours for seven consecutive days. They were instructed on its use and care, and told to remove it only for sleep, for activities in which it could get wet, or when competitive sports required its removal. Accelerometers were initialized to begin collecting data at 5:00 AM on the day after they were distributed, providing six complete days of data. Upon completion of the seven-day period, monitors were returned and participants completed the 3DPAR under the supervision of a trained research assistant who was not involved in delivery of the intervention. All assessments occurred at the student’s school, and all procedures were approved by institutional review boards.
Analyses
Regression analyses based on the general linear mixed model were conducted to test whether the association between activity measures differed between treatment groups. To account for group randomization, school and site were included in all models as random effects. All other variables were treated as fixed effects. All analyses were conducted with SAS version 9.1 (SAS Institute, Cary, NC).
For each girl, only data from days that were measured by both the 3DPAR and accelerometer were included. We computed each girl’s mean daily moderate to vigorous physical activity (MVPA) and vigorous physical activity (VPA), as measured by the 3DPAR and accelerometer separately. Accelerometer minutes were regressed on 3DPAR blocks, treatment group, body mass index (BMI), race/ethnicity, the % of measured days that were on the weekend (Saturday or Sunday), and an interaction term between 3DPAR blocks and treatment group. All variables were modeled as continuous variables except race/ethnicity, which was categorized as non-Hispanic White, non-Hispanic Black, Hispanic, or non-Hispanic Other. MVPA and VPA were analyzed separately using identical models. The residuals from these models were found to be highly skewed, and thus a log transformation was performed for accelerometer minutes after adding 0.1 to each girl’s number of minutes. Analyses were repeated with log-accelerometer minutes as the dependent variable.
RESULTS
Characteristics of intervention and control girls at both time points are presented in Table 1. Ages ranged from 10–14 at baseline, with 94.3% of girls in the baseline sample age 11 or 12. Similarly, age ranged from 12–16 at follow-up, with 95.6% of girls age 13 or 14. Distributions of age were similar between treatment groups. The samples were diverse, with 45.0% non-Hispanic White, 21.5% non-Hispanic Black, 21.7% Hispanic, and 12.0% “non-Hispanic Other” at baseline. Racial distributions were similar at follow-up.
Table 1.
Characteristics of Girls who Provided 3DPAR and Accelerometer Data, Trial of Activity for Adolescent Girls (TAAG), 2003–2005
| Baseline |
Follow-up |
|||
|---|---|---|---|---|
| Intervention (n = 752) | Control (n = 712) | Intervention (n = 1,555) | Control (n = 1,559) | |
| Age (Mean, SD) | 11.9 (0.48) | 12.0 (0.54) | 14.0 (0.51) | 14.0 (0.51) |
| BMI (kg/m2) | ||||
| Mean (SD) | 20.8 (4.82) | 21.0 (5.05) | 22.6 (5.09) | 22.9 (5.48) |
| 85th–95th percentile (%) | 16.2 | 18.3 | 17.6 | 18.2 |
| ≥95th percentile (%) | 15.5 | 17.3 | 15.7 | 17.7 |
| Race/Ethnicity (%) | ||||
| Non-Hispanic White | 46.5 | 43.3 | 46.2 | 48.0 |
| Non-Hispanic Black | 22.5 | 20.5 | 24.4 | 19.3 |
| Hispanic | 20.2 | 23.2 | 18.7 | 20.9 |
| Non-Hispanic Other | 10.8 | 13.1 | 10.7 | 11.8 |
| Weekend days, % (Mean, SD) | 41.4 (33.1) | 41.2 (27.0) | 35.0 (27.5) | 33.1 (29.3) |
Mean activity levels, as measured by the 3DPAR and accelerometer, are presented in Table 2. The association between self-reported and objectively-measured activity was low, as the baseline correlation coefficient between measures was 0.17 for MVPA and 0.14 for VPA in the total sample. The association between measures improved slightly over time overall, but showed different temporal patterns across treatment groups. Correlation coefficients doubled from baseline to follow-up among control girls, but changed little among intervention girls.
Table 2.
Mean (SD) Levels of Physical Activity as Measured by 3DPAR (30-minute blocks) and Accelerometer (minutes), and Correlation Between the Two Measures, Trial of Activity for Adolescent Girls, 2003–2005
| Baseline |
Follow-up |
|||||
|---|---|---|---|---|---|---|
| Total | Intervention | Control | Total | Intervention | Control | |
| MVPA | ||||||
| 3DPAR | 1.74 (2.12) | 1.64 (2.02) | 1.84 (2.21) | 1.47 (1.94) | 1.46 (2.03) | 1.47 (1.86) |
| Accel.* | 21.5 (12.8) | 21.7 (13.0) | 21.2 (12.6) | 20.9 (12.1) | 20.3 (11.5) | 21.6 (12.6) |
| Correlation | 0.17 | 0.21 | 0.14 | 0.25 | 0.20 | 0.30 |
| VPA | ||||||
| 3DPAR | 1.16 (1.63) | 1.11 (1.57) | 1.22 (1.70) | 0.96 (1.50) | 0.98 (1.59) | 0.95 (1.41) |
| Accel.* | 5.14 (5.42) | 5.17 (5.09) | 5.12 (5.74) | 4.91 (4.58) | 4.75 (4.34) | 5.07 (4.80) |
| Correlation | 0.14 | 0.17 | 0.11 | 0.23 | 0.20 | 0.26 |
Accel.: Accelerometer
Table 3 presents results of the multilevel regression analyses that tested for differential association between 3DPAR and accelerometer. In all analyses, the association between 3DPAR and accelerometer was highly significant (p < 0.0001). Before the intervention, one 3DPAR block of MVPA was associated with 0.041 log-accelerometer minutes of MVPA in the control group and 0.063 log-accelerometer minutes of MVPA in the intervention group. The difference between groups was not statistically significant (p = 0.10). Associations were slightly higher for VPA – one 3DPAR block of VPA was associated with 0.073 and 0.094 log-accelerometer minutes in the control and intervention groups, respectively, but again the group difference was not statistically significant (p = 0.41).
Table 3.
Change in Log-Accelerometer Minutes per 3DPAR Block, and Test for Difference Between Treatment Groups, Trial of Activity for Adolescent Girls, 2003–2005
| Baseline |
Follow-up |
|||
|---|---|---|---|---|
| β* | p** | β* | p** | |
| MVPA | ||||
| Control | 0.041 | 0.10 | 0.078 | 0.002 |
| Intervention | 0.063 | 0.049 | ||
| VPA | ||||
| Control | 0.073 | 0.41 | 0.129 | 0.01 |
| Intervention | 0.094 | 0.084 | ||
Adjusted for race/ethnicity, BMI, and % of weekend days (fixed effects); school and site were included as random effects to account for the group randomization
Test for difference by treatment group in association between 3DPAR blocks and log-accelerometer minutes
After the intervention, the trend across groups reversed as the association between measures became significantly lower in the intervention group compared to the control group for both MVPA and VPA. One 3DPAR block of MVPA was associated with 0.078 and 0.049 log-accelerometer minutes in the control and intervention groups, respectively. One 3DPAR block of VPA was associated with 0.129 and 0.084 log-accelerometer minutes in the control and intervention groups, respectively.
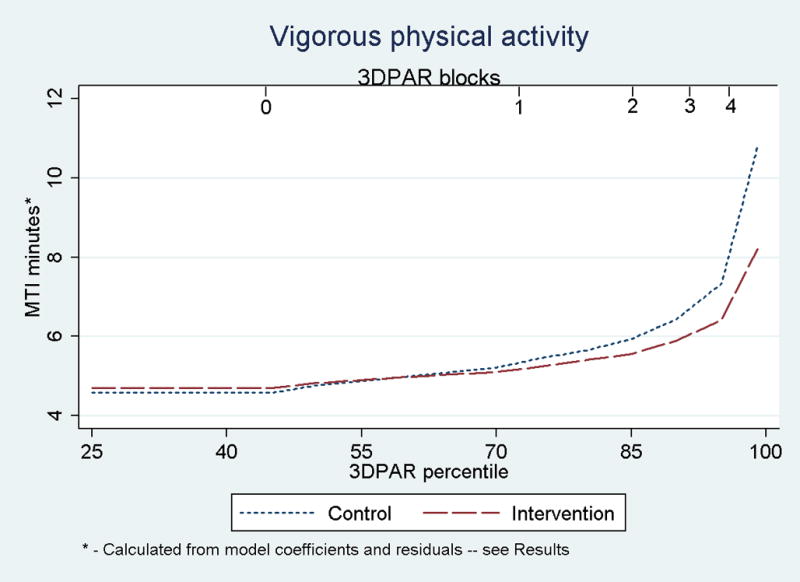
The log-transformation substantially improved the model fit to provide a more valid test of a group difference, but using log-minutes as the outcome complicates the interpretation. It is difficult to evaluate whether such a difference in log-minutes would be sufficient to obscure any treatment effect. To generate a more meaningful interpretation, we exponentiated the distribution of log-minutes predicted by the model to estimate the group difference in accelerometer minutes predicted by the 3DPAR. Figures 1 and 2 illustrate the results of this analysis. Throughout the 3DPAR distribution, in increments of 5 percentile points, we calculated the predicted log-accelerometer minutes for white, non-Hispanic girls at the median BMI and median % of weekend days in each treatment group. At each point in the distribution, we used the predicted value and the standard deviation of the residuals from the model to generate a normal distribution of log-accelerometer minutes. We then exponentiated every observation in this distribution to generate a distribution of accelerometer minutes, and used the mean of the latter distribution as the estimate of accelerometer minutes. Figures 1 and 2 illustrate the estimates for each treatment group to demonstrate the absolute group difference in the association between measures.
Figure 1.
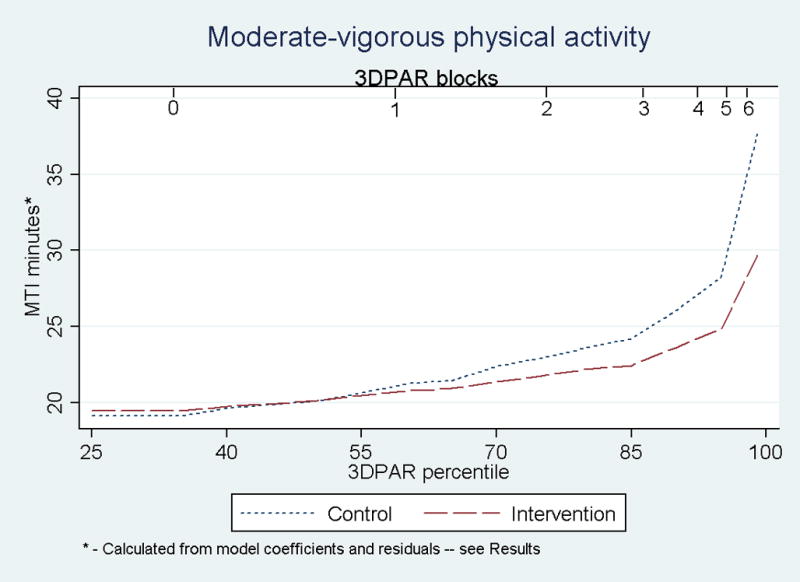
Predicted Accelerometer (MTI) Minutes of MVPA Across 3DPAR Distribution of MVPA, Trial of Activity for Adolescent Girls, 2003–2005
Figure 2.
Predicted Accelerometer (MTI) Minutes of VPA Across 3DPAR Distribution of VPA, Trial of Activity for Adolescent Girls, 2003–2005
In Figure 1, the curves began to diverge at approximately the 60th percentile of the 3DPAR, indicating that intervention girls who reported 1.33 or more blocks of MVPA/day had fewer accelerometer minutes than control girls who reported the same amount. The gap between treatment groups steadily increased until the 85th percentile (3 self-reported blocks/day), at which time it rapidly increased. Among girls at the 85th percentile, intervention girls had 1.77 fewer accelerometer minutes/day than control girls (22.44 vs. 24.21 minutes), or 8.5% of the mean activity level in the total sample. At the 90th and 95th percentiles (4 and 5 blocks/day, respectively), the group difference increased to 2.44 and 3.39 minutes, respectively (11.7 and 16.2% of the mean activity level, respectively). The patterns were similar for VPA (Figure 2), as intervention girls who reported 0.67 or more VPA blocks per day (60th percentile) had fewer accelerometer minutes than control girls who reported the same amount. The group difference in accelerometer minutes of VPA at the 85th, 90th, and 95th percentiles (2, 2.67, and 3.67 self-reported blocks/day, respectively) increased from 0.38 to 0.54 to 0.92 minutes/day, respectively. These differences are equivalent to 7.7, 11.0, and 18.7% of the mean activity level, respectively, in the total sample.
Secondary analyses were conducted to determine if the two activity measures would lead to different conclusions about the effect of TAAG. Using follow-up data, the measures were individually regressed on treatment group, BMI, race/ethnicity, and % of weekend days. These models tested for a group difference in physical activity following the intervention for each measure. Table 4 presents the results of these analyses. As reported elsewhere (22), accelerometer results suggested that control girls were slightly more active, but the group difference was non-significant. 3DPAR results suggested that intervention girls had slightly more VPA while control girls had slightly more MVPA, but again the group differences were non-significant.
Table 4.
Adjusted Mean Activity Levels* (3DPAR Blocks and Log-Accelerometer Minutes) at Follow-up, and Test for Difference Between Treatment Groups, Trial of Activity for Adolescent Girls, 2003–2005
| 3DPAR |
MTI |
|||
|---|---|---|---|---|
| Mean (SE) | p** | Mean (SE) | p** | |
| MVPA | ||||
| Control | 1.48 (0.12) | 0.94 | 2.92 (0.06) | 0.43 |
| Intervention | 1.47 (0.12) | 2.89 (0.06) | ||
| VPA | ||||
| Control | 0.95 (0.09) | 0.66 | 1.33 (0.07) | 0.77 |
| Intervention | 0.98 (0.09) | 1.31 (0.07) | ||
Adjusted for race/ethnicity, BMI, and when activity occurred (fixed effects), and school and site (random effects)
Test for group difference
DISCUSSION
In this study of adolescent girls, a physical activity intervention appeared to cause differential measurement error between the treatment groups. Despite using a self-report instrument that had been previously validated, girls in the intervention group over-reported their activity levels significantly more than girls in the control group.
One of the purposes of the TAAG intervention was to create an environment where physical activity among girls is more socially acceptable (23). Policy, organizational, and environmental changes were designed to provide opportunities for girls to be active, while enhancing social support through encouragement from school staff, community organizations, and peers (14). Promoting activity as a social norm may have the unfortunate byproduct of promoting over-reporting, given that females who exhibit social desirability traits are prone to over-report their activity (7, 8). Other studies have found a similar intervention-induced bias in self-reported diet (9, 10), and this type of bias may occur in other types of behavioral interventions.
When model results were used to predict the number of accelerometer minutes throughout the 3DPAR distribution, it suggested that differential over-reporting was limited to girls above the 60th percentile in the 3DPAR distribution. The significant group difference thus appeared to be due to a minority of intervention girls over-reporting by a relatively large amount rather than the entire sample over-reporting by a small amount. Above the 85th percentile, the group difference was approximately 8–19% of the mean activity level in the total sample; TAAG was powered to detect a 10% difference in activity between treatment groups (24). Overall, however, the magnitude of over-reporting in the intervention group was not large enough to change the conclusion about the intervention’s effect, which was non-significant according to both self-report and accelerometer.
Strengths of this study included the use of both self-report and objective measures that are widely used and have been validated in other samples. This study also utilized female- and age-specific cut-points for different activity intensity levels, based on data from the study population rather than relying on cut-points in the literature that are largely based on mixed-sex samples or a wider age range (25). Finally, our study sample was from a multi-site intervention and was diverse in terms of both race/ethnicity and socioeconomic status.
A key limitation of the study was that the 3DPAR required participants to only identify the “main activity” of each 30-minute block. A self-reported block could represent any portion of 30 minutes, and thus we could not compare the absolute quantity of activity, as assessed by self-report and accelerometry, on a uniform scale. We can, however, conclude that when comparing girls who reported the same level of activity, intervention girls had less objectively measured activity than control girls after the intervention. The correlation between measures may have been limited by the narrow range of values on the 3DPAR, but this is unlikely to induce a group difference unless activity levels differed between groups. The baseline correlation may have also been limited because the accelerometer thresholds were based on a sample of 13–14 year-old girls, and thus may have been less valid in a younger sample. Finally, the accelerometer cannot capture certain types of activity (e.g. swimming, cycling) and relies on participant compliance. We examined self-reported swimming and cycling participation in 8th grade by treatment group to determine if group differences in these activities could account for our results, and found no such differences in participation.
The results of this study further question the use of self-report activity measures that have been doubted by experts (2–5). Future intervention studies should not dismiss measurement error from self-report instruments as non-differential and assume that any effect estimates are conservative. Evidence from self-report instruments indicating that an intervention produced behavior change should be interpreted with caution as it is possible that the intervention promoted over-reporting of the targeted behavior. At a minimum, investigators should acknowledge this potential bias as a weakness and be careful to differentiate between objectively measured and self-reported results (3).
Acknowledgments
This study was supported by funds from the NHLBI grant #s HL66845, HL66852, HL66853, HL66855, HL66856, HL66857, HL66858.
The authors thank the faculties and staffs of the 36 schools that participated in the trial, as well as the investigators and support staff at the various study sites. The Project Office at the National Heart, Lung, and Blood Institute was an equal partner in the design and implementation of the trial and in the analysis and interpretation of the data. They also approved the final version of the manuscript.
ABBREVIATIONS
- TAAG
Trial of Activity for Adolescent Girls
- NHLBI
National Heart, Lung, and Blood Institute
- MVPA
Moderate-vigorous physical activity
- MPA
Moderate physical activity
- VPA
Vigorous physical activity
- 3DPAR
3-Day Physical Activity Recall
- BMI
Body mass index
Footnotes
Publisher's Disclaimer: This is a PDF file of an unedited manuscript that has been accepted for publication. As a service to our customers we are providing this early version of the manuscript. The manuscript will undergo copyediting, typesetting, and review of the resulting proof before it is published in its final citable form. Please note that during the production process errors may be discovered which could affect the content, and all legal disclaimers that apply to the journal pertain.
References
- 1.Salmon J, Booth ML, Phongsavan P, et al. Promoting physical activity participation among children and adolescents. Epidemiol Rev. 2007;29:144–59. doi: 10.1093/epirev/mxm010. [DOI] [PubMed] [Google Scholar]
- 2.Shephard RJ. Limits to the measurement of habitual physical activity by questionnaires. Br J Sports Med. 2003;37:197–206. doi: 10.1136/bjsm.37.3.197. [DOI] [PMC free article] [PubMed] [Google Scholar]
- 3.Stevens J, Taber DR, Murray DM, et al. Advances and controversies in the design of obesity prevention trials. Obesity (Silver Spring) 2007;15:2163–70. doi: 10.1038/oby.2007.257. [DOI] [PubMed] [Google Scholar]
- 4.Jacobs DR, Jr, Ainsworth BE, Hartman TJ, et al. A simultaneous evaluation of 10 commonly used physical activity questionnaires. Med Sci Sports Exerc. 1993;25:81–91. doi: 10.1249/00005768-199301000-00012. [DOI] [PubMed] [Google Scholar]
- 5.Sirard JR, Pate RR. Physical activity assessment in children and adolescents. Sports Med. 2001;31:439–54. doi: 10.2165/00007256-200131060-00004. [DOI] [PubMed] [Google Scholar]
- 6.Hebert JR, Ma Y, Clemow L, et al. Gender differences in social desirability and social approval bias in dietary self-report. Am J Epidemiol. 1997;146:1046–55. doi: 10.1093/oxfordjournals.aje.a009233. [DOI] [PubMed] [Google Scholar]
- 7.Adams SA, Matthews CE, Ebbeling CB, et al. The effect of social desirability and social approval on self-reports of physical activity. Am J Epidemiol. 2005;161:389–98. doi: 10.1093/aje/kwi054. [DOI] [PMC free article] [PubMed] [Google Scholar]
- 8.Klesges LM, Baranowski T, Beech B, et al. Social desirability bias in self-reported dietary, physical activity and weight concerns measures in 8- to 10-year-old African-American girls: results from the Girls Health Enrichment Multisite Studies (GEMS) Prev Med. 2004;38 (Suppl):S78–87. doi: 10.1016/j.ypmed.2003.07.003. [DOI] [PubMed] [Google Scholar]
- 9.Espeland MA, Kumanyika S, Wilson AC, et al. Lifestyle interventions influence relative errors in self-reported diet intake of sodium and potassium. Ann Epidemiol. 2001;11:85–93. doi: 10.1016/s1047-2797(00)00173-3. [DOI] [PubMed] [Google Scholar]
- 10.Harnack L, Himes JH, Anliker J, et al. Intervention-related bias in reporting of food intake by fifth-grade children participating in an obesity prevention study. Am J Epidemiol. 2004;160:1117–21. doi: 10.1093/aje/kwh328. [DOI] [PubMed] [Google Scholar]
- 11.Friedenreich CM. Improving long-term recall in epidemiologic studies. Epidemiology. 1994;5:1–4. [PubMed] [Google Scholar]
- 12.Jobe JB. Cognitive psychology and self-reports: models and methods. Qual Life Res. 2003;12:219–27. doi: 10.1023/a:1023279029852. [DOI] [PubMed] [Google Scholar]
- 13.Stevens J, Murray DM, Catellier DJ, et al. Design of the Trial of Activity in Adolescent Girls (TAAG) Contemp Clin Trials. 2005;26:223–33. doi: 10.1016/j.cct.2004.12.011. [DOI] [PMC free article] [PubMed] [Google Scholar]
- 14.Elder JP, Lytle L, Sallis JF, et al. A description of the social-ecological framework used in the trial of activity for adolescent girls (TAAG) Health Educ Res. 2007;22:155–65. doi: 10.1093/her/cyl059. [DOI] [PMC free article] [PubMed] [Google Scholar]
- 15.Janz KF. Validation of the CSA accelerometer for assessing children’s physical activity. Med Sci Sports Exerc. 1994;26:369–75. [PubMed] [Google Scholar]
- 16.McMurray RG, Ring KB, Treuth MS, et al. Comparison of two approaches to structured physical activity surveys for adolescents. Med Sci Sports Exerc. 2004;36:2135–43. doi: 10.1249/01.mss.0000147628.78551.3b. [DOI] [PMC free article] [PubMed] [Google Scholar]
- 17.Puyau MR, Adolph AL, Vohra FA, et al. Validation and calibration of physical activity monitors in children. Obes Res. 2002;10:150–7. doi: 10.1038/oby.2002.24. [DOI] [PubMed] [Google Scholar]
- 18.Trost SG, Ward DS, Moorehead SM, et al. Validity of the computer science and applications (CSA) activity monitor in children. Med Sci Sports Exerc. 1998;30:629–33. doi: 10.1097/00005768-199804000-00023. [DOI] [PubMed] [Google Scholar]
- 19.Treuth MS, Schmitz K, Catellier DJ, et al. Defining accelerometer thresholds for activity intensities in adolescent girls. Med Sci Sports Exerc. 2004;36:1259–66. [PMC free article] [PubMed] [Google Scholar]
- 20.Pate RR, Ross R, Dowda M, et al. Validation of a 3-day physical activity recall instrument in female youth. Pediatr Exerc Sci. 2003;15:257–65. [Google Scholar]
- 21.Ainsworth BE, Haskell WL, Whitt MC, et al. Compendium of physical activities: an update of activity codes and MET intensities. Med Sci Sports Exerc. 2000;32:S498–504. doi: 10.1097/00005768-200009001-00009. [DOI] [PubMed] [Google Scholar]
- 22.Webber LS, Catellier DJ, Lytle LA, et al. Promoting physical activity in middle school girls: Trial of Activity for Adolescent Girls. Am J Prev Med. 2008;34:173–84. doi: 10.1016/j.amepre.2007.11.018. [DOI] [PMC free article] [PubMed] [Google Scholar]
- 23.Young DR, Johnson CC, Steckler A, et al. Data to action: using formative research to develop intervention programs to increase physical activity in adolescent girls. Health Educ Behav. 2006;33:97–111. doi: 10.1177/1090198105282444. [DOI] [PMC free article] [PubMed] [Google Scholar]
- 24.Murray DM, Catellier DJ, Hannan PJ, et al. School-level intraclass correlation for physical activity in adolescent girls. Med Sci Sports Exerc. 2004;36:876–82. doi: 10.1249/01.mss.0000126806.72453.1c. [DOI] [PMC free article] [PubMed] [Google Scholar]
- 25.Freedson P, Pober D, Janz KF. Calibration of accelerometer output for children. Med Sci Sports Exerc. 2005;37:S523–30. doi: 10.1249/01.mss.0000185658.28284.ba. [DOI] [PubMed] [Google Scholar]