

Abstract
Modern tools for the analysis of cellular function aim for the quantitative measurement of all members of a given class of biological molecules. Of the analyte classes, nucleic acid measurements are typically the most tractable, both on an individual analyte basis and in parallel. Thus, tools are being sought to enable measurement of other cellular molecules using nucleic acid biosensors. Of the variety of potential nucleic acid biosensor strategies, structure-switching aptamers (SSAs) present a unique opportunity to couple sensing and readout of the target molecule. However, little has been characterized about the parameters that determine the fidelity of the signal from SSA biosensors. In this study, a small molecule biosensor based on a SSA was engineered to detect the model small molecule, theophylline, in solution. Quantitative theophylline detection over nearly three orders-of-magnitude was achieved by scintillation counting and quantitative PCR. Further analysis showed that the biosensor fidelity is primarily controlled by the relative stability of the two conformations of the SSA.
Keywords: Aptamer, Structure switching, Theophylline, Biosensor design, Molecular Barcode, Affinity
Introduction
Evolution in the analysis of biological function occurs in concert with the development and application of new analytical techniques. Quantification techniques for DNA or RNA molecules were established early, based on Watson-Crick base pairing of nucleic acids, with, for instance, quantitative polymerase chain reaction (qPCR) now common practice for nucleic acid analyses[1–5]. Sensing techniques for non-nucleic acid molecules such as proteins and small molecules, especially parallel techniques, are markedly less mature. The importance of small molecule analyses is illustrated by current efforts in metabolomics, as understanding the profile of small molecules generated by metabolism provides a comprehensive picture of the effects of upstream transcriptional and translational changes. Moreover, a great number of drugs are small molecules, so specific and accurate measurement of their levels is essential to therapeutic monitoring of disease treatment. Currently, small molecule measurements are primarily performed using spectroscopic analyses combined with chromatography[6, 7]. Analysis of data from these methods can be limited due to the difficulty in resolving constituents with chemical or structural similarity. Thus, more flexible methods for small molecule analyses are being sought.
In recent years, aptamers have shown promise in small molecule and protein biosensing applications[8–14]. Aptamers are nucleic acid affinity molecules with exceptional specificity for a target for which they were specifically selected[15, 16]. In comparison to antibodies, aptamers offer a number of advantages for sensing applications. First, the sequences for a large number of aptamers have been reported[17, 18], and these sequences can be easily synthesized chemically or enzymatically with high reproducibility and purity. Moreover, because aptamers are generated by in vitro selection, in theory, aptamers targeting any analyte could be generated. Second, the specificity and affinity of aptamers is tunable through manipulation of the selection conditions, such as by incorporating negative selection against similar analytes that would confound accurate detection[19]. The degree of specificity that can be achieved is especially advantageous for multiplex sensing applications. Third, aptamers can be generated with chemically-modified nucleotides to enhance their properties for various applications, such as stability to nucleases for measurements in biological fluids [20, 21]. Finally, aptamers can be readily engineered for specific signaling function using designed selection or through post hoc manipulations[22, 23].
A unique class of aptamer-based sensors has been termed structure-switching aptamers (SSAs), wherein the binding of the target molecule results in a conformational change of the SSA. Given their simultaneous sensing and readout, SSAs are of particular interest for biosensing applications[24–31]. A common mode for the structure switching behavior is based upon helix-rearrangement coupled with strand displacement[29, 32, 33]. The ability to design SSA sequences a priori to utilize this rearrangement is essentially unique to nucleic acids. This enables flexible and facile design of SSA biosensors with coupled readouts, such as to mimic molecular beacons[34–36] or to engineer cellular responses[37, 38].
The utility of SSA-based sensing techniques, as with all analytical methods, is defined largely by the signal-to-noise ratio of the technique. Both rational design strategies and high throughput screening techniques have been investigated to generate SSAs with high signal-to-noise ratio[38, 39]. However, little has been characterized about the parameters impacting the signal fidelity of a SSA. Thus, there is a clear need to identify these parameters and use them as theoretical guidance in generating SSA biosensors with optimal function. In this work, a modular-designed SSA that acts by strand displacement was applied to quantify the concentration of a model small molecule, theophylline. This SSA was designed for future parallel analyses through the inclusion of a molecular barcode (MB)[40] and was therefore termed a molecular barcode switch (MBS). These MBs have been shown to provide quantitative accuracy in parallel nucleic acid analyses[41, 42]. An oligonucleotide complementary to the MB domain of the MBS (molecular barcode complement, MBC) was used to probe the conformational change upon target binding and to utilize the change for the concentration readout. It was observed that the affinity between the MBS and the complementary strand relative to the internal stability of the MBS structure was a principal factor limiting the achievable signal-to-noise ratio. Using the designed construct, theophylline concentrations as low as 0.5 μM can be reproducibly detected in solution. The observed lower detection limit for theophylline exceeded that of caffeine by over three orders of magnitude, confirming analytical specificity. As previous studies have coupled PCR amplification with aptamer-based protein measurement[39, 43–45], here we also report the applicability of PCR for small molecule quantification.
Experimental Section
Synthesis of the MBS
A double-stranded DNA was prepared by Klenow extension from a synthesized single-stranded DNA template and the reverse primer. MBSs were in vitro transcribed from the double-stranded DNA and purified. Assays with varying length of MBC showed no significant binding to the MBS when the MBC was shorter than 14-nt. Longer MBC sequences tended to cause higher background binding. Therefore, an MBC of 20-nt in length was chosen to generate the maximum signal-to-noise ratio (S/N). For subsequent separation using streptavidin-coated magnetic beads (see below), the MBC was biotinylated at the 3′end. For reverse transcription-qPCR (RT-qPCR), the reverse primer from Klenow extension was used, along with the forward primer. Sequences and additional reaction details are described in the supplementary information.
Binding reactions and theophylline sensing experiments
Binding reactions were performed in a buffer of 50 mM Tris-HCl (pH 8.0), 100 mM NaCl, and 5 mM MgCl2. Varying concentrations of theophylline (Sigma Aldrich, St. Louis, MO) were added to thermally annealed MBSs and incubated at room temperature for 30 min. MBCs were then added and incubated at room temperature. The total binding reaction volume was 30 μl. The MBC incubation time was 10 min for theophylline sensing applications and 20 hrs for deriving equilibrium dissociation constants (KD).
Separation of MBS-MBC complexes was achieved by either electrophoretic mobility shift assay (EMSA) or streptavidin-coated magnetic beads. For EMSA, the MBCs were 5′-labeled with 33P-γ-ATP using T4 polynucleotide kinase (Ambion, Austin, TX) followed by purification by Quick Spin Columns (Roche, Indianapolis, IN). Electrophoresis and gel imaging were performed as described in the supplementary information. Band intensities were quantified, and the fraction bound was calculated as the band intensity of the MBS-MBC complex divided by the total intensity of the bands for the complex and the free MBCs.
For magnetic bead separations, binding reactions were performed with 5′-33P labeled MBSs when using scintillation counting as the read out and with unlabeled strands when using RT-qPCR. Binding reactions were added to streptavidin-coated magnetic beads (Dynal; Oslo, Norway), and a magnet was applied to retain the beads while the supernatant was removed. The beads were then washed. Retained MBSs were eluted from the magnetic beads, and the supernatant was collected for scintillation counting or RT-qPCR (See Supplementary Information for additional details). The theophylline detection limit for scintillation counting (Figure 5) was calculated as the background signal plus three times the experimental standard deviation of the measured values at background. By linear interpolation of data near the lower detection limit, a minimum detectable theophylline concentration of 0.5 μM was obtained (Figure 5).
Figure 5. Theophylline and caffeine standard curves at optimal MBS and MBC concentration.

Using 10 nM MBC and 10 nM MBS, the standard curves for theophylline (circles) and caffeine (squares) show a dynamic range for theophylline of over two orders-of-magnitude, while maintaining nearly four order-of-magnitude discrimination against the structurally-similar caffeine (* denotes signal significantly higher than background, p< 0.05). For simplicity, the fractional MBS binding at each analyte concentration was calculated as counts of eluted MBSs relative to counts of total MBS input. Relative values were equivalent to those normalized to the total counts recovered from the sum of supernatant, wash and elution from beads.
Experiments for determining optimal sensing conditions were performed in binding reactions with varying concentration pairs of MBC (0.1, 1.0, 10, 50, and 100 nM) and MBS (0.1, 1.0, 10, and 50 nM) in the presence (2 mM) or absence of theophylline. Magnetic beads were used to separate the bound MBSs, followed by scintillation counting as described. MBS fractional binding in the presence of 2 mM and 0 mM theophylline were defined as signal and noise, respectively. Signal-to-noise ratios (S/N) and their differences (S-N) were calculated from the measured data for each concentration pair. Contour plots (Figures 4, 7, S4, and S6) were generated by Sigmaplot. The aggregate score (Figures S4b and S6b) was obtained by scaling the ratios and differences as a fraction of the range from the minimum to the maximum and then summing the two scaled values. The resulting sums were then scaled from 0 to 1 to obtain the displayed results.
Figure 4. Concentrations for optimal S/N.

The fractional MBS binding was calculated as counts from the eluted MBSs normalized to the total counts recovered from the supernatant, washes, and elution. The fractional MBS binding in the presence of 2 mM (signal) and 0 mM (noise) theophylline was measured from which signal-to-noise ratio (S/N) was calculated as described in the Experimental Section. Using MBS and MBC concentrations of 10 nM provided the maximal experimental S/N.
Figure 7. Theoretical analysis of S/N.

Using the KD values for MBS-MBC complex formation in the presence of saturating levels of theophylline and in the absence of theophylline, the equilibrium MBS fraction binding at varying MBS and MBC concentrations was calculated using equation (2). S/N values were then calculated as in Figure 4.
Binding affinity and theoretical signal-to-noise ratio calculation
For experiments to determine dissociation constants, the KD values were calculated from curve fits using Origin software based on:
where f is the fraction bound of MBC as calculated from the quantified gel images. This fit requires that the concentration of free MBS is nearly constant at its initial value throughout the experiment. MBC concentrations were minimized to maximize the validity of this assumption[46]. Data from at least three experimental runs were fit simultaneously to generate a single parameter fit to all the data.
Theoretical fractional MBS binding at each MBS and MBC concentration pair was calculated as follows:
where f is the MBS fraction bound and KD is the dissociation constant of MBS-MBC binding. This arises from the equilibrium reaction equation wherein one free MBS and one free MBC combine to form one complex. S/N and S−N were then calculated by solving (2) using the appropriate KD, [MBS]0, and [MBC]0 values for each condition.
Reverse transcription and quantitative PCR
Following binding and elution from the magnetic beads as described above, MBSs were reverse-transcribed using the reverse primer and superscript III (Invitrogen, Carlsbad, California) per the manufacturer’s instructions. The cDNA was amplified by qPCR using iQ SYBR Green Supermix (Bio-Rad, Hercules, CA) in a MyiQ Real Time PCR detection system (Bio-Rad, Hercules, CA). The purity of the resulting qPCR products was confirmed by gel electrophoresis. Threshold cycle (Ct) values for the qPCR standard curve (Figure S5) were generated with ten-fold dilutions of initial MBS template. Initial template concentrations ranged from 485 aM to 485 pM, in 50 μl qPCR reactions.
Results and Discussion
Application of theophylline-responsive MBS
The goal of any analytical strategy is precise, accurate, and quantitative measurement of the analyte(s) of interest. SSAs have been proposed as a basis for solution-phase and solid-substrate mediated single and parallel analyses[24, 25, 34, 47]. Here, a theophylline-sensitive SSA was constructed where the quantity of aptamer that undergoes a conformational change provided the readout of the theophylline concentration (Figure 1). The SSA consists of two domains, the aptamer domain and the readout domain. This modular design approach is well-established[37, 38] and provides a basis for convenient multiplex detection of SSAs by careful design of the readout domain.
Figure 1. MBS design and detection strategy.
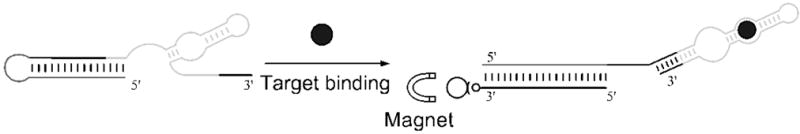
In the native conformation of the MBS, the MB sequence forms a 15 bp intramolecular stem. Upon theophylline binding with the aptamer domain (light gray), competition by the free 3′-end of the MBS becomes more favored, increasing the exposure of the MB domain (dark gray) for hybridization with an MBC. Using biotinylated MBCs and streptavidin-coated magnetic beads, the MBSs with available MB domains can be selectively removed from the solution and quantified by standard nucleic acid analytical techniques.
In the described detection strategy, the readout is based on the enhanced binding affinity of MBCs to MBSs bound to their target relative to MBSs without bound target (Figure 1). This is due to the structural rearrangement of the aptamer domain upon target binding. Upon rearrangement, intermolecular hybridization in the MB domain can compete more easily with native intramolecular hybridization. Streptavidin-coated magnetic beads loaded with MBC sequences are used to isolate MBSs with bound analyte for subsequent quantification by qPCR, microarray, or other convenient nucleic acid analytical strategy. The technique thus provides an indirect but still quantitative measurement of the theophylline concentration. Using gel-shift experiments (Figures 2 and S1), it was verified that the binding of MBC by MBS is dependent on theophylline concentration. Maximal binding of the MBC occurred at 200 μM − 2 mM concentration of theophylline (Figure S1), thus subsequent experiments where saturating MBS-theophylline interactions were desired were performed at 2 mM theophylline. Binding with 2 mM caffeine showed fractional MBC binding equal to that with 2 μM theophylline (Figure 2, lane 10), which is consistent with the difference in the affinity of the aptamer for these two species[19]. Thus, the specificity of the aptamer for theophylline over caffeine was maintained in the MBS design, further support for use of the modular MBS construction strategy. It is worthwhile to note that even in the absence of theophylline, the fractional MBC hybridization with the MBS was 0.25 (Figure 2, lane 3). This suggests that caution must be taken in the development of SSA-based analyses to ensure minimal background.
Figure 2. Impact of theophylline on MBS-MBC hybridization.

Theophylline at concentrations of 0–2 mM (lanes 3–9) was incubated with MBSs followed by hybridization with radiolabeled MBCs. Signal from the upper band indicates an MBS-MBC complex. Complexes with and without theophylline cannot be distinguished. Lane 1: MBC alone. Lane 2: 5 nM MBC with 2 mM theophylline. Lane 3–9: 5 nM MBC, 16 nM MBS and 0, 20 nM, 200 nM, 2 μM, 20 μM, 200 μM, and 2 mM theophylline. Lane 10: 5 nM MBC, 16 nM MBS and 2 mM caffeine. Image contrast was adjusted to improve image clarity but band intensities used for fraction bound calculations were not altered.
To assess further if structural rearrangement of the MBS upon theophylline binding was responsible for the change in MBS-MBC binding affinity, gel shift assays were conducted in the absence and presence of 2 mM theophylline. Initially, a wide range of MBS concentrations were chosen to estimate roughly the KD of MBS-MBC complex formation. Subsequent experiments focused on the range surrounding the concentration resulting in 50% binding for a more accurate evaluation of the KD. As expected, with increasing MBS concentration, MBC fractional binding increases (Figures 3 and S2), yielding KD values for MBS-MBC hybridization in the absence and presence of theophylline of 9.9 nM and 1.0 nM, respectively. This change in affinity reflects the change in the relative stability of the two MBS conformations due to theophylline binding. The basal level of binding between the MBS and MBC that occurred in the absence of theophylline was therefore predefined by their KD and the concentration of the two strands. It should also be noted that even at saturating theophylline concentration, the MB domain was not necessarily completely exposed to hybridize with its complement. This is reflected in a much lower affinity between the strands than might be expected for hybridization of sequences of this length[46]. Nonetheless, the significantly enhanced binding of the MBC indicates increased accessibility of the MB sequence on the MBS, indicative of the expected structural rearrangement.
Figure 3. Quantification of MBS-MBC binding affinity.

EMSAs were used to measure the KD for the MBS-MBC complex in the absence (circles) and in the presence (squares) of 2 mM theophylline. Gel images can be found in Figure S2. MBCs were incubated with increasing concentrations of MBS. The fraction of MBC bound was calculated. Data from at least three gels for each condition were plotted simultaneously and fit with a single parameter. In the absence and presence of theophylline, the measured KD values were 9.9 ± 1.0 nM (R2=0.884) and 1.0 ± 0.1 nM (R2=0.957), respectively.
It was now desired to test the possibility of accurate solution phase analyte detection using the MBS rearrangement. The analytical method as described (Figure 1) requires that the quantity of retained MBSs following separation by magnetic beads be quantitatively reliable over a broad dynamic range. Given that MBSs are both the detectors and the readout in this scheme, two methods can be used for quantification that are convenient with nucleic acids, scintillation counting and qPCR. Using radiolabeled MBSs, the quantitative reliability of the magnetic bead separation over the concentration range of interest was first confirmed (Figure S3). Across a four order-of-magnitude span, the separation and detection of labeled MBSs was quantitatively accurate as compared to the initial input of labeled MBS. Thus, a standard curve built from the signal obtained from the separated and washed MBSs does provide accurate and sensitive quantification of the initial quantity of MBSs.
Using scintillation counting, the conditions for optimal sensing of theophylline with this MBS-MBC design were determined. The signal was defined as the fractional binding of MBS to MBC in the presence of saturating concentration of theophylline (2 mM) and noise as the fractional binding in the absence of theophylline. By varying the concentrations of MBS and MBC, changes in S/N (Figure 4) were determined experimentally. The highest measured S/N was found to be 2.9 at MBS and MBC concentrations of 10 nM. Synthetic riboswitches that acts as theophylline sensors in vivo[38] or in in vitro translation[48] systems showed higher S/N values than we obtained in our in vitro system. One explanation could be that, in these systems, enzymatic events, such as translation, provide the readout for sensor function. The S/N can therefore be improved, for instance, by the accumulation of proteins that occurs following each signaling event. The relatively-lower frequency of events in the absence of signal also limits the noise from these readouts, further increasing the S/N. Nonetheless, our system provides i) the sensitivity and precision required for accurate measurement of theophylline at concentrations spanning the medically-relevant regime and ii) a basis for exploring the important parameters of SSA-based biosensor design.
The signal-to-noise differences (S-N, Figure S4a) at varying concentrations of MBS and MBC were also determined. The largest value was achieved at 1 nM MBS and 50 nM MBC. Using these conditions results in a 2.1-fold increase in signal relative to 10 nM MBS and 10 nM MBC, but it comes at the cost of a 3.8-fold increase in the noise, resulting in a lower S/N. As S/N measures the relative discrimination of the two signals and S-N measures the difference in their absolute levels, both metrics are valuable in choosing the conditions for optimal sensing. We therefore summed the scaled values of these two parameters to define an aggregate score for sensing (Figure S4b). The maximal aggregate score was, as with S/N, obtained at MBS and MBC concentrations of 10 nM. Thus, subsequent experiments to examine the quantitative capacity and sensitivity for theophylline sensing by the technique were performed at these MBS and MBC concentrations.
With the analytical process validated, theophylline concentrations were measured using the described technique. Radiolabeled MBS was incubated in the presence of serial dilutions of theophylline ranging from 0.2 μM to 2 mM. MBC was then added for 10 min, the incubation time that provided the best resolution of bound and free MBS (data not shown). Hence, the interaction of the MBS and MBC is kinetically-limited, rather than equilibrium-limited, as at equilibrium the 20-nt MBC would outcompete the 15-nt cis regulator strand and raise the background (lower S/N) relative to the time frame chosen empirically for these experiments. Accurate quantification of theophylline concentration from 0.5 μM to 200 μM could be consistently achieved (Figure 5). This detection limit is lower than other current sensing techniques for theophylline[49–51]. The dynamic range is also greater than other recently-described aptamer-based theophylline sensing techniques[33, 52], and easily spans the range of clinically-relevant theophylline concentrations (55–111 μM)[53]. Furthermore, in our experiments, only 3 μl samples were used, less than the minimum volumes required for many theophylline measurement techniques[54]. As caffeine can convolute the signal for theophylline sensors, the function of the technique in response to caffeine was verified, and it was found that the specificity of separation and detection was maintained at lower than 1 mM analyte concentrations (Figure 5). Only 2 mM caffeine had measurable signal significantly above background. This concentration is one order-of-magnitude higher than the analytically important plasma caffeine range (25 to 100 μM)[52]. Therefore, the designed theophylline sensing technique can selectively discriminate highly structurally-similar molecules at appropriate and useful concentrations.
The advantages of radioactive readouts are their sensitivity and dynamic range. In many circumstances, however, use of radioactivity is undesirable. With the designed MBS sensors, it was important to determine if qPCR could be used as an amplifiable readout of theophylline concentration. PCR-based readouts are particularly useful for parallel applications, as demonstrated previously with MBs[41, 42]. The fidelity of qPCR from MBS templates was first confirmed (Figure S5), showing a linear response over six orders of magnitude of template concentration. Theophylline concentrations were then measured using qPCR as the readout (Figure 6). Theophylline was incubated with unlabeled MBS and biotinylated MBC. The complexes were separated with streptavidin magnetic beads, and eluted MBSs were reverse transcribed and amplified by qPCR. As expected, the results showed decreasing Ct values with increasing theophylline concentration. The detection limit determined by student t-test is 1 μM, and the dynamic range is from 1 μM to 20 μM. The maximal signal-to-noise ratio was ~3.2 (2(12.5-10.8)), similar to what was found with the scintillation counting readout (Figure 5), and no significant response was observed for caffeine over the same concentration span.
Figure 6. Quantification of theophylline concentration.

After binding and magnetic bead separation, RT-qPCR was performed on eluted MBSs. Concentration sensitivity for theophylline (circles) was demonstrated across over two orders of magnitude in concentration spanning the clinically-relevant theophylline concentration range (* denotes signal significantly higher than background, p < 0.05). No significant response was seen for caffeine (squares) over the same concentration span.
Analysis of MBS performance
Having determined the maximal S/N experimentally using two methods, it was of interest to analyze further the variables limiting the resolution of our SSA-based method. Using the measured values for the binding affinities in the presence and absence of theophylline, the theoretical equilibrium behavior of the system was calculated. Assuming that, when theophylline is present, it is fully-equilibrated with the MBS, the fractional binding of MBS to the MBC was calculated at specified initial concentrations of MBS and MBC. S/N, S-N, and the aggregate score were then calculated using a KD of 1 nM (saturating theophylline condition) and a KD of 9.9 nM (no theophylline condition) (Figures 7 and S6). The ratio (Figure 7) reaches a maximum approaching 10 at low MBS and MBC concentrations. This ratio depends exactly on the 10-fold change in affinity between the two conditions for our MBS design; i.e., KD becomes the dominant term in equations (1) and (2). At limiting concentrations of both MBC and MBS, fractional binding scales exactly as the inverse of KD. However, this resolution could only be achieved with superb analytical sensitivity, due to the extraordinarily small quantities of analytes at such concentrations (e.g., only 105 MBS molecules would be contained in a 3 μL sample at a concentration of 10−4 nM).
As the concentrations increase, especially above the KD values, the concentrations dominate in equation (1) and (2), minimizing the impact of the affinity difference and causing the ratio to approach 1 (Figure 7). At 10 nM MBS and MBC, the theoretical S/N value is 1.9, in good agreement with the experimentally-derived value of 2.9. The discrepancy likely arises from the fact that our experimental data were not taken at the equilibrium condition. Because intermolecular hybridization affinity can scale with association rate[46], short time points would therefore improve the ratio relative to the equilibrium condition. The correlation of the experimental and theoretical data across the concentration ranges for low concentrations of MBC and MBS is not as strong. This is likely due to technical differences between the calculations and the experiments. The theoretical plots do not account for the lower detection limits for scintillation counting. In addition, to maximize the true signal eluted from the beads, the complexes were washed, which immediately shifts the equilibrium to reduce the number of bound MBSs that are recovered. On a fractional basis, the loss of bound MBSs during the wash steps will reduce the signal recovered at low MBS and MBC concentrations far more dramatically than at high concentrations. Hence, both signals approach the detection background. This is likely the reason the experimental ratios decline at lower than 10 nM concentrations. While the S/N achieved experimentally was sufficient to provide sensitive and accurate theophylline detection, the theoretical analysis suggests that improvements to the resolution of the technique may still be achievable.
Examining the theoretical difference, it peaks at MBC concentrations between the KD values, at limiting MBS concentrations (Figure S6a). This is expected due to the maximum absolute distance between the binding curves at these conditions (similar to the separation between the curves along the vertical line at [MBS] ≈3 nM on Figure 3). The experimental S-N showed a peak value at MBC and MBS concentrations (50 nM and 1 nM, respectively) higher than those of the theoretical peak, but the peak experimental S-N value of 0.18 is in line with the theoretical value of 0.2 at these concentrations. For the aggregate score, the experimental peak score also occurred at MBS and MBC concentrations both above those of the theoretical peak (compare Figures S4b and S6b). However, looking only at 10 nM concentration of MBS, we see the maximum aggregate score at 10 nM MBC (Figure S6c), to some degree supporting our experimental results. For the experimental conditions, the theoretical aggregate score was ~60% of the global theoretical maximum, another indication that technical improvements to our analytical strategy may be possible.
Typically, to design a SSA biosensor, multiple designs are tested to identify which has the most desirable properties by some metric, such as S/N[24]. Our analyses argue strongly that the experimental behavior of the MBS can be reliably captured by a relatively simple theoretical model in which only the affinities of the SSA for its complement in the presence and absence of target are required. The analysis described above relies on the experimentally derived KD values to predict the expected S/N. As minimum free energy structures have proven useful in unimolecular nucleic acid sensor design[55] and interaction free energies between molecules tend to be at least relatively correct as compared to experimental data[46], we also preliminarily investigated whether a thermodynamic construct using minimum free energy structure predictions, based on our previous work[56], would allow us to predict KD values as another means of evaluating alternative designs for the MBS and MBC that would provide higher S/N (Figure S7 and Table S1). Improvements in S/N should result from increases in the affinity of the MBS for the MBC in the presence of analyte relative to the affinity in the absence of analyte. Of the modifications tested computationally, only extending the 5′-end of the MBS seemed to suggest a means of dramatically increasing the relative affinity ratio. Our experimental tests with this lengthened construct suggested an improved S/N but did not provide sufficient signal using our current protocols to confirm this above statistical noise. We will continue to explore whether technical optimizations can yield increases in S/N and what other parameters may be limiting our aptamer-based biosensor sensitivity and specificity.
Conclusion
A theophylline quantification technique was designed using a SSA in combination with scintillation counting or qPCR. In this manner, the SSA converted the analyte signal into a nucleic acid signal for subsequent amplification and quantification. Analytical accuracy and specificity were readily achieved by this technique. Analysis of the controlling parameters of the system indicated that further performance enhancements may be achievable through careful SSA design and protocol optimization.
Acknowledgments
The authors would like to thank Brad Hall, Xi Chen, Andrew Ellington, and Jun Sun for meaningful discussions and assistance with techniques. We also thank Mark Swartzlander, Xuewei Wang, Hyun Ju Cho, Christina Chan, and all the members of the Cellular and Biomolecular Laboratory for general advice and assistance. Financial support for this work was provided in part by Michigan State University, the National Science Foundation (#0425821), and the National Institutes of Health (#CA126136, #GM079688, #RR024439).
Footnotes
Publisher's Disclaimer: This is a PDF file of an unedited manuscript that has been accepted for publication. As a service to our customers we are providing this early version of the manuscript. The manuscript will undergo copyediting, typesetting, and review of the resulting proof before it is published in its final citable form. Please note that during the production process errors may be discovered which could affect the content, and all legal disclaimers that apply to the journal pertain.
References
- 1.Saiki RK, Gelfand DH, Stoffel S, Scharf SJ, Higuchi R, Horn GT, Mullis KB, Erlich HA. Science (New York, NY) 1988;239:487. doi: 10.1126/science.2448875. [DOI] [PubMed] [Google Scholar]
- 2.Nolan T, Hands RE, Bustin SA. Nature protocols. 2006;1:1559. doi: 10.1038/nprot.2006.236. [DOI] [PubMed] [Google Scholar]
- 3.Southern EM. Journal of molecular biology. 1975;98:503. doi: 10.1016/s0022-2836(75)80083-0. [DOI] [PubMed] [Google Scholar]
- 4.Alwine JC, Kemp DJ, Stark GR. Proc Natl Acad Sci U S A. 1977;74:5350. doi: 10.1073/pnas.74.12.5350. [DOI] [PMC free article] [PubMed] [Google Scholar]
- 5.Schena M, Shalon D, Davis RW, Brown PO. Science (New York, NY) 1995;270:467. doi: 10.1126/science.270.5235.467. [DOI] [PubMed] [Google Scholar]
- 6.Griffin JL. Current opinion in chemical biology. 2006;10:309. doi: 10.1016/j.cbpa.2006.06.027. [DOI] [PubMed] [Google Scholar]
- 7.Gibson G, Muse SV. In: A primer of genome science. Gibson G, Muse SV, editors. Sinauer Associates; 2004. p. 333. [Google Scholar]
- 8.Jayasena SD. Clin Chem. 1999;45:1628. [PubMed] [Google Scholar]
- 9.Tombelli S, Minunni M, Mascini M. Biosensors & bioelectronics. 2005;20:2424. doi: 10.1016/j.bios.2004.11.006. [DOI] [PubMed] [Google Scholar]
- 10.Navani NK, Li Y. Current opinion in chemical biology. 2006;10:272. doi: 10.1016/j.cbpa.2006.04.003. [DOI] [PubMed] [Google Scholar]
- 11.Zhou L, Ou LJ, Chu X, Shen GL, Yu RQ. Analytical chemistry. 2007;79:7492. doi: 10.1021/ac071059s. [DOI] [PubMed] [Google Scholar]
- 12.Lee SJ, Youn BS, Park JW, Niazi JH, Kim YS, Gu MB. Analytical chemistry. 2008;80:2867. doi: 10.1021/ac800050a. [DOI] [PubMed] [Google Scholar]
- 13.Zhang J, Wang L, Pan D, Song S, Boey FY, Zhang H, Fan C. Small. 2008;4:1196. doi: 10.1002/smll.200800057. [DOI] [PubMed] [Google Scholar]
- 14.Du Y, Li B, Wei H, Wang Y, Wang E. Analytical chemistry. 2008;80:5110. doi: 10.1021/ac800303c. [DOI] [PubMed] [Google Scholar]
- 15.Ellington AD, Szostak JW. Nature. 1990;346:818. doi: 10.1038/346818a0. [DOI] [PubMed] [Google Scholar]
- 16.Tuerk C, Gold L. Science (New York, NY) 1990;249:505. doi: 10.1126/science.2200121. [DOI] [PubMed] [Google Scholar]
- 17.Gold L, Polisky B, Uhlenbeck O, Yarus M. Annu Rev Biochem. 1995;64:763. doi: 10.1146/annurev.bi.64.070195.003555. [DOI] [PubMed] [Google Scholar]
- 18.Lee JF, Hesselberth JR, Meyers LA, Ellington AD. Nucleic Acids Res. 2004;32:D95. doi: 10.1093/nar/gkh094. [DOI] [PMC free article] [PubMed] [Google Scholar]
- 19.Jenison RD, Gill SC, Pardi A, Polisky B. Science (New York, NY) 1994;263:1425. doi: 10.1126/science.7510417. [DOI] [PubMed] [Google Scholar]
- 20.Lin Y, Qiu Q, Gill SC, Jayasena SD. Nucleic Acids Res. 1994;22:5229. doi: 10.1093/nar/22.24.5229. [DOI] [PMC free article] [PubMed] [Google Scholar]
- 21.Pieken WA, Olsen DB, Benseler F, Aurup H, Eckstein F. Science (New York, NY) 1991;253:314. doi: 10.1126/science.1857967. [DOI] [PubMed] [Google Scholar]
- 22.Jhaveri S, Rajendran M, Ellington AD. Nat Biotechnol. 2000;18:1293. doi: 10.1038/82414. [DOI] [PubMed] [Google Scholar]
- 23.Stojanovic MN, Kolpashchikov DM. Journal of the American Chemical Society. 2004;126:9266. doi: 10.1021/ja032013t. [DOI] [PubMed] [Google Scholar]
- 24.Nutiu R, Li Y. Methods (San Diego, Calif) 2005;37:16. doi: 10.1016/j.ymeth.2005.07.001. [DOI] [PubMed] [Google Scholar]
- 25.Stojanovic MN, de Prada P, Landry DW. Journal of the American Chemical Society. 2001;123:4928. doi: 10.1021/ja0038171. [DOI] [PubMed] [Google Scholar]
- 26.Wu ZS, Guo MM, Zhang SB, Chen CR, Jiang JH, Shen GL, Yu RQ. Analytical chemistry. 2007;79:2933. doi: 10.1021/ac0622936. [DOI] [PubMed] [Google Scholar]
- 27.Zuo X, Song S, Zhang J, Pan D, Wang L, Fan C. Journal of the American Chemical Society. 2007;129:1042. doi: 10.1021/ja067024b. [DOI] [PubMed] [Google Scholar]
- 28.Radi AE, O’Sullivan CK. Chem Commun (Camb) 2006:3432. doi: 10.1039/b606804a. [DOI] [PubMed] [Google Scholar]
- 29.Xiao Y, Piorek BD, Plaxco KW, Heeger AJ. Journal of the American Chemical Society. 2005;127:17990. doi: 10.1021/ja056555h. [DOI] [PubMed] [Google Scholar]
- 30.Bauer G, Suess B. J Biotechnol. 2006;124:4. doi: 10.1016/j.jbiotec.2005.12.006. [DOI] [PubMed] [Google Scholar]
- 31.Wang J, Jiang Y, Zhou C, Fang X. Analytical chemistry. 2005;77:3542. doi: 10.1021/ac050165w. [DOI] [PubMed] [Google Scholar]
- 32.Nutiu R, Li Y. Chemistry (Weinheim an der Bergstrasse, Germany) 2004;10:1868. doi: 10.1002/chem.200305470. [DOI] [PubMed] [Google Scholar]
- 33.Rankin CJ, Fuller EN, Hamor KH, Gabarra SA, Shields TP. Nucleosides Nucleotides Nucleic Acids. 2006;25:1407. doi: 10.1080/15257770600919084. [DOI] [PubMed] [Google Scholar]
- 34.Nutiu R, Li Y. Journal of the American Chemical Society. 2003;125:4771. doi: 10.1021/ja028962o. [DOI] [PubMed] [Google Scholar]
- 35.Nutiu R, Li Y. Angewandte Chemie (International ed) 2005;44:1061. doi: 10.1002/anie.200461848. [DOI] [PubMed] [Google Scholar]
- 36.Rajendran M, Ellington AD. Anal Bioanal Chem. 2008;390:1067. doi: 10.1007/s00216-007-1735-8. [DOI] [PubMed] [Google Scholar]
- 37.Bayer TS, Smolke CD. Nat Biotechnol. 2005;23:337. doi: 10.1038/nbt1069. [DOI] [PubMed] [Google Scholar]
- 38.Lynch SA, Desai SK, Sajja HK, Gallivan JP. Chem Biol. 2007;14:173. doi: 10.1016/j.chembiol.2006.12.008. [DOI] [PMC free article] [PubMed] [Google Scholar]
- 39.Yang L, Ellington AD. Anal Biochem. 2008 doi: 10.1016/j.ab.2008.05.018. [DOI] [PMC free article] [PubMed] [Google Scholar]
- 40.Shoemaker DD, Lashkari DA, Morris D, Mittmann M, Davis RW. Nat Genet. 1996;14:450. doi: 10.1038/ng1296-450. [DOI] [PubMed] [Google Scholar]
- 41.Giaever G, Chu AM, Ni L, Connelly C, Riles L, et al. Nature. 2002;418:387. doi: 10.1038/nature00935. [DOI] [PubMed] [Google Scholar]
- 42.Walton SP, Mindrinos MN, Davis RW. Biochem Biophys Res Commun. 2006;348:689. doi: 10.1016/j.bbrc.2006.07.108. [DOI] [PubMed] [Google Scholar]
- 43.Fredriksson S, Gullberg M, Jarvius J, Olsson C, Pietras K, Gustafsdottir SM, Ostman A, Landegren U. Nat Biotechnol. 2002;20:473. doi: 10.1038/nbt0502-473. [DOI] [PubMed] [Google Scholar]
- 44.Fischer NO, Tarasow TM, Tok JB. Anal Biochem. 2008;373:121. doi: 10.1016/j.ab.2007.09.035. [DOI] [PMC free article] [PubMed] [Google Scholar]
- 45.Zhang H, Wang Z, Li XF, Le XC. Angew Chem Int Ed Engl. 2006;45:1576. doi: 10.1002/anie.200503345. [DOI] [PubMed] [Google Scholar]
- 46.Walton SP, Stephanopoulos GN, Yarmush ML, Roth CM. Biophysical journal. 2002;82:366. doi: 10.1016/S0006-3495(02)75401-5. [DOI] [PMC free article] [PubMed] [Google Scholar]
- 47.Seetharaman S, Zivarts M, Sudarsan N, Breaker RR. Nat Biotechnol. 2001;19:336. doi: 10.1038/86723. [DOI] [PubMed] [Google Scholar]
- 48.Ogawa A, Maeda M. Bioorganic & medicinal chemistry letters. 2007;17:3156. doi: 10.1016/j.bmcl.2007.03.033. [DOI] [PubMed] [Google Scholar]
- 49.Sekella PT, Rueda D, Walter NG. Rna. 2002;8:1242. doi: 10.1017/s1355838202028066. [DOI] [PMC free article] [PubMed] [Google Scholar]
- 50.Ferapontova EE, Shipovskov S, Gorton L. Biosensors & bioelectronics. 2007;22:2508. doi: 10.1016/j.bios.2006.09.034. [DOI] [PubMed] [Google Scholar]
- 51.Saka K, Uemura K, Shintani-Ishida K, Yoshida K. J Chromatogr B Analyt Technol Biomed Life Sci. 2007;846:240. doi: 10.1016/j.jchromb.2006.09.008. [DOI] [PubMed] [Google Scholar]
- 52.Ferapontova EE, Olsen EM, Gothelf KV. Journal of the American Chemical Society. 2008;130:4256. doi: 10.1021/ja711326b. [DOI] [PubMed] [Google Scholar]
- 53.Hendeles L, Weinberger M, Johnson G. Clin Pharmacokinet. 1978;3:294. doi: 10.2165/00003088-197803040-00003. [DOI] [PubMed] [Google Scholar]
- 54.Mounie J, Richard L, Ribon B, Hersant J, Sarmini H, Houin G. Annales de biologie clinique. 1990;48:287. [PubMed] [Google Scholar]
- 55.Hall B, Hesselberth JR, Ellington AD. Biosensors & bioelectronics. 2007;22:1939. doi: 10.1016/j.bios.2006.08.019. [DOI] [PubMed] [Google Scholar]
- 56.Walton SP, Stephanopoulos GN, Yarmush ML, Roth CM. Biotechnol Bioeng. 1999;65:1. [PubMed] [Google Scholar]