Abstract
Teicoplanin (teic) from Actinoplanes teichomyceticus is a glycopeptide antibiotic used to treat many gram-positive bacterial infections. Glycopeptide antibiotics inhibit the bacteria growth by binding to carboxy-terminal D-Ala-D-Ala intermediates in the peptidoglycan of cell wall of gram positive bacteria. In this paper we report the derivatization of magnetic microspheres with teic (teic-microspheres). Fluorescence based techniques have been developed to analyze the binding properties of the microspheres to two D-Ala-D-Ala terminus peptides. The dissociation constants for the binding of carboxyfluorescein labeled D-Ala-D-Ala-D-Ala to teic on microspheres is established via fluorometry and flow cytometry and was determined to be 0.5 × 10⁻⁶ and 3.0 × 10⁻⁶ M, respectively. Feasibility of utilizing microparticles with fluorescence methods to detect low levels (limit of bacterial detection was determined to be 200 colony forming units [cfu]) of gram-positive bacteria has been demonstrated. A simple microfluidic experiment is reported to demonstrate the possibility of developing microsphere based affinity assays to study peptide-antibiotic interaction.
Keywords: bioanalytical methods, magnetic microspheres, teicoplanin, fluorescence, microfluidics
Introduction
Microsphere-based analysis, utilized in many biochemical studies, is advantageous as it provides for easy separation of bound complexes from unbound species without the use of sophisticated techniques and instrumentation. The presence of microspheres increase the surface area-to-volume ratio of the medium allowing for sample concentration, thereby, decreasing the limits of detection (LOD). Separations based on magnetic properties are common in biotechnology [1] reasons being the myriad of magnetic microspheres commercially available and the variety of diameters and surface chemistries possible [2]. The variety of chemistries is critical and provides options for facile immobilization of many biological receptors. Magnetic microspheres have been used in many biological applications including thermotherapy for cancer cells [3], immunoassays [4–6], cell separation [7–9], DNA hybridization [10], protein and peptide separation [2, 11] and pathogen detection [12, 13].
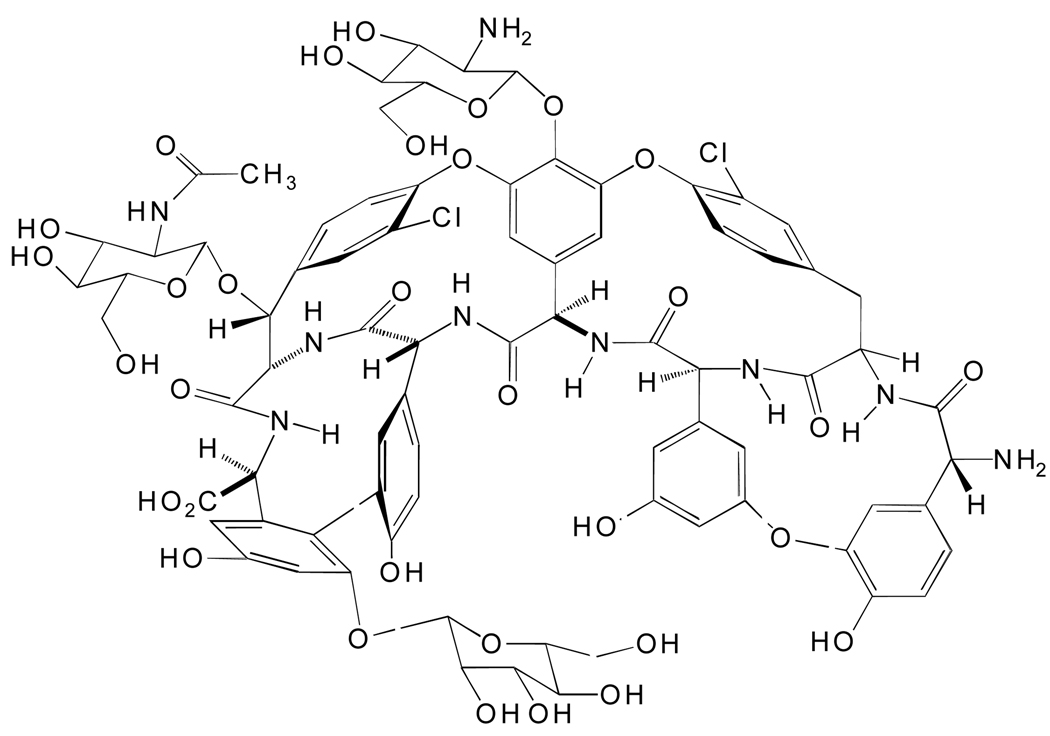
Glycopeptide antibiotics have been extensively used to treat bacterial infections. They inhibit the growth of gram positive bacteria by preventing the synthesis of the bacteria cell wall [14–16]. Vancomycin from Streptomyces orientalis has historically been used as the last option of treatment for many bacterial infections due to the increased resistance for many other types of antibiotic agents [12]. Teicoplanin (teic) from Actinoplanes teichomyceticus (Fig. 1) is a glycopeptide antibiotic of the vancomycin family [17, 18]. It binds to the D-Ala-D-Ala terminus on the cell wall of gram-positive bacterium via hydrogen bonds thereby preventing the enzyme mediated cross-linking of peptidoglycan and eventual cell death [13–15]. Although it is not routinely used in hospitals, teic is more active against Staphylococcus species than vancomycin including methicillin-resistant strains, has fewer side effects and exhibits a longer half-life in humans [17, 19–21]. The growth of resistance to antibacterial agents is an ever-increasing worldwide problem that threatens the chemical effectiveness of drugs used in the treatment of many infectious diseases. The development of new, fast and sensitive techniques to analyze bacteria-antibiotic interaction is important for several reasons. In the case of clinical testing low concentrations of bacteria require several time-consuming steps (incubation, enrichment and amplification). There is growing concern, that in the future, pathogens (foodborne, waterborne or airborne) will be used as weapons in terrorist activities. Hence, sensitive and instant detection of pathogens are warranted.
Fig. 1.
Structure of teicoplanin from Actinoplanes teicomyceticus.
The structure of teicoplanin, a glycopeptide antibiotic of the vancomycin family.
The development of novel microsphere-based methods to study the interaction of antibiotics with specific ligands complements current analytical techniques by providing an alternative technique to estimating affinity parameters between two species. Previous publications have detailed the use of magnetic particles to analyze antibiotic binding to bacteria. For example, Lin et al.[22] used MALDI-MS techniques to analyze the binding of three different gram-positive bacteria to vancomycin-tethered magnetic nanoparticles. The lowest concentration they could detect was ~ 7 × 10⁴ cfu/mL. Furthermore, Gu et al. [13] could detect 101–102 cfu/mL level of gram-positive and gram-negative bacteria using vancomycin tethered nanoparticles via optical microscopy and scanning electron microscopy.
Bioassays on a microfluidic format allow for rapid analysis with small reagent volumes which is important when expensive and/or hazardous compounds are involved. The integration of magnetic microspheres and fluorescent-based techniques in a microfluidic-based bioassay provides an opportunity to design and develop a variety of biosensors based on diverse biological interactions. Magnetic microspheres can be packed into microchannels using integrated or external permanent magnets or electromagnets. The absence of pillars or dam-like structures to hold microspheres make construction of the device simple and sophisticated microfabrication tools not necessary. If external magnets are used, it enables to release packed microspheres by simply removing the magnetic field ensuring these devices are reusable.
Herein, we detail a fluorescent-based magnetic microsphere method to examine the binding of D-Ala-D-Ala terminus peptides, analogous to that found on the bacteria cell wall, to the antibiotic teic. We employ two techniques, flow cytometry and fluorometry for the evaluation. We first demonstrate the concept by using a model peptide that can mimic the antibiotic binding site of gram-positive bacteria. The peptide D-Ala-D-Ala-D-Ala labeled with 5-carboxyfluorescein (5-FAM(DA)3) (1) used as the model peptide. Stapylococcus aureus binding to magnetic microspheres at ultra-low concentrations, is demonstrated via fluorometry. Finally, we explore the feasibility of developing a microfluidic chip to investigate the binding of teic to 1 using a microcolumn packed with teic-coated magnetic microspheres. These techniques have the potential to be complimentary to traditional fluorometric assays with the advantage of low sample requirements.
Experimental
Materials
Carboxylic group terminated Dynal® magnetic microspheres (~2.7 µm diameter) were purchased from Invitrogen (Carlsbad, CA). Teicoplanin-HCl was purchased from Advanced Separation Technologies (Whippany, NJ) and used without any further purification. 5-FAM(DA)3 (1) was custom synthesized by Anaspec (San Jose, CA). N’α, N’’ε-diacetyl-lys-D-Ala-D-Ala (NNL(DA)2) (2), D-Ala-D-Ala (3) and N-(3-dimethylaminopropyl)-N’-ethylcarbodiimide hydrochloride (EDC) were purchased from Sigma (St. Louis, MO). Rare earth magnets were purchased from K&J Magnetics (Jamison, PA).
Instrumentation
Fluorescence based methods have been employed to study the interaction of teicoplanin derivatized microspheres with model peptides and bacteria.
Fluorometry
Indirect methods were employed to analyze the binding of model peptides and bacteria to teic-microspheres in suspensions, using a Fluoromax-3 (Horiba Jobin Yvon, Edison, NJ) spectrophotometer. All the measurements were performed at fixed wavelength mode (λexc = 488 nm, λemis = 520 nm). Neutral density filters were used when required.
Flow Cytometry
Flow cytometry was used to analyze peptide binding via directly measuring the bound complexes. The flow cytometric analysis used a Becton-Dickinson FACScan flow cytometer (Sunnyvale, CA) equipped with an argon ion laser (λexc = 488 nm).
Fluorescence Microscopy
A simple microfluidic binding assay was performed to demonstrate the proof-of-concept using an inverted epi-fluorescence microscope (NIKON Eclipse-2000U) equipped with a photon counter (Hamamatsu, Tokyo, Japan). The 20 X objective lens was used to focus the exciting and emission lights.
Procedures
Derivatization of magnetic microspheres with antibiotics
Carboxylic acid terminated magnetic beads were derivatized with teic (teic-microspheres). A solution (100 µL) of magnetic microspheres from a stock solution (2×10⁹ beads/mL) was taken into a micro-centrifuge tube and a rare earth magnet was used externally to the tube to separate the microspheres from the solution. The supernatant was discarded and the microspheres were washed (5X) with 2-(N-morpholino) ethanesulfonic acid (MES) buffer (25 mM, pH 5). A solution (60 µL) of teic (10 mg/mL) in MES (25 mM, pH 5) was added to the microspheres and incubated for 30 minutes. A solution (30 µL) of freshly prepared EDC solution (100 mg/mL in cold water) and MES buffer (10 µL) were added to the bead solution. The mixture was incubated (6 hr) at room temperature with slight shaking. The solution was discarded and microspheres were suspended in Tris (50 mM, pH 7.4) buffer for 15 min. Microspheres were washed with PBS (100 mM, pH 7.4, 150 mM NaCl, 0.1% BSA) (5X) and then resuspended in PBS (1 mL) (100 mM, pH 7.4, 150 mM NaCl). A hemocytometer count gave the final microspheres count as 1.1 × 10⁸ microspheres /mL.
Fabrication of microfluidic chip
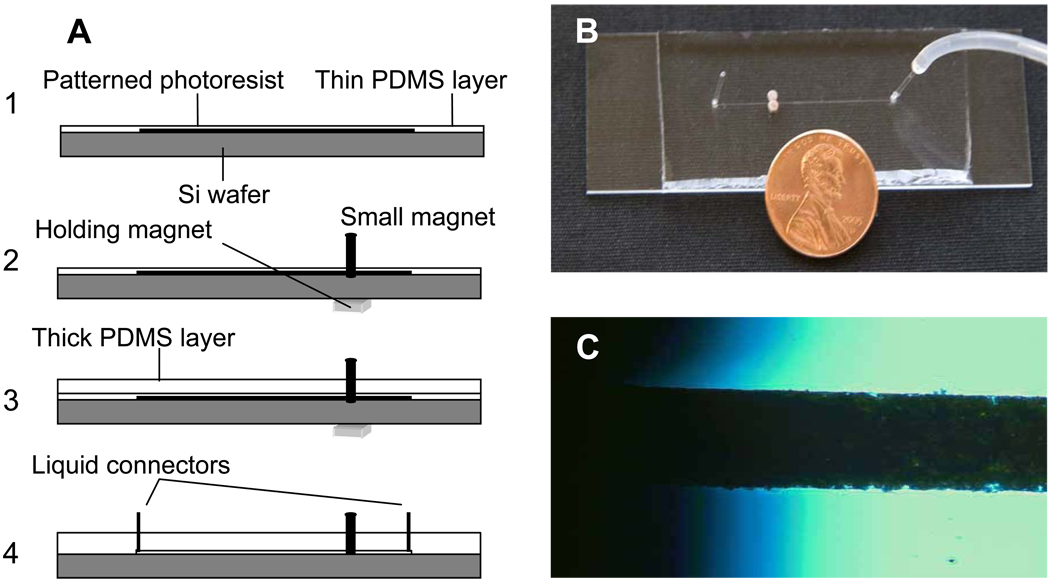
A microfluidic chip (Fig 2a) containing a single straight microchannel (length 1.8 cm, width 200 µm, height 60 µm) was prepared by using conventional soft lithographic techniques. Briefly, a mold was created on a 3” silicon wafer using photolithography [23]. A solution (2 mL) of degassed PDMS pre-polymer was spin coated onto the mold at 3000 rpm for 30 seconds to obtain a thin layer (~ 30 µm) of PDMS. The sample was baked for 15 min at 70 °C. Two 2 mm diameter cylindrical rare earth magnets (NdFeB type, 0.21 lb pull force) were aligned tangentially to the microchannel (Fig. 2c) with the help of a 1 × 1 cm square shaped rare earth magnet (holding magnet) which is placed underneath of the wafer (Fig. 2a). Degassed PDMS pre-polymer solution was poured onto the assembly and baked for 2 hr at 70 °C to obtain a thicker layer of PDMS on top of the previously formed thin layer. The holding magnet is helpful to keep two cylindrical magnets in place during the pouring and baking of PDMS. The combined PDMS layers were peeled off from the wafer. Holes were punched at either end of the microchannel for the liquid connections. The PDMS chip was irreversibly sealed onto a glass slide (Fig. 2b) using an argon plasma [23].
Fig. 2.
Fabrication of the microfluidic chip. (a). Steps involved in preparing rare-earth magnets embedded PDMS chip. (b). Image of final device with a sketch showing the enlarged view of alignment of the magnets.
Fabrication of the microfluidic chip. A. Steps involved in preparing rare-earth magnets embedded PDMS chip. B. Image of final device. C. Optical micrograph of a magnetic bead-packed microchannel. Shaded areas are where the magnets are embedded.
Preparation of bacteria
Staphylococcus aureus (S. aureus) strain RN4220 was obtained from the laboratory of Richard Novick [24]. Four to five S. aureus colonies from a freshly streaked Luria-Bertani (LB) agar plate were inoculated into LB broth in an Erlenmeyer flask and grown for approximately 2 hours at 37 °C. The culture was centrifuged at 6000 rpm for 30 min. The supernatant was removed and the pellet was resuspended in PBS (pH 7.4, 137 mM NaCl, 2.7 mM KCl). The optical density of the culture in PBS was measured at 600 nm (OD600). The culture was then serially diluted in PBS from 10−4 to 10−8 OD600 and the diluted cell suspensions were used in the bead-binding assays. The cfu of live S. aureus cell suspensions were determined by plating 10-fold serially diluted samples (100 µL) onto three replicates of LB agar plates. After an overnight incubation at 37 °C cfu of each plate was counted and cfu/mL for the original cell suspensions was calculated.
Suspension-based binding assays via fluorometry
A suspension based method combined with fluorometry was utilized to analyze the binding of labeled peptide to teic- microspheres. The binding of 1 was measured via the decrease in fluorescence intensity of supernatant peptide solution. Intensity measurements were performed in constant wavelength mode. Samples containing ~2.2 × 10⁶ microspheres (teic-microspheres and non derivatized microspheres) were incubated at room temperature in different concentrations (3.2–31.5 µM, depending on the type of experiment) of 1 (160 µL) in Eppendorf tubes with slight shaking. The microspheres were separated from the solution using an external magnet. The supernatant 1 was measured for its fluorescence intensity.
1. Analysis of reactivity of teic-microspheres
To determine the reactivity of derivatized microspheres, 1, (5 nM) was incubated with teic-microspheres. The decrease in fluorescence intensity was monitored at different time intervals (0–30 min).
2. Stability studies of derivatized microspheres
Teic-microspheres were generally stored in PBS (100 mM, pH 7.4, 150 mM NaCl) at 5°C for long term use. The stability of derivatized microspheres was periodically monitored for one month by measuring the reactivity of a stock solution (5 nM) of 1.
3. Determination of 1-teic complex density on microspheres
Fluorometry was used to determine the number of available binding sites on derivatized microspheres. A sample containing approximately 2.2 × 10⁶ microspheres/mL was incubated with different concentrations (0.1– 100 µM) of 1 in Eppendorf tubes for 15 min. The supernatant intensities of the reacted peptides were measured as previously described.
4. Equilibrium binding of 1 with teic-microspheres
Fluorometric and flow cytometric techniques were employed to study the equilibrium binding kinetics of 1 with teic bearing microspheres. In fluorometric studies, Suspensions of teic-microspheres (2.2 × 10⁶) were reacted with solutions of 1 with different concentrations (3.6 nM – 31.6 µM) for 15 min. Analyses were performed as previously described.
5. Competitive binding of similar peptides with teic-microspheres
Two unlabeled peptides mixed with 1 were used to show the different affinities of three closely similar peptides towards teic. A solution (80 µL) of 2 and 3 (0 nM-0.5 µM) was separately mixed with a solution (80 µL, 10 nM) of 1. Binding of 1 in the mixture with ~2.2 × 10⁶ derivatized microspheres was measured as before.
Equilibrium binding studies via flow cytometry
Equilbrium binding of 1 with teic-microspheres was performed also with flow cytometry. ~2.2 × 10⁶ of microspheres incubated with different concentrations (1 nM – 1 mM) of labeled peptide solutions (160 µL) for 15 min. The microsphere samples were washed (3X) with PBS buffer and re-suspended in 0.5 mL for flow cytometry analysis. Ten thousand events were recorded for each analysis. The sensitivity of the flow cytometer was adjusted so that the auto fluorescence of the non-derivatized beads was at the very low end of the scale.
Binding analysis via microfluidics
1. Bead packing
A microchannel was placed on the sample stage of an epi-fluorescence microscope and secured using specimen clips. A peristaltic pump, connected to the microchannel via a silicon tubing (0.64 mm I.D.), was used to introduce microspheres and reagents into the microfluidic chip. The microchannel was first rinsed with PBS buffer containing 0.1 % BSA to minimize non-specific binding of compounds to the PDMS surface. The microchannel was filled with PBS buffer and 5 µL of derivatized microspheres (1.1 × 10⁸ beads/mL) was withdrawn into the silicone tubing using a peristaltic pump. Microsphere filled silicone tubing was connected to the microchannel and a continuous flow of buffer was maintained via the peristaltic pump. The microspheres accumulated at the two magnets. The packed microsphere segment was aligned and focused with the 20X objective lens of the microscope. The packed segment was rinsed (5 min) with PBS buffer.
2. Sample injection and detection in the chip
The peristaltic pump was stopped and the silicone tubing containing the running buffer at the inlet end was removed from the microfluidic chip. A 5 µL plug of 1 (10 µM) was withdrawn into the tube and re-connected to the microchannel. The sample plug was manipulated through the microfluidic channel at a rate of 0.4 µL/min using the peristaltic pump. The fluorescence intensity was monitored at the microsphere segment periodically via a photon counter attached to the microscope. The monitoring was started before the injection of the sample plug. When the labeled compound reached the microsphere packed segment, the flow was stopped for 10 min for incubation. The flow was restarted to remove excess compound from the microchannel while monitoring the fluorescent intensity periodically. Control experiments were performed with 1 (10 µM) and non-derivatized microspheres.
Bacteria binding to teic-beads
A suspension based method was employed for the assay. A solution (160 µL) containing a non-pathogenic strain of S. aureus was incubated with teic-microspheres (~ 2×10⁶) for 30 min at room temperature. Microspheres were separated from the bacteria solution and re-incubated with 1 (5 nM). The fluorescent intensity of the supernatant 1 was measured after 5 min. A control experiment was performed by incubating teic-microspheres with 1 (160 µL, 5 nM). Another control was performed with non-derivatized microspheres incubated in bacteria and subsequently with 1 (160 µL, 5 nM) to monitor non-specific binding of reagents to microspheres.
Results and discussion
Derivatization of magnetic beads with antibiotics
The primary amine on the peptide backbone in teic (Fig. 1a) can be coupled to carboxylic acid groups on the surface of the magnetic microspheres via amide bonding mediated by carbodiimide activation. Although self-polymerization of teic is possible due to the terminal carboxylic group, we compensated this by adding excess of teic. Since magnetic microspheres can be easily separated from the reactant solutions, excess reagents can be removed by thoroughly rinsing the microspheres. By incubating derivatized microspheres with Tris buffer, unreacted activated carboxylic acid groups are quenched. Derivatized microspheres were rinsed with PBS buffer containing 0.1% BSA to minimize the non-specific binding of peptides. For long term storage, microspheres were suspended in a known volume of PBS buffer and kept at 5 °C. Derivatized microsphere concentration was calculated by hemocytometer counting.
Suspension assays of fluorescent peptide binding to teic-microspheres
1. Reactivity of drivatized microspheres
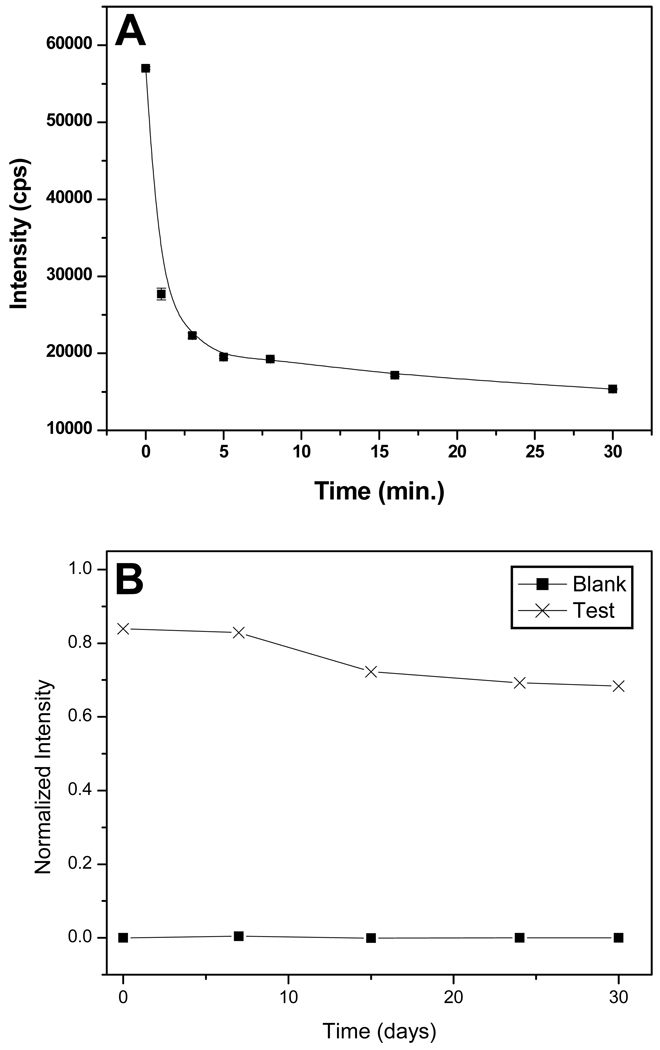
Direct monitoring of fluorescent particles in fluorometry can lead to erroneous results due to the scattering effects from the particles themselves. In such a situation, indirect methods can be used to monitor the binding of fluorescent ligands to receptors on microspheres. When a solution of 1 is incubated with teic-microspheres, the binding of fluorescent peptide (ligand) to teic-microsphere (receptor) can be monitored via the decrease in fluorescence intensity of the solution. Microspheres can be separated using an external magnet thus supernatant can be measured without any interference. Only a few milliseconds is required for equilibrium to be established between teic and D-Ala-D-Ala peptides in solution [25]. Fig. 3a shows direct monitoring of binding interactions between labeled ligand and receptors on microspheres. The initial intensity of the supernatant is decreased by 50% within the first minute indicative of the microspheres’ reactivity. After approximately 10 min the change in decrease in intensity is not significant and an overall decrease of 73% is reached after 30 min of incubation.
Fig. 3.
Fluorometric studies of reactivity and stability of magnetic microspheres derivatized with teic. (a). Reactivity of teic- microspheres were analyzed by monitoring the change in fluorescence intensity of supernatant 1. (b). Stability of derivatized microspheres were analyzed by monitoring the reactivity of microspheres for one month.
Spectrofluorometric studies of reactivity and stability of magnetic microspheres derivatized with teicoplanin. A. Reactivity of teic-microspheres were analyzed by monitoring the change in fluorescence intensity of supernatant 5-FAM(DA)3. B. Stability of derivatized microspheres were analyzed by monitoring the reactivity of microspheres for one month.
2. The stability of teic coated microspheres
The long shelf-life of derivatized microspheres enables the continuous use of a batch of microspheres for many assays without repetitive preparations. Fig. 3b demonstrates that the microspheres are reasonably stable even after one month. The measured supernatant intensity of reacted 1 was normalized to the intensity of the un-reacted peptide in solution, each day using the eq. (1). In eq. (1), I0 and It are fluorescence intensities of 1 before and after reacting with teic-microspheres, respectively.
| (1) |
The reactivity of teic-microspheres decreased by 13–15% after the first week. This decrease may be attributed to the dissociation of some teic molecules from the surface of the microsphere.
3. Determination of 1-teic complex density on microspheres
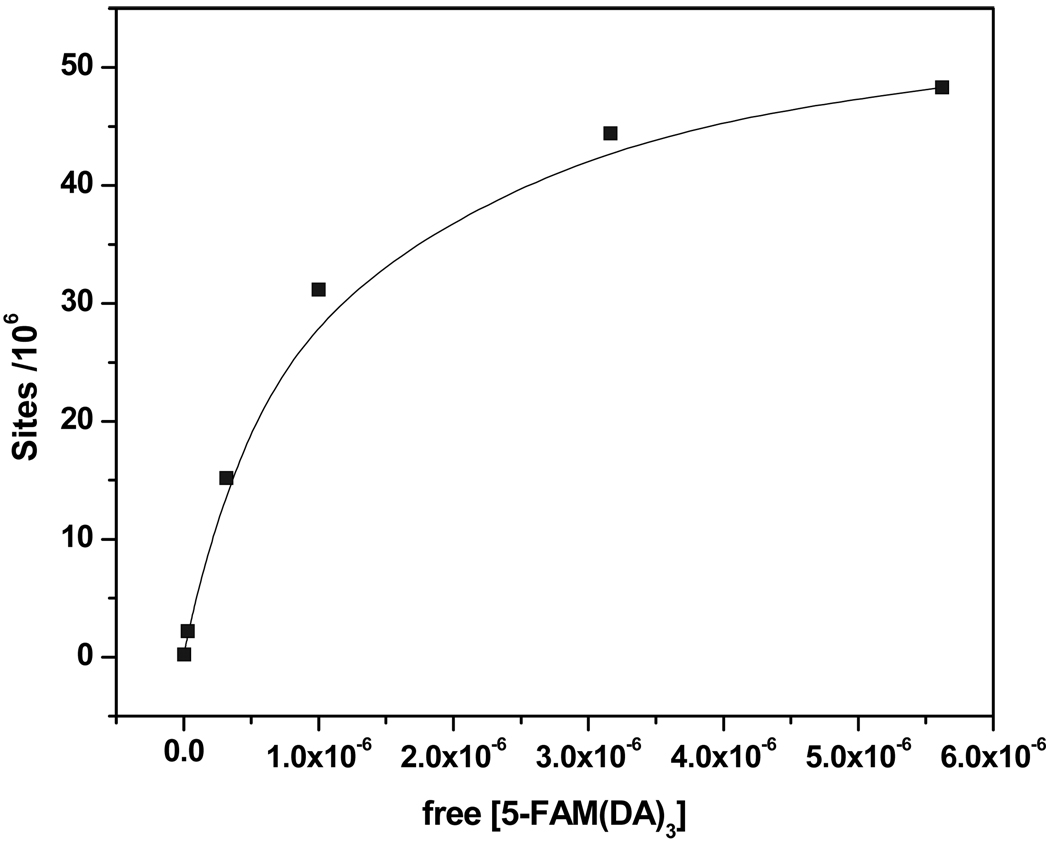
A suspension-based method was employed to obtain maximum density of bound complexes using fluorometry. The concentration of 1 was varied while maintaining the amount of microspheres constant (Fig. 4). The measured intensities for this particular analysis were used to determine the concentration of available teic sites ([Lb]) associated with microspheres as shown in eq. (2). In eq. (2), [L]0 is the initial concentration of peptide. The number of 1 molecules per microsphere at a particular initial concentration was calculated using eq. (3). Here, A and n are Avagadro’s number and concentration of microspheres, respectively.
| (2) |
| (3) |
The analysis gave an approximate value of available binding sites on microspheres of about 50 million.
Fig. 4.
Graph of binding sites versus free 1. Number of available binding sites on microspheres was calculated using eq. (2) coverage of binding sites per bead. Data suggest ~50 × 106 available binding sites per microsphere.
Graph of number of receptor sites vs free 5-FAM(DA)3. Number of receptor sites on microspheres was calculated using equation (2) to obtain the maximum surface coverage of binding sites per microsphere. Data suggest ~50 × 106 available binding sites per microsphere.
Equilibrium binding studies via fluorometry and flow cytometry
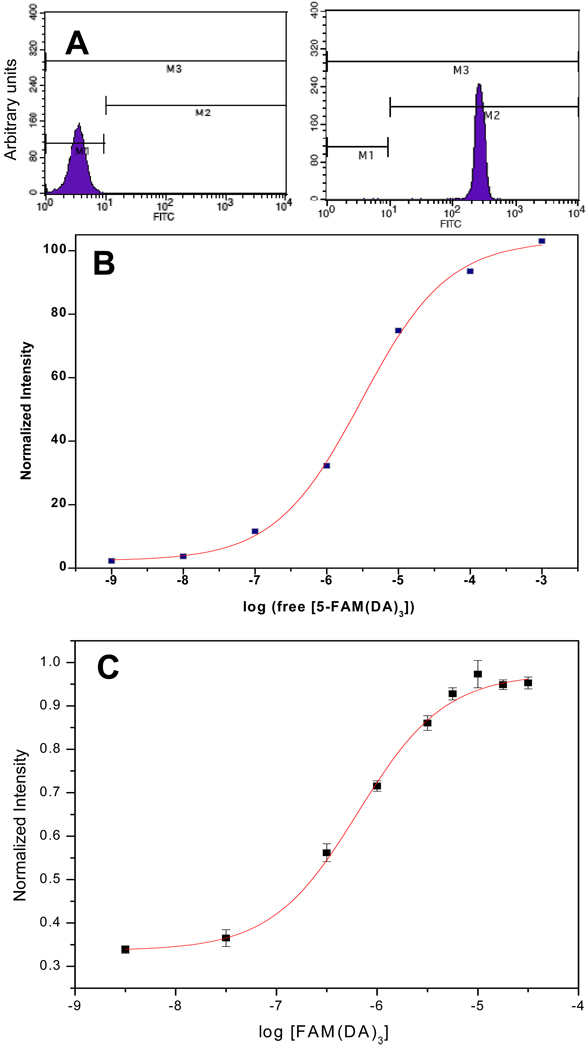
The equilibrium binding of 1 to teic was analyzed using fluorometry and flow cytometry. The fluorescence intensities from fluorometric measurements were normalized according to eq. (1). For flow cytometry, a total of 10,000 events were considered. Mean value of histogram for each concentration was used for calculation. The numbers along the x- axis in each flow cytometry histogram (Fig. 5a) represent the means of the histograms. The y-axis represents the number of events. The degree of intensity increases along the x-axis. Two histograms in Fig. 5a represent two extremes of concentrations of 1 used. It has been shown elsewhere that the mean of the flow cytometry histogram is the quantity relevant to binding capacity [25]. Mean values were normalized according to eq. (4). Here It is the intensity of teic-microspheres after
| (4) |
reacting with 1 and I0 is the original intensity of teic-microsphers. We assumed the peptide-teic binding as a cooperative binding interaction and equilibrium binding data from fluorometry and flow cytometry were analyzed as sigmoidal dose-response curves using Origin-7 data analysis and graphing software (OriginLab, Northampton, MA). The derived dissociation constants (Kd) from mid points of the sigmoidal curves are 3 µM (flow cytometry, Fig. 5b) and 0.5 µM (fluorometry, Fig 5c). . The micromolar range dissociation constants suggest the binding of peptides to the teic-bead is not strong and a weak binding ligand can be replaced by a strong binding ligand. The lower Kd value for suspension based analysis are due the minimal effect from dissociation of bound complexes during the analysis. There is a greater possibility of dissociating some of the bound complexes during the rinsing of microspheres prior to flow cytometric analysis resulting in a higher value for Kd. Overall these values are in close agreement with the Kd (2 µM) that is obtained from solution based homogeneous experiments by capillary electrophoresis [26].
Fig. 5.
Equilibrium binding of 1 with teic- microspheres. (a). Mean value of each histogram for different concentration was used for flow cytometric analysis. (b). Sigmoidal dose-response analysis of flow cytometric data. A Kd of ~ 3.04 × 10⁻⁶ M was derived from the equilibrium binding curve. (c). Sigmoidal analysis of fluorometric data. A Kd of ~ 0.5 × 10⁻⁶ M was derived from the equilibrium binding curve.
Equilibrium binding of 5-FAM(DA)3 with teic-microspheres. A. Mean value of each histogram for different concentration was used for flow cytometric analysis. B. Sigmoidal dose-response analysis of flow cytometric data. A Kd of ~ 3.04 × 10⁻⁶ M was derived from the equilibrium binding curve. C. Sigmoidal dose-response analysis of spectrofluorometric data. A Kd of ~ 0.5 × 10⁻⁶ M was derived from the equilibrium binding curve.
4. Competitive binding of similar peptides with teic-microspheres
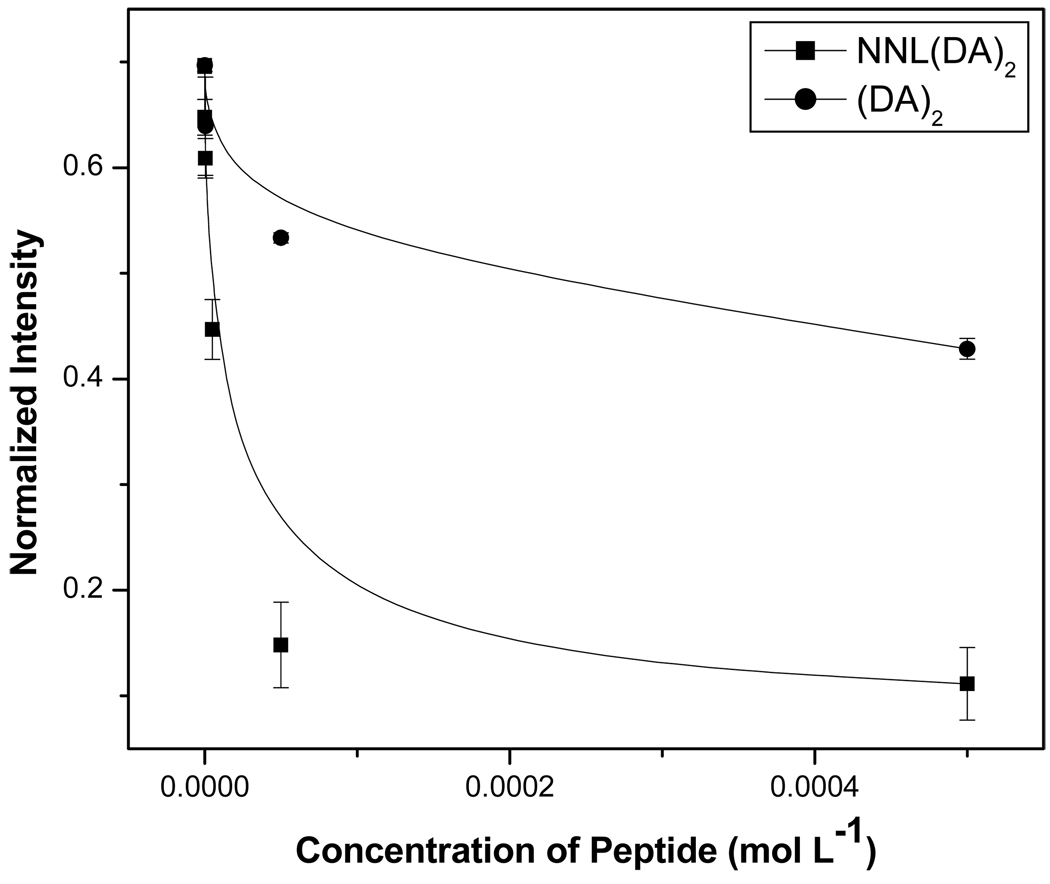
Certain varieties of D-alanine (and glycine) containing peptides can have different affinities towards teic due to the differences in electrostatic interaction. One of the reasons for these differences in affinity is due to the change in the number of hydrogen bonds formed between the peptide and the antibiotic [27]. As a proof-of-concept study to demonstrate the feasibility of using teic-microspheres for competitive and affinity studies of similar peptides, we chose unlabeled 3 and 2 along with 5 nM of 1. Normalized intensity, as described in eq. (1), was used to demonstrate the different affinities of 2 and 3 towards teic (Fig. 6). The derived data were also used to show the competitive binding of 1 with teic-microspheres in the presence of two similar peptides. According to the expression in eq. (1), the graph shows the degree of binding of 1 in the presence of two competing peptides. It is apparent that the fluorescent peptide binds more favorably at low concentrations of two competing peptides. Even at higher concentrations of 3 the binding of 1 is still greater indicating the strong interaction of teic-microspheres with the fluorescent peptide. This binding is mainly due to the presence of an extra hydrogen bond between 1 and teic [27]. In the case of 2 the binding of fluorescent peptide is weaker at higher concentration of competing peptide. Both peptides have the same number of hydrogen bonds with teic on the microspheres but the bulkiness of the fluorescent tag can cause weaker binding. Further studies are needed to confirm this hypothesis.
Fig. 6.
Competitive binding of 1 with structurally similar peptides.
Competitive binding of 5-FAM(DA)3 with structurally similar peptides, NNL(DA)2 and (DA)2.
Microfluidics
Microfabrication of microfluidic chips
Magnetic beads were captured by embedding two small rare earth magnets in PDMS externally to the microchannel. In unpublished work, we found that the thickness of the PDMS layer between a magnet and magnetic object can affect the strength of the magnetic field from the magnet thus affecting the capture of beads. We could securely embed two magnets while minimizing the distance to the microchannel by first creating a thin layer of PDMS on the photoresist mold (Fig. 2b) followed by alignment of the magnets and finally creating a thick layer of PDMS to make a more rigid device.
Microfluidic assays on peptide - teic binding
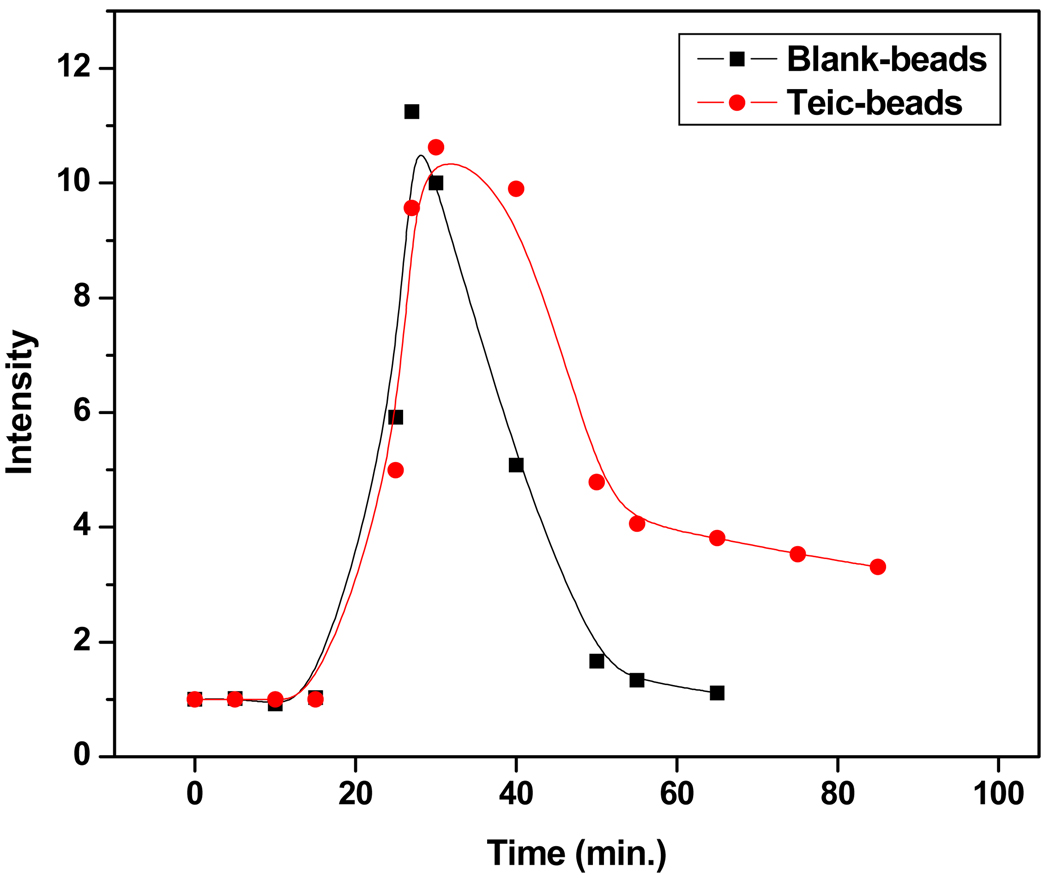
A simple microfluidic experiment was performed to demonstrate the binding of 1 (10 µm) to teic-bearing beads in a microchip. Beads were confined to a region of approximately 800 µm in length. The collection of data was started 15 min prior to the sample injection (Fig. 7). The labeled peptide was injected at 15 min. Due to the dead volume between the injection point and the packed segment, the frontal end of the plug of 1 took approximately two min. to reach the microsphere segment. The flow was stopped at 17 min. to allow microspheres to incubate with the peptide. The initial increase in fluorescent intensities shown as peaks in red and black traces in Fig. 7 are due to the presence of excess labeled peptides in the system. The microspheres were incubated for 10 min at zero flow conditions (17–27 min.) and then re-started to remove excess peptides from the system. The sharp decrease in intensity is indicative of the removal of excess peptides. The more stable fluorescent intensity after 50 min (in red) is indicative of the presence of 1 bound to teic- microspheres. The gradual decrease in intensity from 55 min to the end of the curve is mainly due to the dissociation of bound 1. In the negative control experiment with non-derivatized magnetic microspheres (black trace in Fig. 7) the absence of retention of fluorescent intensity at the microsphere segment is indicative of the non-binding of fluorescent peptides to the non-derivatized microspheres. This simple microfluidic experiment demonstrates that microsphere-based methods can be developed in a microfluidic format to analyze antibiotic-peptide interactions. The major limitation is the weak binding of peptides to teic on microspheres, causing many initially bound complexes to dissociate during washing steps, thus decreasing the sensitivity and increasing the limit of detection.
Fig. 7.
Analysis of 1 binding to magnetic microspheres packed in microfluidic channels. The slow decrease in fluorescence intensity (red trace) is indicative of binding of fluorescent peptides to teic- microspheres, where as rapid decrease in intensity (black trace) is indicative of the non-binding of fluorescent peptides to non-derivatized microspheres.
Analysis of 5-FAM(DA)3 binding to magnetic microspheres packed in microfluidic channels. The slow decrease in fluorescence intensity in red trace indicative of binding of fluorescent ligand to teic-microspheres where as rapid decrease in intensity in black trace indicative of the non binding of fluorescent ligand to non-derivatized microspheres.
Bacteria binding to the teic-beads
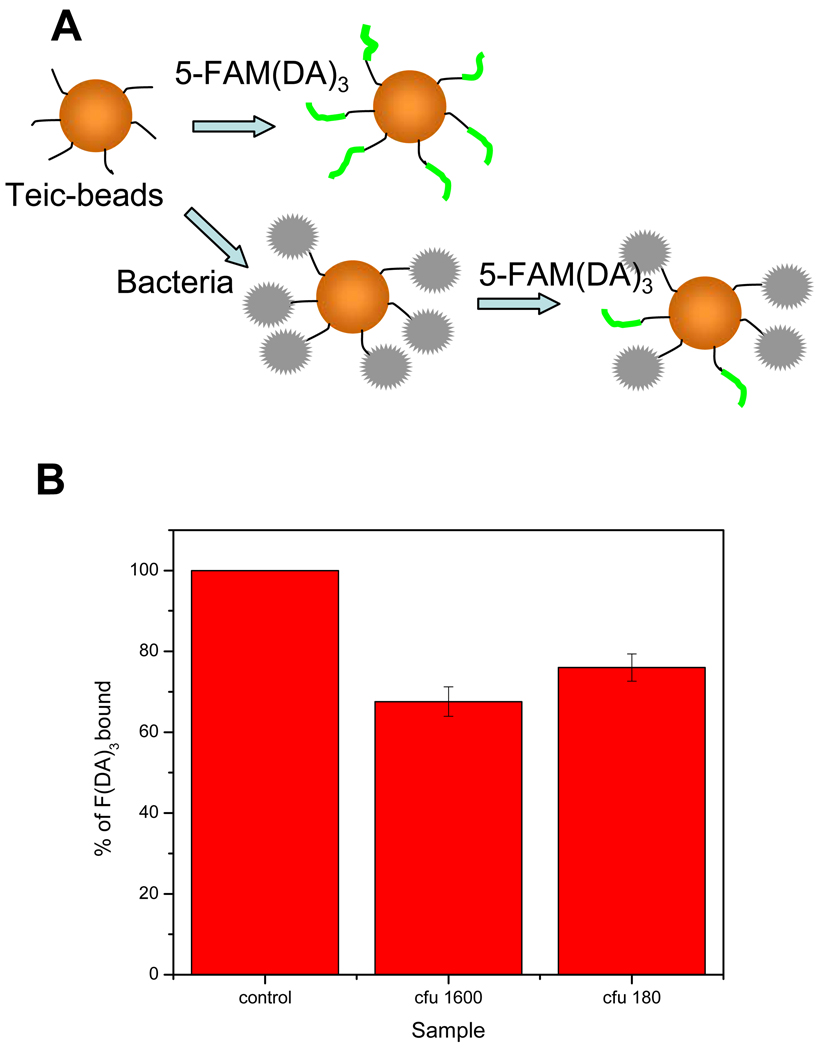
The binding of bacteria to teic-microspheres was monitored via fluorometry. When a known amount of teic- microspheres is incubated with a sample of S. aureus prior to incubation with 1, if the bacteria binds to the microsphere bound teic, the number of receptors on the microspheres able to bind to 1 will be decreased (Fig. 8a). The bacteria binding can be observed indirectly by monitoring the degree of labeled peptide binding. In Fig. 8b, normalized intensity (eq. (1)) of control is taken as 100 % binding of 5-FAM(DA)3 to teic-microspheres and compared with normalized intensities for samples containing teic-microspheres that were pre-incubated with different concentrations of bacteria prior to reacting with 1. Each analysis was done in triplicate. A portion of each solution was analyzed by the colony counting method to determine the concentration of bacteria. The limit of detection of S. aureus in said method was approximately 200 cfu. We could not detect bacteria for samples below 180 cfu. This observation may be mainly due to the strong attraction towards 1 which can replace the low amount of bound bacteria from microspheres. This can be avoided by choosing a suitable labeled peptide with comparative affinities as bacteria.
Fig. 8.
Gram-positive bacteria binding to teic-bearing magnetic microspheres. (a). Schematic diagram showing the basis of bound bacteria determination. Teic-microspheres will be incubated with 1 in control. Teic- microspheres will be incubated with bacteria first and then with 1 for test samples. (b). Degree of bacteria binding is determined by the percentage of fluorescence decrease compared to the control.
Gram positive bacteria binding to teicoplanin bearing magnetic beads. A. Schematic diagram showing the basis of bound bacteria determination. Teic-beads will be incubated with 5-FAM(DA)3 in control. Teic-beads will be incubated with bacteria first and then with 5-FAM(DA)3 for test samples. B. Degree of bacteria binding is determined by the percentage of fluorescence decrease with comparison to control.
Conclusion
Magnetic particles have been derivatized with the antibiotic teicoplanin and its binding to D-Ala-D-Ala terminus peptides has been described. The values for the dissociation constants for 1 obtained by fluorometry and flow cytometry are similar and comparable to known values for similar peptides obtained from other techniques. In addition, a particle-based system was employed to detect low levels of bacteria avoiding time consuming steps used in conventional techniques. The concept we demonstrate here is simple and the detection is quick in comparison to conventional methods where many steps are involved in sample perparation. We believe this approach can be further utilized in developing new types of biosensors for pathogen detection. Further work will focus on examining tighter receptor-ligand binding models and or using other fluorescence based techniques.
Acknowledgements
The authors gratefully acknowledge financial support for this research by grants from the National Science Foundation (CHE-0515363, CBET-0723271, DMR-0351848 and DMR-0520565), and the National Institutes of Health (1R15AI65468-01).
References
- 1.Bucak S, Jones DA, Laibinis PE, Hatton TA. Biotech Prog. 2003;19:477–484. doi: 10.1021/bp0200853. [DOI] [PubMed] [Google Scholar]
- 2. www.invitrogen.com/dynal.
- 3.Jordan A, Scholz R, Maier-Hauff K, van Landeghem F, Waldoefner N, Teichgraeber U, Pinkernelle J, Bruhn H, Neumann F, Thiesen B, von Deimling A, Felix R. J Neuro-Oncology. 2006;78:7–14. doi: 10.1007/s11060-005-9059-z. [DOI] [PubMed] [Google Scholar]
- 4.Richardson J, Hawkins P, Luxton R. Biosens Bioelect. 2001;16:989–993. doi: 10.1016/s0956-5663(01)00201-9. [DOI] [PubMed] [Google Scholar]
- 5.Hayes MA, Polson NA, Phayre AN, Garcia AA. Anal Chem. 2001;73:5896–5902. doi: 10.1021/ac0104680. [DOI] [PubMed] [Google Scholar]
- 6.Choi KWO, Thomas JH, Heineman WR, Halsall HB, Nevin JH, Helmicki AJ, Henderson T, Ahn CH. Lab Chip. 2001;2:27–30. doi: 10.1039/b107540n. [DOI] [PubMed] [Google Scholar]
- 7.Georgieva J, Milling A, Orfanos CE, Geilen CC. Melanoma Res. 2002;12:309–317. doi: 10.1097/00008390-200208000-00002. [DOI] [PubMed] [Google Scholar]
- 8.Lea T, Vartdal F, Davies C, Ugelstad J. Scand J Immun. 1985;22:207–216. doi: 10.1111/j.1365-3083.1985.tb01873.x. [DOI] [PubMed] [Google Scholar]
- 9.Treleaven JG, Ugelstad J, Philip T, Gibson FM, Rembaum A, Caine GD, Kemshead JT. The Lancet. 1984;323:70–73. doi: 10.1016/s0140-6736(84)90004-7. [DOI] [PubMed] [Google Scholar]
- 10.Fan ZH, Mangru S, Granzow R, Heaney P, Ho W, Dong Q, Kumar R. Anal Chem. 1999;71:4851–4859. doi: 10.1021/ac9902190. [DOI] [PubMed] [Google Scholar]
- 11.Safarik I, Safarikova M. BioMag Res Tech. 2004;2:7. doi: 10.1186/1477-044X-2-7. [DOI] [PMC free article] [PubMed] [Google Scholar]
- 12.Jenkins C, Pearce MC, Smith AW, Knight HI, Shaw DJ, Cheasty T, Foster G, Gunn GJ, Dougan G, Smith HR, Frankel G. Let App Micro. 2003;37:207–212. doi: 10.1046/j.1472-765x.2003.01379.x. [DOI] [PubMed] [Google Scholar]
- 13.Gu H, Ho PL, Tsang KWT, Wang L, Xu B. J Am Chem Soc. 2003;125:15702–15703. doi: 10.1021/ja0359310. [DOI] [PubMed] [Google Scholar]
- 14.Kahne D, Leimkuhler C, Lu W, Walsh C. Chem Rev. 2005;105:425–448. doi: 10.1021/cr030103a. [DOI] [PubMed] [Google Scholar]
- 15.Loll PJ, Axelsen PH. Ann Rev Biophys Biomol Struct. 2000;29:265–289. doi: 10.1146/annurev.biophys.29.1.265. [DOI] [PubMed] [Google Scholar]
- 16.Williams DH, Bardsley B. Angew Chem Int Ed. 1999;38:1172–1193. doi: 10.1002/(SICI)1521-3773(19990503)38:9<1172::AID-ANIE1172>3.0.CO;2-C. [DOI] [PubMed] [Google Scholar]
- 17.Bardone MR, Paternoster M, Coronelli C. J Antibiotics. 1978;31:170. doi: 10.7164/antibiotics.31.170. [DOI] [PubMed] [Google Scholar]
- 18.Parenti F, Beretta G, Berti M, Arioli V. J Antibiotics. 1978;31:276–283. doi: 10.7164/antibiotics.31.276. [DOI] [PubMed] [Google Scholar]
- 19.Barry AL, Thornsberry C, Jones RN. J Clin Micro. 1986;23:100–103. doi: 10.1128/jcm.23.1.100-103.1986. [DOI] [PMC free article] [PubMed] [Google Scholar]
- 20.Soriano A, Popescu D, García S, Bori G, Martínez J, Balasso V, Marco F, Almela M, Mensa J. Euro J Clin Micro Infect Dis. 2006;25:35–38. doi: 10.1007/s10096-005-0073-z. [DOI] [PubMed] [Google Scholar]
- 21.Verbist L, Tjandramaga B, Hendrickx B, Van Hecken A, Van Melle P, Verbesselt R, Verhaegen J, De Schepper PJ. Antimicro Agents Chemo. 1984;26:881–886. doi: 10.1128/aac.26.6.881. [DOI] [PMC free article] [PubMed] [Google Scholar]
- 22.Lin YS, Tsai PJ, Weng MF, Chen YC. Anal Chem. 2005;77:1753–1760. doi: 10.1021/ac048990k. [DOI] [PubMed] [Google Scholar]
- 23.Duffy DC, McDonald JC, Schueller OJA, Schueller GM. Anal Chem. 1998;70:4974–4984. doi: 10.1021/ac980656z. [DOI] [PubMed] [Google Scholar]
- 24.Novick RP. Molecular Biology of the Staphylococci. New York: VCH Publishers; 1990. [Google Scholar]
- 25.Fay SP, Posner RG, Swann WN, Sklar LA. Biochemistry. 1991;30:5066–5075. doi: 10.1021/bi00234a033. [DOI] [PubMed] [Google Scholar]
- 26.Zavaleta J, Chinchilla DB, Kaddis CF, Martinez K, Brown A, Gomez A, Pao A, Ramirez A, Nilapwar S, Ladbury JE, Gomez FA. J Cap Elect Microchip Tech. 2006;9:101–117. [PubMed] [Google Scholar]
- 27.Loll PJ, Kaplan J, Selinsky BS, Axelsen PH. J Med Chem. 1999;42:4714–4719. doi: 10.1021/jm990361t. [DOI] [PubMed] [Google Scholar]


