

Abstract
The rapidly increasing wealth of structural information on RNA and knowledge of its varying roles in biology have facilitated the study of RNA structure using computational methods. Here, we present a new method to describe RNA structure based on nucleotide doublets, where a doublet is any two nucleotides in a structure. We restrict our search to doublets that are close together in space, but not necessarily in sequence, and obtain doublet libraries of various sizes by clustering a large set of doublets taken from a data set of high-resolution RNA structures. We demonstrate that these libraries are able to both capture structural features present in RNA and fit local RNA structure with a high level of accuracy. Libraries ranging in size from ten to 100 doublets are examined, and a detailed analysis shows that a library with as few as 30 doublets is sufficient to capture the most common structural features, while larger libraries would be more appropriate for accurate modeling. We anticipate many uses for these libraries, from annotation to structure refinement and prediction.
Keywords: RNA structure, structural library, nucleotide doublet, clustering, computational
Introduction
The role of RNA as an intermediary between DNA and protein is a long accepted tenet in our understanding of biology. However, our knowledge of the roles that RNA can play has recently expanded to include a host of enzymatic functions.1 There is also now a wealth of structural information available for RNA, due largely to the highresolution X-ray structures of the large and small ribosomal subunits.2,3 These two major advances fuel a desire to better understand RNA on a structural and functional level, and provide necessary information to do so.
This wealth of structural information has sparked a variety of computational studies, which tend to fall along one of two lines. The first approach is to reduce this information to key structural elements. This has led to RNA analogs to the Ramachandran plot for proteins4,5, clustering of the RNA backbone into discrete conformations6-8 and clustering of loops into structural classes.9 The second approach involves the enumeration of a particular structural feature, typically the base-pair10-12, and associated movements to a unified and more descriptive nomenclature for these features.13,14
An exhaustive enumeration of structural features elucidates structural details of specific RNAs, but such a data set is not practical for the rapid and large-scale modeling of structures. Further, enumerating a single feature such as a base-pair has a limited ability to describe the variety of structure seen in RNA; any non-paired structural elements, of which there are many, would fail to be described.
A diverse set of discrete conformations is more valuable for structural modeling, which is important since the experimental determination of RNA structures is by no means a routine process. Most studies have focused entirely on single nucleotides6,8 or slight variations thereof,7 which allows for a good description of localized structure but does not provide any information about tertiary packing or the global fold. Others have focused only on a single structural element9 and therefore do not provide a large variety of structural information.
Here we provide a discrete set, or library, of RNA structural elements that are limited in number and yet still able to model accurately the majority of features present in the wide range of known RNA structures. Recognizing that pairwise interactions such as base-pairs and base stacking interactions form the basis of a large fraction of RNA structure, we have chosen the nucleotide doublet as our structural element. In order to obtain the greatest structural generality we consider any two nucleotides that are close together in space. This allows our libraries to include a wide range of structural motifs including canonical and non-canonical basepairs and base stacking interactions. Because we are not limited to a single nucleotide, or to nucleotides that are covalently connected, we are also able to describe tertiary packing interactions that contribute to the global fold of RNA molecules.
We obtain all nucleotide doublets within a 4 Å cutoff from a set of high-quality X-ray structures.7Doublets that form our libraries are chosen by a simulated annealing k-means clustering method,15 which allows us to specify different numbers of clusters. The center of each cluster becomes one member of a particular library of doublets, allowing the generation of libraries of defined size. We present results for library sizes ranging from ten to 100 clusters, and a more detailed analysis of the Size-30 Library.
Results
We used a previously described set of 132 high quality X-ray structures7 in order to generate 20,613 nucleotide doublets (the “full set”). We define a nucleotide doublet as any two nucleotides in a structure that have any heavy atoms within 4 Å of each other. Each nucleotide in a structure is capable of forming a doublet with multiple adjacent residues as seen in Figure 1, where a selected residue (colored orange) forms pairs with five residues (colored blue). Even if multiple doublets contain the same residue they are treated independently from one another. Simulated annealing k-means clustering15 was then applied to the full set of doublets to separate it into independent sets of 10, 20, 30, 40, 50 and 100 clusters. For each cluster, one nucleotide doublet is defined as its central or representative structure. Libraries were generated by collecting each of these representatives for a given number of clusters, and range in size from ten to 100 structural elements. All RMSD calculations between two doublets are performed by comparing 12 selected atoms: P, C1′,C4′, C2, C4 and C6 for each nucleotide. These atoms fully describe the shape of each nucleotide including the orientation of its base and provide equal sampling of the base and the sugar-phosphate backbone. Figure 2 illustrates these atoms for both purine and pyrimidine nucleotides.
Figure 1.
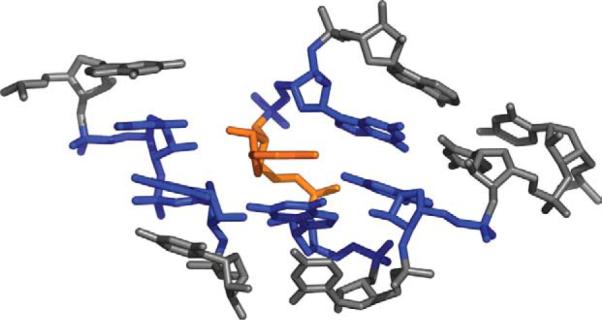
A section of the large ribosomal subunit (PDB ID 1JJ2) is shown, with a single nucleotide colored orange. This nucleotide forms a separate nucleotide doublet with each of the five residues colored blue. In the set of structures we use here, the average nucleotide is part of five doublets. There are some nucleotides that are part of just one doublet and a very small number of nucleotides that are part of 12 different doublets.
Figure 2.
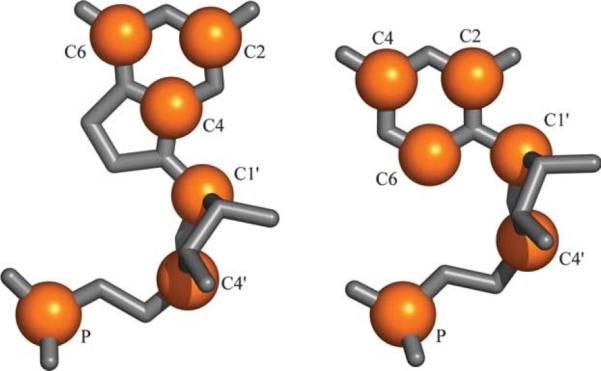
At left a guanine and at right a cytosine nucleotide, oriented in similar fashion. Highlighted in orange are atoms involved in RMSD calculations. There are six atoms in all, three in the backbone (P, C4′ and C1′) and three in the base (C2, C4 and C6). The different orientation of the six-membered ring between purines and pyrimidines serves to easily differentiate between the two types of nucleotide, and the distribution of atoms provides good sampling of both the base and sugar-phosphate backbone.
Local fit of structures
For a given library size, we calculated an RMSD value for the fit of each member of the full set of doublets compared to each library element. For each member of the full set we kept only the RMSD value that represents the best fit to a library doublet. These RMSD values were then averaged to measure the ability of a small library to reproduce the large conformational variability of doublets in the full set. Figure 3 shows that the average RMSD (or ⟨RMSD⟩) is small for all library sizes. As expected, ⟨RMSDi⟩ decreases as the library size increases. In the limit that every doublet in the full set is in the library (library size of 20,613), ⟨RMSD⟩ must be zero. ⟨RMSDi⟩ values start at about 1.5 Å for the full set and a Size-10 Library, dropping to about 1.1 Å for a Size-30 Library, and then less than 1 Å for a Size-50 Library and larger. Specifically, the log-linear plot (Figure 3 inset) shows that ⟨RMSD⟩= 1.75-0.41 × log10(k) as determined by least squares fitting. Another way to appreciate how well the cluster representatives fit is to do a control where we select the worst fitting library element instead of the best fitting. Now, ⟨RMSDi⟩ is in excess of 5 Å for the Size-30 Library, which is 4.5 times higher than ⟨RMSD⟩ to the best fitting library element.
Figure 3.

The average local RMSD of nucleotide doublets compared to libraries of various sizes. Orange circles represent the full set of 20,613 doublets, so that ⟨RMSD⟩ is the fit of all of the doublets of every nucleotide. Blue squares represent the reduced set of 8466, where the ⟨RMSD⟩ is to the best doublet for each nucleotide. We also show in red diamonds the ⟨RMSD⟩ to the second best doublet for each nucleotide. In the inset a base-10 logarithmic scale for library size, which also includes the library of size 20,613 with an ⟨RMSD⟩ = 0.0 Å as each fragment is in its own cluster.
A given residue in a structure can be part of many nucleotide doublets. This makes it possible to reduce the full by keeping only one doublet for each nucleotide. The doublet kept is the one with the lowest best fit value, leaving a total of 8466 (the “reduced set”). Note that if nucleotide i is in a doublet with j, j need not be in the same doublet with i in the reduced set. The size of the reduced set indicates that on average each nucleotide is in 4.9 doublets. Results for the reduced set are also presented in Figure 3. As expected, the reduced set displays a much lower average RMSD value, starting at about 0.6 Å for a Size-10 Library, and dropping slowly as the library size increases. The log-linear plot (Figure 3 inset) shows that ⟨RMSD⟩ 0.76-0.18×log10(k).
The average values alone do not indicate the range of RMSD values explored by either set. To highlight this we present histograms showing the distribution of RMSD values for the full set with Size-10 and Size-30 Libraries (Figure 4(a) and (b), respectively), and for the reduced set with the Size-30 Library (Figure 4(c)). The distribution is bimodal with two distinct peaks with the Size-30 Library and the full set; a similar shape is also observed for all larger sized libraries (data not shown). The first peak indicates a very good fit of less than 1 Å RMSD, and comprises the majority of the full set of doublets, approximately 53%. The data for the reduced set show a much narrower distribution of RMSD values, with only one peak at less than 1 Å RMSD comprising more than 85% of the reduced set. The best doublet for each nucleotide fits significantly better than the second best. This is clearly shown in Figure 3, where the average RMSD for both the best and second best fit doublets in the reduced set are plotted.
Figure 4.

RMSD distributions for sets of nucleotide doublets. (a) The full set of 20,613 doublets compared to the Size-10 Library. (b) The full set of 20,613 compared to the Size-30 Library. (c) The reduced set of 8466 compared to the Size-30 Library. Cumulative percentages are given directly on the graphs for RMSD values up to and including 1, 2 and 3 Å.
Evaluating the accuracy of the local fit
To highlight the structural meaning of different RMSD values in the context of these doublets, three superpositions of doublets with varying qualities of fit are shown in Figure 5. The best fit of the three, 0.89 Å (Figure 5(a)) corresponds to extremely similar structures, two different stacked dinucleotides with only minor conformational differences. The middle fit, 1.75 Å (Figure 5(b)) corresponds to two Watson-Crick base-pairs; one of them purine-pyrimidine (R-Y), and the other Y-R. In this case, the overall shape of the doublet, and indeed the backbone conformations are nearly identical, but the placement of the side-chain bases differs. Finally the worst fit, 2.93 Å (Figure 5(c)) corresponds to a Watson-Crick base-pair and a non-canonical basepair. At this level we start to see more significant structural differences, with very notable changes to the conformation of the bases. From this we can establish a criteria for evaluating the accuracy of our libraries. Doublets that fit the library to less than 2 Å are considered to fit with high accuracy based on the superposition of Figure 5(b). Doublets that fit to less than 3 Å are considered to have an acceptable accuracy based on Figure 5(c). Figure 4 includes the percentage of the full set that fits the Size-10 and Size-30 Libraries based on these criteria, and the percentage of the reduced set that fits the Size-30 Library.
Figure 5.

Superpositions of two nucleotide doublets of differing similarities. (a) Two similar stacked doublets (RMSD=0.89 Å). (b) R-Y and Y-R Watson-Crick base-pairs (RMSD=1.75 Å). (c) Watson-Crick base-pair (blue) and a non-canonical base-pair (RMSD=2.93 Å).
Fitting an entire structure
The library elements accurately fit the local structure of larger RNA molecules. Figure 6(a) and (b) shows the structure of the Sarcin-Ricin loop (PDB ID 483D)16 colored to reflect how well the Size-30 Library fits the conformation of each individual residue. The residues are colored increasingly red as the fit of the library elements to the target structure decreases. Figure 6(a) displays the average fit at a given residue for all possible doublets in the structure, analogous to the full set of pairs. Figure 6(b) shows the best fit at a given residue, analogous to the reduced set of pairs. The Sarcin-Ricin loop structure is a good example because it contains a variety of structure: canonical helical structure, a commonly observed GNRA tetraloop and a less common but well defined bulged G residue occurring with an S-turn in the backbone. The entire structure is fit well with all doublets fitting to less than 2.4 Å, and every residue being represented by at least one that fits to less than 1.5 Å. Figure 6(c) shows the superposition of all doublets and Figure 6(d) shows the superposition of the best fit doublets.
Figure 6.

The Sarcin-Ricin Loop (PDB ID 483D) fit with the Size-30 Library. (a) Colored by residue based on the average fit to the library of all doublets including that residue. (b) Colored by residue based on the single doublet including that residue which is the best fit to the library. (c) All possible doublets superimposed on the target structure. (d) Best doublets superimposed on the target structure. The scale indicates the RMSD of the doublets from the target structure for (a) and (b). Structures including superimposed doublets are available for download and visualization at http://csb.stanford.edu/~msykes/doublet/.
Determination of clustering hierarchy
Even though the clustering method itself is non-hierarchical, which is to say the determination of ten clusters has no bearing at all on the determination of 20 clusters and so on, it is still possible to assign connections between the clusters generated by the different clustering runs. Here, we refer to determining different numbers of clusters as clustering to different levels, with fewer clusters being the previous level and more clusters being the next level. In this way, determining ten clusters is the first level of clustering, 20 clusters the next and so on. We define the parent of a cluster as the cluster at the previous level that contains the greatest fraction of members of the current cluster, and draw a connection between the parent and the current cluster. By this definition every cluster will have a parent cluster, but every cluster will not necessarily have a child cluster at the next level. In Figure 7 we present this connectivity for Size-10 through Size-30 Libraries, arranged radially with every cluster represented by a single node and arrows showing their connectivity.
Figure 7.

A radial tree graph showing clustering at different levels. There are ten main branches, each representing one of the ten nodes at the first clustering level. Arrows indicate hierarchical connectivity determined after clustering; orange arrows indicate that the cluster center is preserved from one level to the next. Nodes are scaled so their area is proportional to their relative size: this is emphasized with nodes colored increasingly green as they are larger, and increasingly red as they are smaller. Nodes are annotated by a single letter: W, Watson-Crick base-pair; P, non-canonical base-pair; S, stacked; D, diagonal interaction; I, tertiary packing interaction; C, connected in chain; N, not connected in chain; A, platform, similar to an A-platform. On the outside are displayed the representative structures of the Size-10 Library; these correspond to the parent nodes of the ten main branches. The borders of the structural images are colored to match the colors used in Figure 9 and structures are oriented in consistent fashion with the view across the Watson-Crick binding face of the first nucleotide (orange), with its base perpendicular to the plane of the paper. The outermost nodes corresponding to the Size-30 Library are numerically labeled corresponding to Table 1.
Each node in the graph is scaled in size based on the size of the cluster relative to the average size of clusters at that level. For example with ten clusters and 10,000 doublets, the average size would be 1000, and a cluster with 2000 members would have a relative size of 2. This means that the average size changes with the number of clusters determined, so that a cluster with a constant number of members from one level to the next will have an increased relative size. Nodes on the tree are drawn so that their area is proportional to their relative size.
Each node is annotated based on the structure of the representative doublet taken from that cluster. This corresponds to the center of the cluster and is the structural element included in the library. “S” indicates that the doublet has a generally stacked structure similar to that which is seen in a double helix. “W” indicates that the nucleotides are in a Watson-Crick base-pair. “P” indicates the nucleotides form a non-canonical base-pair. “D” indicates that the nucleotides in the doublet are arranged diagonally, that is the second residue in the doublet is stacked above or below the base that forms a base-pair with the first. “I” indicates that the doublet is involved in a tertiary packing interaction, typically between two regions of helical structure. “A” indicates that the residues form a platform similar to the A-platform motif.17 “C” indicates the residues are covalently connected but do not possess easily definable structure. “N” indicates the two residues are not connected and do not possess easily definable structure. Examples of many of these types of structural elements are seen in the ten molecular drawings of the Size-10 cluster representatives shown in Figure 7.
This representation of the RNA “structure-space” gives a view of the diversity of the libraries of different sizes and highlights which structural features are most prominent in RNA. As expected the large green nodes are the Watson-Crick base-pairs (W), the stacking interactions (S), and diagonal interactions (D). These three interactions combine to form the double-helix. The relative size of these homogenous clusters actually increases with library size, because the clusters remain largely intact and of similar absolute size at the different levels. This demonstrates the power of the clustering method used,15 which is not overwhelmed by the frequency of occurrence of these canonical motifs and still produces a library full of diverse and less well-represented structures.
A more detailed view of one of the main branches, which shows each node's representative structure, is given in Figure 8. This branch corresponds to the branch displayed at the bottom of Figure 7, whose structure is bordered in red. At the lowest level (Size-10 Library), the branch is represented by a stacked doublet. At the second level (Size-20 Library) a configuration that is stacked but not connected is resolved. At the third level (Size-30 Library) there are two stacked doublets, one diagonal and one that represents a tertiary interaction between strands. This example shows how the diversity of this one branch, and similarly that of the entire library, increases with library size. We consider the clustering to have successfully separated the branch into diverse clusters. Going from the second to the third clustering level, the non-connected interaction (N) is replaced by a diagonal interaction (D) and a tertiary interaction (I). As shown by the small number of orange arrows in Figure 7, library doublets are not often identical from one level to the next, which can result in differing annotations and slight inconsistencies between libraries of different size. This arises when a cluster is not homogenous in terms of its structural content. Clustering at the next level is likely to change the size and shape of the cluster, resulting in a different cluster center.
Figure 8.

A more detailed view of the branch whose structural image has a red border in Figure 7. Structures are displayed for each cluster. The annotated view of the branch is seen in the inset and is annotated as explained in the legend to Figure 7 with numerical labels corresponding to Table 1.
A view of the Size-50 Library in two-dimensional RMSD space
For the Size-50 Library we calculate the RMSD between all elements in the library. We then represent each element by a 50-dimensional vector, where each dimension represents the RMSD to one of the other library elements. Using multi-dimensional scaling we reduce the 50 dimensions to two dimensions so that the distances on the graph are proportional to the RMSD values. This is plotted in Figure 9. In this plot, library elements that have similar structures are close together. For instance, library elements that are in the same initial main branch are close in the Figure, and for the most part each of the ten main branches occupies a well-defined portion of the two-dimensional space. The clear exception to this is the turquoise colored group of nodes. The clusters in this branch are all quite small, and are more structurally diverse than the other main branches. Of further note is the proximity of nodes with the same one-letter annotation and thus similar structure, but which do not all belong to the same main branch. Stacked nodes (S) are grouped in one area, even though they belong to three different main branches. Four of the five non-canonical pairs (P) are also tightly grouped though they arise from two different branches (teal and dark green). They are two reverse Hoogsteen pairs (AU and UA), and two sheared pairs (AG and GA). These are in turn close to the Watson-Crick base-pairs (W). In fact, using this representation we can determine four major classes for nucleotide doublet structure in RNA. The first class comprises the stacked pairs (S), the second is composed of the generic connected pairs (C) and the third is formed by the combination of base-pairs (W and P) and diagonal interactions (D). The final group is not structurally similar and contains the remaining non-connected structures, tertiary packing interactions and platform-like structures.
Figure 9.
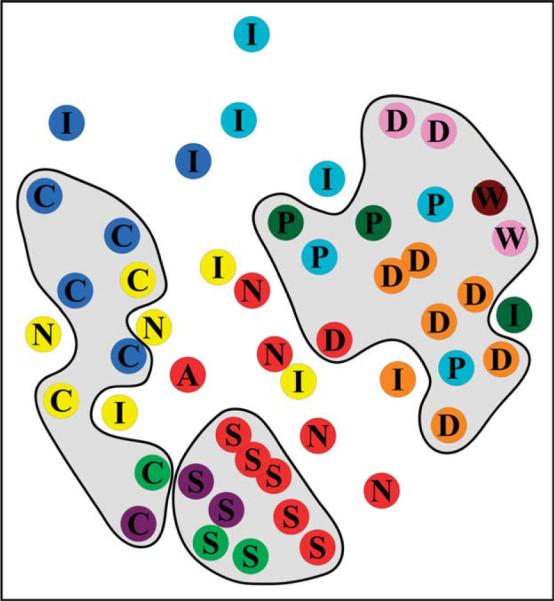
Two-dimensional representation of the Size-50 Library in a space defined by the RMSD between library doublets. Nodes are colored based on the ten main branches that are rooted to the Size-10 Library; they are annotated in the same manner as in Figure 7. Colors of nodes match the color of the border of the structural images seen in Figure 7. We have shaded regions that contain nodes of similar structure, revealing four main classes: (1) stacked structures (S) at the bottom of the Figure; (2) generic connected structures (C) at the left of the Figure; (3) paired and diagonal structures (W, D and P) at the right side of the Figure; (4) everything else, which includes generic non-connected structure (N), tertiary interactions (I) and platform motifs (A).
In generating Figure 9 we assigned connectivity by defining the parent of a cluster as the cluster at the previous level that contains the center, or library element, of the current cluster. This is slightly different from the method used to generate Figure 7, but produces very similar results. The tight grouping of the ten main branches supports the validity of these connections as they result in branches whose nodes are generally speaking close together in terms of RMSD.
Detailed analysis of Size-30 Library
To understand better the full diversity of a typical library of nucleotide doublets, we present a detailed examination of the Size-30 Library in Table 1. The Size-30 Library represents the 30 outermost nodes in the tree diagram displayed in Figure 7. We order the 30 clusters based on the average RMSD of all of the doublets in the cluster fit to the cluster center. We observe many expected structural features including stacked doublets, Watson-Crick base-pairs and diagonal interactions, which are all prominent features in double helices. We also find non-canonical pairs, and a variety of structures that represent kinks and bends in the RNA backbone. Finally, there are a series of elements that represent tertiary interactions between strands and helices.
Table 1.
Details of the Size 30 Library
| Cluster center |
Sequence content |
Most common sequences |
Res1 |
Res2 |
||||||||||||||||||
|---|---|---|---|---|---|---|---|---|---|---|---|---|---|---|---|---|---|---|---|---|---|---|
| Label | ⟨RMSD⟩ | Size of cluster | Description | Seq | RR | RY | YR | YY | 1st | 2nd | 3rd | 4th | PDB ID | # | Ch | # | Ch | |||||
| 1 | 0.39 | 1363 | Stack | C | C | 0.0 | 0.0 | 0.0 | 6.6 | CC | 8.0 | CU | 7.6 | UC | 5.3 | UU | 4.6 | 1jj2 | 2268 | 0 | 2269 | 0 |
| 2 | 0.42 | 1351 | Stack | G | C | 0.0 | 3.8 | 0.0 | 0.0 | GU | 5.0 | AC | 4.0 | GC | 3.8 | AU | 2.4 | 1n78 | 540 | C | 541 | C |
| 3 | 0.52 | 1465 | Stack | G | G | 3.1 | 0.0 | 0.0 | 0.0 | GG | 5.0 | AA | 2.4 | AG | 2.3 | GA | 2.2 | 1qcu | 6 | A | 7 | A |
| 4 | 0.53 | 1416 | Stack | C | G | 0.0 | 0.0 | 3.7 | 0.0 | CA | 4.4 | UG | 4.2 | CG | 3.6 | UA | 2.6 | 1jj2 | 2130 | 0 | 2131 | 0 |
| 5 | 0.56 | 1314 | Watson-Crick base-pair | C | G | 0.1 | 0.0 | 3.5 | 0.2 | CG | 5.8 | UA | 4.0 | UG | 1.7 | CA | 0.5 | 1jj2 | 2335 | 0 | 2349 | 0 |
| 6 | 0.57 | 1354 | Watson-Crick base-pair | G | C | 0.1 | 3.6 | 0.0 | 0.2 | GC | 5.7 | AU | 4.3 | GU | 1.9 | UU | 0.5 | 1rxb | 5 | A | 12 | B |
| 7 | 0.63 | 658 | Diagonal interaction | C | A | 0.0 | 0.0 | 3.3 | 0.7 | CG | 4.4 | CA | 3.5 | UG | 3.1 | UA | 1.2 | 1m5o | 20 | A | 3 | B |
| 8 | 0.65 | 505 | Variant of stack | A | A | 3.1 | 0.0 | 0.1 | 0.0 | AG | 5.7 | AA | 3.9 | GG | 2.0 | GA | 1.3 | 1lng | 219 | B | 220 | B |
| 9 | 0.75 | 202 | Variant of stack | A | C | 0.2 | 3.4 | 0.0 | 0.4 | AC | 8.9 | AU | 4.5 | GU | 1.7 | GC | 1.0 | 1fjg | 1188 | A | 1189 | A |
| 10 | 0.84 | 762 | Diagonal interaction | A | G | 3.1 | 0.0 | 0.0 | 0.0 | GG | 4.6 | GA | 2.7 | AG | 2.5 | AA | 1.9 | 1duq | 110 | A | 120 | B |
| 11 | 0.89 | 1073 | Diagonal interaction | G | U | 0.0 | 2.5 | 0.0 | 2.2 | GU | 3.2 | GC | 3.0 | CC | 2.5 | CU | 2.4 | 1hr2 | 234 | A | 241 | A |
| 12 | 0.98 | 712 | Diagonal interaction | G | G | 2.5 | 0.4 | 0.4 | 0.0 | GG | 3.1 | GA | 2.3 | AG | 2.2 | AA | 2.0 | 1hq1 | 131 | B | 176 | B |
| 13 | 1.37 | 171 | Variant of stack | U | U | 0.0 | 0.8 | 0.2 | 4.7 | UU | 8.5 | UC | 5.5 | CC | 3.3 | CU | 3.1 | 1csl | 77 | B | 78 | B |
| 14 | 1.50 | 382 | Diagonal interaction | U | A | 0.4 | 0.1 | 2.4 | 1.2 | CA | 4.0 | UG | 3.1 | UA | 2.5 | UC | 1.9 | 1jj2 | 1310 | 0 | 1345 | 0 |
| 15 | 1.65 | 309 | Reverse Hoogsteen pair | U | A | 1.1 | 0.2 | 2.0 | 0.5 | UA | 5.9 | CA | 2.2 | AA | 2.1 | AG | 1.4 | 1gid | 224 | A | 248 | A |
| 16 | 1.69 | 314 | Connected nucleotides | U | U | 0.6 | 1.0 | 0.9 | 2.2 | UC | 4.0 | UU | 3.0 | AC | 2.0 | UG | 1.3 | 1ehz | 7 | A | 8 | A |
| 17 | 1.71 | 489 | Sheared pair | G | A | 2.2 | 0.6 | 0.5 | 0.2 | GA | 4.8 | AA | 2.1 | UA | 1.5 | AU | 1.0 | 1gid | 150 | A | 153 | A |
| 18 | 1.74 | 192 | Variant of diagonal | G | C | 1.3 | 1.5 | 0.2 | 0.9 | AC | 4.3 | UC | 2.2 | AA | 2.2 | GA | 1.7 | 1fjg | 46 | A | 366 | A |
| 19 | 1.76 | 434 | Sheared pair | A | G | 2.3 | 0.5 | 0.5 | 0.1 | AG | 4.8 | AA | 2.6 | GA | 1.5 | AU | 1.4 | 1jbr | 12 | C | 19 | F |
| 20 | 1.76 | 504 | Similar to A-platform | G | A | 1.8 | 1.0 | 0.5 | 0.2 | GA | 2.8 | AA | 2.4 | AG | 1.9 | GU | 1.5 | 1fjg | 115 | A | 116 | A |
| 21 | 1.79 | 443 | Variant of stack | C | A | 1.2 | 0.3 | 1.5 | 0.8 | GA | 2.6 | UA | 2.2 | UG | 2.2 | CA | 2.1 | 1kd5 | 4 | A | 5 | A |
| 22 | 1.84 | 178 | Variant of diagonal | U | C | 0.4 | 1.2 | 1.0 | 1.8 | AU | 2.9 | UC | 2.2 | CC | 2.0 | CU | 1.6 | 1yfg | 8 | A | 13 | A |
| 23 | 1.84 | 541 | Tertiary interaction | G | G | 1.1 | 1.2 | 1.0 | 0.4 | AC | 3.3 | CA | 3.1 | AU | 1.5 | GA | 1.5 | 1jj2 | 1071 | 0 | 1292 | 0 |
| 24 | 1.85 | 313 | Connected nucleotides | C | C | 0.8 | 1.0 | 1.0 | 1.3 | UU | 2.8 | UC | 1.8 | AU | 1.6 | UA | 1.6 | 1jj2 | 1651 | 0 | 1652 | 0 |
| 25 | 1.85 | 314 | Tertiary interaction | U | G | 0.9 | 0.6 | 1.3 | 1.4 | UG | 2.1 | CU | 2.0 | UC | 1.6 | CA | 1.4 | 1jj2 | 1807 | 0 | 2884 | 0 |
| 26 | 1.90 | 280 | Tertiary interaction | A | A | 1.7 | 0.9 | 0.6 | 0.4 | AA | 2.5 | AG | 1.8 | AU | 1.7 | GA | 1.5 | 1jj2 | 151 | 0 | 441 | 0 |
| 27 | 1.91 | 270 | Tertiary interaction | G | A | 1.6 | 0.6 | 0.8 | 0.8 | GA | 3.2 | AA | 1.7 | CA | 1.6 | UG | 1.1 | 1fjg | 292 | A | 608 | A |
| 28 | 1.92 | 274 | Connected nucleotides | U | G | 0.9 | 0.5 | 1.8 | 0.6 | UG | 2.5 | UA | 1.8 | AA | 1.8 | CA | 1.8 | 1fjg | 884 | A | 885 | A |
| 29 | 1.97 | 208 | Connected nucleotides | C | U | 0.7 | 1.1 | 0.8 | 1.9 | UU | 2.8 | CU | 2.4 | UC | 1.9 | AA | 1.3 | 1euy | 934 | B | 935 | B |
| 30 | 2.35 | 167 | Tertiary interaction | G | C | 0.9 | 1.4 | 0.5 | 1.2 | GU | 2.2 | GG | 1.7 | UC | 1.6 | CC | 1.4 | 1g1x | 666 | D | 732 | E |
The entries in the Table are sorted by increasing ⟨RMSD⟩ of the members fit to their cluster center. For each cluster we include the number of members, a description of the cluster center and the sequence of the cluster center (column entitled Seq). We also look at the sequence content in terms of RR, RY, YR and YYpairs, where R is purine and Y is pyrimidine. The sequence content is given in terms of frequency of occurrence normalized such that 1.0 is what would occur by chance. Bold face numbers are significantly larger than expected by chance. The four most commonly occurring sequences for each cluster are also given. Finally the PDB ID and sequence information for each doublet is listed.
Signifies the number in the chain, and Ch signifies the chain ID.
Each cluster is further analyzed based on the sequence content of its members. We present both the relative sequence content in terms of purine and pyrimidine, normalized such that a value of 1.0 is what would be expected by chance, as well as the four most commonly occurring sequences for each cluster. The four stacked clusters (Table 1, clusters 1-4) represent all 16 possible nucleotide combinations within their top four occurring sequences, each sequence occurring much more often than by chance. This highlights the sequence-independent nature of the stacked structure and its ubiquitous presence in RNA. The Watson-Crick base-pairs on the other hand (Table 1, clusters 5-6) prominently represent only four of the possible 16 nucleotide combinations, namely RY and YR combinations. The other sequences that occur in these two clusters are non-canonical pairs that have a similar overall structure but do not occur at the same frequency.
In the case of both the stacking and Watson-Crick interactions the clusters tend to be homogenous on the purine or pyrimidine level. Other clusters, particularly the tertiary interactions, do not display such a level of sequence homogeneity. The largest such cluster (Table 1, cluster 23) contains relatively similar quantities of each of the purine-pyrimidine combinations, and its most commonly occurring sequences are far less frequent than for the stacked or Watson-Crick interactions. This is a result of the diminished importance of the identity of the base in these tertiary interactions whose distinguishing structural feature is the contact between sugar-phosphate backbones, and not the interaction between bases.
Discussion
A suitable “test set” for RMSD calculations?
Many computational analyses of structure involve two distinct sets, a training set from which data is pulled, in this case the set of structures used to determine our doublet libraries, and a second test set, which would in our case be used for the local fit calculations. Using two separate sets of structures helps prevent over-learning, which occurs when the libraries reflect only the structures present in the training set and not the true diversity of structures in general. Though the amount of structural information on RNA has increased greatly in recent years, it is still not on a par with that available for proteins and thus in this study we have chosen to use only one set of structures as both training set and test set for the bulk of our calculations. While we cannot for certain demonstrate that our libraries are not over-trained, we are confident in the diversity of our dataset, as it represents the majority of high-resolution X-ray structures published to date. Further, employing the same clustering algorithm on a reduced set of structures that did not contain the ribosomal subunits resulted in libraries that were almost completely devoid of tertiary packing interactions. From this we conclude that the diversity of the training set is crucial to the generation of diverse libraries, and not worth compromising in order to have a comparably sized test set. We have done the local fit approximation on a small test set of structures that have recently been released to the Protein Data Bank (PDB) (1ooa, 1q29, 1r9f, 1rlg, 1rpu, 1s03, 1si3, 1t0e, 1tfw, 1u0b, 1u1y, 1u8d, 1u9 s, 1wsu, 1u6b, 1xjr, 1xok, 1y26, 1y27, 1y39, 1yls, 1ze2, 2bgg, 2bh2). These are crystal structures which, with the exception of 1u6b (3.1 Å), have a resolution of better than 3 Å. This test set contains a total of 2744 doublets, and fits our doublet libraries with better accuracy than our full set used throughout the study. The Size-10 Library fits the test set to an average RMSD of 1.29 Å with 75% to less than 2 Å. The Size-30 Library fits to an average of 0.96 Å with 86% to less than 2 Å, and the Size-50 Library fits to an average of 0.87 Å with 89% to less than 2 Å. While these improved numbers are most likely due to a lack of diversity in the test set compared to the training set it is still an encouraging result.
Diversity of the Size-30 Library
As mentioned, the Size-30 Library contains a high level of structure diversity. This includes both helical features in the form of Watson-Crick base-pairs and stacking interactions, as well as non-helical structure, non-canonical pairs and tertiary packing interactions. The combination of these structural features allows our library to describe a large fraction of known RNA structure with high accuracy. Increasing the size of the library to 40 or 50 pairs of nucleotides provides an increase in the quality of the local fit, as evidenced by the reduction in ⟨RMSD⟩. Nevertheless, close examination and annotation of the larger size libraries (data not shown) does not reveal a proportional increase in the diversity of structural features present. Rather than adding only new structural archetypes, the additional library members include minor variations on already present structural motifs. This does not mean that no further motifs exist to be represented, but is suggestive that they do not occur at high frequency in known RNA structure and thus are below the threshold of sensitivity of our clustering method. Use of a Size-30 library also helps ensure that we are not over-learning.
One feature of our method is that we only discriminate between purines and pyrimidines but not individual bases. From this we expect a sequence-independent structural motif to be represented by four members in our libraries, accounting for all possible purine-pyrimidine combinations. Indeed this is observed for the stacking interaction, where there are four major clusters representing RR, RY, YR and YY stacking (Table 1, clusters 1-4). The Watson-Crick base-pair on the other hand is structurally limited and is only represented twice, once for RY and once for YR (Table 1, clusters 5 and 6). Other structural features, such as the tertiary packing interactions, are not present in clearly defined sets of two or four. Based on the calculated sequence content displayed in Table 1 we can deduce that such motifs are sequence-independent and simply not sufficiently represented in the structures to contribute to all possible sequence combinations in the library. This suggests that a given library could be artificially expanded to include all sterically feasible representatives of sequence-independent structural motifs in order to increase the modeling accuracy.
Applications of our doublet libraries
While the determination and analysis of these doublet libraries is of significant interest, that determination alone is not our ultimate goal. We foresee these libraries being used in a wide range of applications, from annotation to structure prediction. It should be possible to detect known structural motifs based on a particular pattern of doublet occurrence in experimental structures. This would be an efficient way to annotate a structure based on its three-dimensional shape. While the process can be done visually, it is a challenging and lengthy task to identify all the important structural features in a larger RNA molecule such as the ribosome, and we anticipate that more large RNA structures will become available. Similarly, regions of unique or interesting structure could be identified by novel doublet patterns being identified in the structure. A simple structural annotation is used in Figure 6 to highlight which regions of a structure do not fit well to our libraries. Areas of interest are highlighted due to their unusual conformations and comparatively poor fit to our doublet library.
In fitting other structures, large poorly fit regions could instead be ill-defined or poorly determined. These regions could then be refined based on the fit to our larger libraries. We foresee this being particularly useful in the determination of NMR structures where it is difficult to obtain sufficient structural restraints over the entire molecule. Inclusion of our libraries as soft restraints will allow an increase in the quality of determined NMR structures. A similar approach using a continuous knowledge-based potential based on the distance between the nucleotide bases has been previously demonstrated.18
Using the libraries as building blocks it will also be possible to build partial or complete RNA models. Model building is an important consideration for homology modeling and ab initio structure prediction. While interest in model building of RNA does not match that for protein, we anticipate that this will only increase with time as the central role of RNA in biology becomes better understood.
Choice of library size
We have chosen to focus on the Size-30 Library here in order to be able to provide a comprehensive analysis of the entire library. We feel that this is more worthwhile than a superficial examination of a much larger library. Further, the Size-30 Library fits 79.8% of all doublets in the full set with a high accuracy of less than 2 Å RMSD. We feel that this is an acceptable level for the library to be of practical use. Larger libraries have a greater proportion of highly accurate doublets, with 85.5% fitting to less than 2 Å RMSD for the Size-50 Library, and 91.0% for the Size-100 Library. Virtually the entire full set of doublets (99.0%) fits the Size-30 Library to less than 3 Å RMSD. Finally, if we consider the reduced set of doublets, 99.6% of them fit the Size-30 Library to within 2 Å RMSD, indicating that almost every residue forms at least one canonical contact that is well described by the Size-30 Library.
For our particular interests in a doublet-based energy function for modeling and prediction, it is necessary to keep the library size small to avoid the introduction of multiple local minima that will interfere with finding a global optimum. Other applications might benefit more from a larger library size. Generally speaking we consider the Size-30 Library to be the minimum reasonable size for practical use.
Comparison to RNA backbone rotamers
A previous study used clustering to determine 42 backbone rotamers for RNA.7 The rotamers describe a nucleotide “suite”, which includes the backbone dihedrals between and including two consecutive gamma angles. It is impossible to directly compare our doublet libraries to these backbone rotamers, but if we consider only our sequential connected doublets we can compare the dihedral angles of the suites contained within these doublets to the backbone rotamers. The Size-30 Library contains 13 sequential doublets, and by comparing their backbone dihedrals we can map these 13 doublets to seven of the rotamers, though a couple do not match well. The Size-50 Library contains 18 sequential doublets that we can map to nine of the rotamers. It is expected that the dihedral angles are not a close match in all cases, since our doublets describe an overall conformation, while the rotamers describe the dihedral angles explicitly. Further, since our doublets do not contain only backbone information and have a sequence dependence, it is not surprising that several doublets map redundantly to the same backbone rotamer. Six of the 13 doublets for the Size-30 Library and eight of the 18 doublets for the Size-50 Library have their closest match to the A-form helix rotamer. The backbone rotamers are a more efficient method to describe the RNA backbone alone, and this is expected as our doublets describe more than the backbone conformation. We anticipate that the combination of backbone rotamers and nucleotide doublets could be a very powerful method to fully describe RNA structure.
Future considerations for the doublet libraries
These doublet libraries are the first of their kind and have not yet been fully optimized. The fact that doublets do not always contain connected nucleotides introduces the question of doublet directionality. Sequential doublets have a well-defined directionality, and are determined in the standard 5′ to 3′ direction. Non-sequential doublets do not have an inherent direction, and can occur in pairs, which superimpose. A good example of this is the Watson-Crick base-pair, of which our libraries typically contain two examples; one purine-pyrimidine pair and one pyrimidine-purine. While the informational content from these two doublets is redundant, they serve a practical purpose by allowing us to treat the connected and non-connected doublets in the same way. Were we to keep only one of the two Watson-Crick doublets, in fitting structures we would need to consider both possible orientations of the doublet, whereas for connected doublets there is one unique orientation. With the second Watson-Crick doublet we can consider every doublet in the library as having a unique orientation. A given library could be artificially expanded to include both possible orientations of all non-connected doublets if they are not already present, much like the artificial expansion based on sequence independence that was mentioned earlier.
Another feature of our doublets is that based on our choice of P, C1′,C4′, C2, C4 and C6 atoms we discriminate between purines and pyrimidines based on structure. Using different atoms, or a different correspondence for the same atoms, we could reduce this sequence dependence. The anticipated effect of this would be a shift in the informational content for a given library size. For example there would be fewer doublets describing stacking interactions, and more doublets describing less common interactions. The tradeoff is that the stacking interactions would be less well-described. It would be more beneficial to simply use a larger library, which would increase the informational content rather than shift it.
Conclusion
We have generated nucleotide doublet libraries that are highly diverse and representative of the breadth of currently known RNA structure. These libraries include the canonical RNA interactions, stacked doublets and Watson-Crick base-pairs, as well as tertiary packing interactions and other less common connected and non-connected structures. Using these libraries we are able to fit local structure in known RNAs to a high level of accuracy. A library containing 30 nucleotide doublets fits local RNA structure from a large structural database to 1.1 Å with larger libraries performing better. We anticipate these libraries to be useful in the future for the modeling, refinement and prediction of RNA structure.
Methods
Selection of nucleotide doublets
We use the same set of structures as described by Murray et al.7 namely crystal structure files at 3.0 Å or better resolution available from the Nucleic Acid Database (NDB)19 as of June 16th, 2003. This comprises 132 structures in total, including copies of the large and small ribosomal subunits. The first biological assembly file was used in each case, and structures were further filtered by hand to remove duplicate chains.
From each of these 132 structures we then retrieved all of the doublets that had any heavy atoms (non-hydrogen atoms) within 4 Å of each other. Doublets involving modified residues were removed, resulting in a total of 20,613 doublets in all. The selected cutoff of 4 Å includes the first peak in a distribution of the number of nucleotide doublets for different cutoff values (data not shown). Figure 1 shows a section of RNA structure with one residue colored in orange. Each residue that forms a doublet with the orange colored residue is colored in blue. Given that the formation of doublets is sequence-independent, in all cases it is possible to generate both an A-B doublet and a B-A doublet with identical structure. We kept only the A-B doublet, with residue A defined as the one that occurred first in the sequence of the RNA molecule as reported in the structure file.
Clustering
Clustering is done by the method described by Kolodny et al.,15 which is known as simulated annealing k-means clustering. This is a non-hierarchical clustering method in which the desired number of clusters is chosen a priori, and where RMSD is the metric used to compare doublets to one another. Due to memory constraints the clustering algorithm is only able to cluster 20,000 items, so we use a randomly chosen subset of 19,960 out of the full set of 20,613 doublets to perform the clustering. The algorithm also includes a filtering step where outlying elements are removed and not included in any of the final clusters, so that the total number of doublets represented by clusters is 17,958. Even though the clustering operates on a subset of doublets, all of our local fit calculations are performed on the full set of 20,613 doublets. We perform the clustering specifying 10, 20, 30, 40, 50 and 100 clusters. RMSD is calculated based on six atoms in each nucleotide: P, C1′,C4′, C2, C4 and C6. These were chosen to reflect the overall structure of the nucleotide as well as to give good discrimination between purines and pyrimidines, based on the placement of the six-membered rings in the structure (Figure 2). They also represent an equal sampling of the base and the sugar-phosphate backbone with three atoms from each. It should be noted that based solely on those atoms, we do distinguish purines from pyrimidines but not A from G or C from U.
k-means simulated annealing uses repeated runs of k-means clustering and then merges two clusters and splits another in Monte Carlo fashion. Clusters to be merged and split are randomly chosen, with a higher propensity for nearby clusters to be merged, and disperse clusters to be split. The scoring function optimizes the total variance of the clustering, which is the square of the distance of any pair to the cluster centroid, summed over all clusters. This clustering method is especially suited for our purpose, since it has been found to handle differences in representation of different structural motifs well.15 This is necessary for clustering RNA structure that includes a large majority of double-helical structure. The center of each cluster is defined as the centroid of the cluster.
Although the clustering is a non-hierarchical method, in which determining ten clusters has no effect on determining 20 clusters and so on, it is possible to generate a hierarchy between levels of clustering using a variety of methods. We did this in three different ways: (1) The parent cluster is the cluster at the previous level that contains the current cluster's center. This method was used to generate Figure 9. (2) The parent cluster is the cluster at the previous level whose center was closest, in terms of RMSD, to the current cluster's center. (3) The parent cluster is the cluster at the previous level that contains the greatest fraction of members of the current cluster. This method was used to generate Figure 7. The first two methods produce virtually identical clustering hierarchies, with the third producing similar results but differing in certain areas, particularly with respect to the smaller, less well-defined clusters.
Multi-dimensional scaling
Multi-dimensional scaling was performed, and Figure 9 generated using the program GraphViz†. GraphViz implements the NEATO program, which uses the Kamada-Kawai algorithm20 in order to represent nodes in two-dimensional space.
Graphical representations of structure
All graphical representations of nucleic acid structure were generated using the program PyMol‡.
Availability of libraries and supplementary material
We make the following supplementary material available for download§. (1) All of our doublet libraries, and informational files for each. (2) The structures used to generate Figure 6(c) and (d) for improved visualization of the superposition of doublets. (3) An expanded version of Figure 7, which includes libraries of Size-10 through Size-50.
Supplementary Material
Acknowledgements
We thank Rachel Kolodny for invaluable assistance in performing the clustering and Jody Puglisi and Tanya Raschke for helpful comments on the manuscript. M.T.S. was partially supported by a Howard Hughes graduate fellowship and NIH Grant GM41455.
Abbreviations used
- PDB
Protein Data Bank
- NDB
Nucleic Acid Database
Footnotes
References
- 1.Cech TR. RNA as an enzyme. Sci. Am. 1986;255:64–75. doi: 10.1038/scientificamerican1186-64. [DOI] [PubMed] [Google Scholar]
- 2.Ban N, Nissen P, Hansen J, Moore PB, Steitz TA. The complete atomic structure of the large ribosomal subunit at 2.4 Å resolution. Science. 2000;289:905–920. doi: 10.1126/science.289.5481.905. [DOI] [PubMed] [Google Scholar]
- 3.Wimberly BT, Brodersen DE, Clemons WM, Jr, Morgan-Warren RJ, Carter AP, Vonrhein C, et al. Structure of the 30S ribosomal subunit. Nature. 2000;407:327–332. doi: 10.1038/35030006. [DOI] [PubMed] [Google Scholar]
- 4.Duarte CM, Pyle AM. Stepping through and RNA structure: a novel approach to conformational analysis. J. Mol. Biol. 1998;284:1465–1478. doi: 10.1006/jmbi.1998.2233. [DOI] [PubMed] [Google Scholar]
- 5.Murthy VL, Srinivasan R, Draper DE, Rose GD. A complete conformational map for RNA. J. Mol. Biol. 1999;291:313–327. doi: 10.1006/jmbi.1999.2958. [DOI] [PubMed] [Google Scholar]
- 6.Gautheret D, Major F, Cedergren R. Modeling the three-dimensional structure of RNA using discrete nucleotide conformational sets. J. Mol. Biol. 1993;229:1049–1064. doi: 10.1006/jmbi.1993.1104. [DOI] [PubMed] [Google Scholar]
- 7.Murray LJW, Arendall WB, III, Richardson DC, Richardson JS. RNA backbone is rotameric. Proc. Natl Acad. Sci. USA. 2003;100:13904–13909. doi: 10.1073/pnas.1835769100. [DOI] [PMC free article] [PubMed] [Google Scholar]
- 8.Schneider B, Morávek Z, Berman HM. RNA conformational classes. Nucl. Acids Res. 2004;32:1666–1677. doi: 10.1093/nar/gkh333. [DOI] [PMC free article] [PubMed] [Google Scholar]
- 9.Huang H-C, Nagaswamy U, Fox GE. The application of cluster analysis in the intercomparison of loop structures in RNA. RNA. 2005;11:412–423. doi: 10.1261/rna.7104605. [DOI] [PMC free article] [PubMed] [Google Scholar]
- 10.Nagaswamy U, Larios-Sanz M, Hury J, Collins S, Zhang Z, Zhao Q, Fox GE. NCIR: a database of non-canonical interactions in known RNA structures. Nucl. Acids Res. 2002;30:395–397. doi: 10.1093/nar/30.1.395. [DOI] [PMC free article] [PubMed] [Google Scholar]
- 11.Leontis NB, Stombaugh J, Westhof E. The non-Watson-Crick base pairs and their associated isostericity matrices. Nucl. Acids Res. 2002;30:3497–3531. doi: 10.1093/nar/gkf481. [DOI] [PMC free article] [PubMed] [Google Scholar]
- 12.Lee JC, Gutell RR. Diversity of base-pair conformations and their occurrence in rRNA structure and RNA structural motifs. J. Mol. Biol. 2004;344:1225–1249. doi: 10.1016/j.jmb.2004.09.072. [DOI] [PubMed] [Google Scholar]
- 13.Olson WK, Bansal M, Burley SK, Dickerson RE, Gerstein M, Harvey SC, et al. A standard reference frame for the description of nucleic acid base-pair geometry. J. Mol. Biol. 2001;313:229–237. doi: 10.1006/jmbi.2001.4987. [DOI] [PubMed] [Google Scholar]
- 14.Leontis NB, Westhof E. Geometric nomenclature and classification of RNA base pairs. RNA. 2001;7:499–512. doi: 10.1017/s1355838201002515. [DOI] [PMC free article] [PubMed] [Google Scholar]
- 15.Kolodny R, Koehl P, Guibas L, Levitt M. Small libraries of protein fragments model native protein structures accurately. J. Mol. Biol. 2002;323:297–307. doi: 10.1016/s0022-2836(02)00942-7. [DOI] [PubMed] [Google Scholar]
- 16.Correll CC, Wool IG, Munishkin A. The two faces of the Escherichia coli 23 S rRNA Sarcin/Ricin domain: the structure at 1.11 Å resolution. J. Mol. Biol. 1999;292:275–287. doi: 10.1006/jmbi.1999.3072. [DOI] [PubMed] [Google Scholar]
- 17.Cate JH, Gooding AR, Podell E, Zhou K, Golden BL, Szewczak AA, et al. RNA tertiary structure mediation by adenosine platforms. Science. 1996;273:1696–1699. doi: 10.1126/science.273.5282.1696. [DOI] [PubMed] [Google Scholar]
- 18.Clore GM, Kuszewski J. Improving the accuracy of NMR structures of RNA by means of conformational database potentials of mean force as assessed by complete dipolar coupling cross-validation. J. Am. Chem. Soc. 2003;125:1518–1525. doi: 10.1021/ja028383j. [DOI] [PubMed] [Google Scholar]
- 19.Berman HM, Olson WK, Beveridge DL, Westbrook J, Gelbin A, Demeny T, et al. The Nucleic Acid Database: a comprehensive relational database of three-dimensional structures of nucleic acids. Biophys. J. 1992;63:751–759. doi: 10.1016/S0006-3495(92)81649-1. [DOI] [PMC free article] [PubMed] [Google Scholar]
- 20.Kamada K, Kawai S. An algorithm for drawing general undirected graphs. Inf. Proc. Letters. 1989;31:7–15. [Google Scholar]
Associated Data
This section collects any data citations, data availability statements, or supplementary materials included in this article.