

Abstract
How HIV-1 affects the monocyte proteome is incompletely understood. We posit that one functional consequence of virus-exposure to the monocyte is the facilitation of protein transformation from the cytosol to the plasma membrane (PM). To test this, cell surface labeling with CyDye fluorophores followed by 2 dimensional differential in-gel electrophoresis (2D DIGE) and liquid chromatography tandem mass spectrometry (LC/MS-MS) was performed. Fifty three percent of HIV-1 induced proteins were PM associated. These were linked, in large measure, to cellular activation and oxidative stress. They included biliverdin reductase, leukotriene hydrolase A4, heat shock protein 70, and cystatin B. HIV-1 induced PM protein translocation was linked to cathepsin B- and caspase 9, 3-dependent apoptosis. In contrast, PMA-treated monocytes bypassed caspase 3, 9 pathways and lead to cathepsin B-dependent necrosis. These results demonstrate that HIV-1 affects monocyte activation and oxidative stress. These do not affect viral infection dynamics but are linked to stress-induced cell death.
Keywords: Monocytes, HIV-1, Phorbol Myristate Acetate, Plasma Membrane, Proteomics, Oxidative Stress, Apoptosis, Necrosis
1. Introduction
The plasma membrane (PM) constitutes a vital interface between the cell and its external environment. Integral PM and PM-associated proteins play important roles in cellular adhesion, cell-extracellular matrix recognition and intercellular communication. Alterations in the PM proteome may underlie differences between activated and resting immune cells and consequently determine the generation of an adequate immune response [1, 2]. Identification and characterization of the PM proteome is pivotal in understanding cellular processes in disease and with the development of new proteomics technologies its investigation has recently gained intense interest [3]. Although integral membrane proteins are encoded by 25% of all open reading frames, their characterization has proven difficult due to their low abundance, high molecular mass and hydrophobicity [4, 5].
Numerous strategies have been utilized to overcome such limitations. PM protein enrichment by cell surface biotinylation and affinity capture by avidin has shown success with 1D electrophoresis. However resolution is sacrificed and gel bands contain numerous comigrating proteins [6, 7]. These techniques also cannot assess quantitative protein changes nor can they compare protein expression across multiple samples [8, 9]. “Shotgun” methods utilize enzymatic digestion of PM proteins prior to electrophoresis. This approach offers advantages as separation of peptides (rather than proteins) by sequential strong cation exchange columns and reverse-phase chromatography obviates solubility from protein hydrophobicity [10, 11]. Such strategies when combined with isotope-coded affinity tagging (ICAT) and isobaric tag for relative and absolute quantitation (iTRAQ) enable protein quantitation and sample cross-comparison [12, 13]. However, data analysis for most “shotgun” techniques involves intensive computational analysis [1]. Limitations such as protein mass and charge together with loss of connectivity between analyzed peptides and the parent protein hinder post-translational modification analyses [2].
The CyDye cell surface labeling technique associated with 2D DIGE can provide quantitative characterization of the PM proteome. Traditionally 2D electrophoresis has posed intrinsic limitations to the representation of membrane proteins; however introduction of new chaotropic compounds such as thiourea and development of novel zwitterions have improved protein solubility and resolution in 2D [5, 14-16]. Surface labeling 2D DIGE enables labeling of PM and PM-associated proteins in living cells and prior to cellular fractionation and 2D electrophoresis. As such it permits detection of only the PM proteome and obviates masking of these proteins form high abundance cytoskeletal and cytozolic proteins. Utilization of multiple CyDye fluorophores and an internal standard enables cross-comparison of PM-proteome between multiple cell groups or conditions. This method does not require intensive computational analysis, it allows for both global and focused investigations and more importantly it provides information about expression of protein isoforms and post-translational modifications [17, 18].
Herein, we utilized CyDye surface labeling and 2D DIGE to determine how HIV-1 affects the monocyte PM proteome and cellular physiology. HIV-1 infected mononuclear phagocytes (MP; monocytes, macrophages and dendritic cells) are vehicles for viral dissemination in the infected human host [19, 20]. In contrast to profound cytotoxicity seen after HIV-1 replication in T cells [21], macrophages become persistently infected with limited cytopathicity [22]. Monocytes show restricted infection in vivo [23, 24] where a very small proportion of cells (0.001% – 1%) harbor HIV-1 [25, 26]. Functional changes seen in monocyte-macrophages during differentiation and cell activation include enhanced microbial clearance, antigen presentation, secretory activities [27, 28] and transendothelial migration [29-31]. However little is known about the immunobiology of restricted viral infection.
To this end, we now show that during restricted infection, the monocyte actively responds to virus. Virus-induced monocyte activation and respiratory burst parallels active transport of traditionally cytozolic redox proteins to the PM. Results show that association of biliverdin reductase (BVR), leukotriene hydrolase A4 (LTA4H), heat shock protein 70 (HSP70), and cystatin B (CB) with the PM correlates closely with the outcome of cell survival. Indeed, monocytes exposed to HIV-1 that showed up regulation of these proteins in the cell surface, underwent apoptosis. Acute induction of similar oxidative stress levels by PMA showed a downregulation of BVR, LTA4H, HSP70 and an increase in CB association with the PM. These events paralleled necrosis. Interestingly, treatment of PMA-exposed cells with vitamin E (VE, strong anti-oxidant of lipid bilayer) restored BVR, LTA4H, HSP70 and CB presence in the PM at similar levels to those induced by HIV-1. These events associated with a shift from necrosis to apoptosis. Transformation of the PM proteome by HIV-1 exposure shows that the virus, although unable to complete its life cycle, induces oxidative stress and affects cell survival.
2. Materials and Methods
2.1. Reagents
The 8E5 cells were obtained through AIDS Research and Reference Program Division of NIAID, NIH (Bethesda, MD). The CyDye DIGE Fluor minimal labeling, 2D Clean up, and 2D Quant kits were purchased from GE Healthcare (Piscataway, NJ). The 2D Sample Prep for Membrane Proteins Kit and the 10-20 % gradient Tris-Glycine gels were from Jule Inc (Milford, CT) and Pierce (Rockford, IL) respectively. The VE and PMA were from Sigma-Aldrich (St. Louis, MO). [6-(4′-amino) phenoxy-3H-xanthen-3-on-9-yl] benzoic acid (APF) and rabbit anti-BVR were purchased from Stressgen Bioreagents (Ann Arbor, MI). The allophycocyanin (APC-conjugated anti-CD14 mAb was purchased from Becton Dickinson (Franklin Lakes, NJ). The annexin V/PI staining kit and FITC-conjugated IgG2a mouse anti-HIV-1 p24 (KC57 FITC) were from Beckman Coulter Inc (Miami, FL). The rabbit anti-human LTA4H polyclonal Ab was from Cayman Chemical (Ann Arbor, MI). The rabbit anti-human HSP70 polyclonal Ab and goat anti-rabbit, anti-mouse HRP-conjugated secondary Ab were purchased from Novus Biologicals (Littleton, CO). The goat anti-rat secondary Ab was from R&D Systems Inc (Minneapolis, MN). The mouse anti-human CB and rabbit anti-human caspase 3 and 9 Ab were purchased from BioVision Research Products (Mountain View, CA) and Cell Signaling Technology (Danvers, MA) respectively.
2.2. Isolation, cultivation, and HIV-1 treatment of human monocytes
Experiments with human PBMC were performed in full compliance with the ethical guidelines of both the National Institutes of Health and the University of Nebraska Medical Center. PBMC from HIV-1, 2 and hepatitis seronegative human donors were obtained by leukophoresis, and purified by countercurrent centrifugal elutriation [32]. Monocytes were seeded to 250 ml Teflon flasks in suspension cultures. Cells were cultured in DMEM (Invitrogen, Carlsbad, CA) supplemented with 10% heat-inactivated pooled human serum, 1% L-glutamine, 10 μg/ml ciprofloxacin (Sigma-Aldrich), and 1000 U/ml highly purified recombinant M-CSF (a generous gift from Wyeth, Inc., Cambridge, MA). Cells were maintained at 37°C with 5% CO2. After 24 h in culture, monocytes were exposed to HIV-1ADA stock (a macrophage tropic viral strain) using 1 infectious unit (i.u.) per cell, or left untreated as controls. Following 4 h of incubation, media was added to all cultured cells to restore full volume for 24 h. On day 1 after exposure to the virus, a full media exchange was performed followed by a half media exchange every 2 d thereafter.
2.3. Monocyte surface labeling
Seven days after viral exposure, 10 × 106 monocytes from each group (HIV-1-treated and non-treated) were pelleted at 800 × g at 4°C for 2 min. Cells from both groups were combined in equal ratios (10 × 106 cells total) to be used as internal control for 2D DIGE. Cells were washed once with ice cold HBSS (Invitrogen) at pH 7.4 followed by centrifugation at 800 × g at 4°C for 2 min. Cells were kept on ice throughout the labeling procedure, washed with cold 1 ml of HBSS pH 8.5 and centrifuged at 800 × g at 4°C for 2 min. Supernatants were removed and the intact cells were resuspended 200 μl of cold labeling buffer (HBSS pH 8.5, 1 M urea. One μl (600 pM) of the Cyanine dyes 1-(5-caboxypentyl)-1-propylindocarbocyanine halide (Cy2), N-hydroxy-succinimidyl ester (Cy3), 1-(5-carboxypentyl)-1-methylindodicarbocyanine halide (Cy5) was added to each group (non-treated and HIV-1-treated pooled), non-treated and HIV-1-treated respectively. Cells were gently vortexed, incubated on ice and shielded from light for 20 min. The reaction was quenched by adding 10 μl of 20 mM L-lysine (Sigma-Aldrich) for 10 min on ice. Surface-labeled monocytes were washed with 500 μl of HBSS pH 7.4 twice followed by centrifugation at 800 × g at 4°C for 2 min. Cell lysis was performed using (50 μl/10 × 106 cells) standard lysis buffer pH 8.5 [30mM TrisCl], 7 M urea, 2 M thiourea, 4% weight/volume (w/v) CHAPS and 1X protease inhibitor cocktail (Sigma)] followed by 2D DIGE. To visualize the PM protein staining, a portion (1 × 10⁵) of the labeled cells shown above were sedimented onto microscope glass slides (Thermo Scientific Inc., San Jose, CA) by centrifugation at 800 × g for 5 min. Cells were fixed with 4% paraformaldehyde (PFA) pH 7.4 at RT for 15 min, washed once with PBS and treated with ProLong Gold® anti-fading solution (Invitrogen). Images were obtained on a Zeiss Confocal LSM510 microscope (Carl Zeiss Microimaging Inc., Thornwood, NY).
To compare 2D profiles of fractionated and non-fractionated cells, monocytes (10 × 106) were surface-labeled with Cy3 and Cy5 dyes as shown above. Cells labeled with Cy3 were fractionated into cytosolic (hydrophilic) and membrane (hydrophobic) fractions using 2D Sample Prep for Membrane Proteins Kit per manufacturer's instructions. Following fractionation and desalting, the Cy3-labeled membrane fraction was combined with the lysed Cy5-surface labeled cells and the volume was adjusted to 450 μl by adding equal volumes of 2× sample buffer 8 M urea, 4% (w/v) CHAPS, 130 mM DTT, 2% (v/v) Pharmalyte (pH 3–10 NL)] and rehydration buffer [7 M urea, 2 M thiourea, 2% CHAPS, 50 mM DTT, 1% Pharmalyte (pH 3–10 NL)]. The cytosolic fraction of the Cy3-surface labeled cells and the Cy3/Cy5 pooled samples were separately loaded into IPG gel strips followed by isoelectric focusing (IEF) and separations in 2D.
2.4. 2D DIGE and spot image acquisition
PM and cytosolic fractions from surface labeling and labeled whole cell lysates were prepared as independent protein pools. The resulting pools of proteins were loaded for 18 h onto gel strips with immobilized pH gradient (24 cm; pH 3–10 NL; GE Healthcare). First-dimension separation was performed on an IPGphor II apparatus (GE Healthcare) per manufacturer's instructions. For subsequent SDS PAGE (2nd dimension) IPG strips first reduced and then alkylated by immersion in equilibration solution containing 6 M urea, 30% glycerol, 2% SDS, 50 mM Tris (pH 8.8)] containing 100 mM DTT for 15 min and equilibration buffer containing 100 mM iodacetamide (Sigma). Strips were directly applied to a 10-20% gradient Tris-Glycine gel for the second dimension separation. Current was held constant at 17 mA per gel for 20 h at 20°C. Gels were scanned using Typhoon 9410 Variable Mode Imager (GE Healthcare) at a resolution of 100 pixels and excitation/emission wavelengths of 488/520 nm, 520/590 nm, and 620/680 nm for the Cy2-, Cy3-, and Cy5-labeled proteins respectively. Prior to spot picking, gels were immersed for 3 h in fixing solution (10% methanol, 7% acetic acid) at RT.
2.5. DeCyder™ analysis and mass spectrometry
All the images were collected and processed on 2D 2920 Master Imager (GE Healthcare). Statistics and quantitation of differential protein expression were performed using DeCyder™-DIA software (GE Healtchare). Prior to analysis fluorescence intensities of the Cy3 and Cy5 images were normalized to the Cy2-labeled internal standard and dust particle pseudospots were excluded. Only proteins represented by spots with equal or higher than 2-fold volume change between the HIV-treated and control monocytes were defined as altered. Spots were automatically excised by Ettan™ Spotpicker (GE Healthcare) followed by in-gel tryptic digestion (3 ng/spot of trypsin (Promega, Madison, WI) for 16 h at 37°C. Peptide extraction and purification μC18 ZipTip® (Millipore Corp. Bedford, MA) were performed on the Proprep Protein Digestion and Mass Spec Preparation Systems (Genomic Solutions, Ann Harbor, MI).
Extracted peptides were fractionated on microcapillary RP-C18 column (NewObjectives, Woburn, MA) and sequenced using ESI-LC-MS/MS system (ProteomeX System with LCQDecaPlus mass spectrometer, Thermo Fisher, Pittsburg, PA) in a nanospray configuration. The acquired LC-MS/MS spectra were searched against the NCBI.fasta protein database narrowed to a subset of human proteins using Sequest search engine (BioWorks 3.1SR software from Thermo Scientific). The TurboSEQUEST search parameters were set as follows: Threshold Dta generation at 10000, Precursor Mass Tolerance for the Dta Generation at 1.4, Dta Search, Peptide Tolerance at 1.5 and Fragment Ions Tolerance at 0.00. Charge state was set on “Auto” Database nr.fasta was retrieved from ftp.ncbi.nih.gov and used to create “in-house” an indexed human.fasta.idx (keywords: Homo sapiens, human, primate). Proteins with two or more peptides were considered highly confident identifications.
2.6. Oxidative stress
HIV-1 infected and control monocytes were maintained at a density of 1 × 10⁶ cells/ml of DMEM in Teflon tubes and treated with 100 μg/ml of VE every 2 d with media exchange. Prior to confocal imaging and cell pellet collections, cells were incubated with 10 ng/ml of PMA for 1 h. Cell groups including untreated, VE-treated, PMA-treated and those with dual treatment were washed twice in 1X PBS and were used for confocal and immunoblotting analyses.
Optimal doses of PMA and VE were determined by performing hyperactive reactive oxygen species (hROS) dose-response experiments with monocytes not exposed to HIV-1. Cells were plated in 96 well black assay plates (Thermo Fisher) (1 × 10⁵ cells per well), and allowed to stabilize for 3 d prior to measurement of hROS. Cells were washed twice treated with Krebs-Ringers phosphate buffer (Sigma-Aldrich) and 5 μM (100 μl) of APF was added to each well. Following incubation with APF (30 min at 37°C), cells were treated with 10, 50 and 100 ng/ml of PMA for 1 h at 37°C. Fluorescence readings were acquired using M5 microplate fluorometer (Molecular Devices Corp., Sunnyvale, CA) (ex/em 488/515 nm). The optimal VE dose was determined by treating cells with 10, 100, and 1000 ng/ml for 24 h. This was done prior to exposure to APF and PMA. Cells treatments and fluorescence readings were performed as described above.
2.7. Ab-treatment and cell viability
Uninfected cells were washed twice in PBS and resuspended in 300 μl of DMEM with 5% human serum, containing rabbit anti-human Ab LTA4H, BVR, HSP70, mouse anti-human CB, mouse isotype control IgG1 and secondary rabbit Ab at a concentration of 20 μg per 5 × 10⁵ cells. Following treatment with Ab, cells were incubated with 10 ng/ml PMA for 1 h at 37°C. Annexin V/PI staining was performed per manufacturer's instructions. PMA-treated cells incubated with isotype Ab were used as controls. Monocytes were gated using forward and side scatter graph, and data analysis was performed using FCS Express V3 (De Novo Software, Los Angeles, CA).
2.8. Cell fractionation and immunoblotting
HIV-1-treated and non-treated cells together with VE-treated, PMA-treated HIV-1-exposed and control cells were lysed and fractionated using the 2D Sample Prep for Membrane Proteins Kit (Pierce). Proteins from membrane and cytosolic fractions were precipitated using 2D Clean up Kit and quantified by 2D Quant (GE Healthcare) per manufacturer's instructions. Samples were run on 12 well Bis-Tris 4-12% gels (Invitrogen) followed by transfer on PVDF. Membranes were probed against LTA4H, BVR, HSP70, mouse anti-cathepsin B and rabbit anti-caspase 3 and 9 in 5% powdered milk in 1X PBS and 0.2% Tween overnight at 4°C. Following multiple washes in PBST membranes were probed with goat anti-rabbit, anti-mouse, goat anti-rat HRP-conjugated secondary Abs for 45 min at RT. HRP activity was visualized by enhanced chemiluminescence detection (Pierce). Sample loading controls were generated by re-probing of the membranes with rabbit anti-actin β and goat anti-rabbit HRP-conjugated Abs. No loading controls were used for the membrane fraction due to lack of an abundant stable marker for all cellular membranes.
2.9. Flow cytometry
HIV-1-treated and non- treated monocytes at 7 d in culture were counted by trypan blue exclusion and 1 × 10⁶ cells per group were centrifuged at 800 × g for 5 min at 4°C. Cell were incubated with Ab against LTA4H, BVR, CB and HSP70-FITC conjugated in 5% BSA and 0.01% sodium azide in PBS for 30 min at RT. Cells were washed three times with PBS followed by labeling with the secondary Ab (goat anti-rabbit and anti-mouse Alexa-488) for 30 min at RT. Cells were washed three times with 5% BSA in PBS. Cells were fixed with 4% PFA in PBS, pH 7.4 for 15 min at RT and resuspended in DPBS prior to flow cytometry analysis. Unlabeled cells and those stained with the secondary and the isotype Abs only (IgG1–FITC conjugated for HSP70) were used as gating and normalization controls. Cells were analyzed by FACSCalibur flow cytometer (Becton-Dickinson) using Cell Quest software (Becton-Dickinson). Monocytes were gated using forward and side scatter. Data were analyzed using FCS Express V3 (De Novo Software).
2.10. Confocal Microscopy
Localization and differential expression of LTA4H, HSP70, BVR, and CB in the plasma membrane was confirmed by confocal analysis. Cells (1 × 10⁵) as prepared for flow cytometry (above) were sedimented on Shandon microscope slides (Thermo Fisher) by centrifugation at 800 × g for 5 min. Cytospins were then covered with ProLong® Gold antifade mounting solution (Invitrogen) and analyzed on a Zeiss Confocal LSM510 microscope (Carl Zeiss Microimaging Inc.). Images were acquired using the same parameters within groups stained with the same protein. For HIV-1-treated and non- treated monocytes scanning parameters were set with the following parameters: LTA4H, gain 858, offset -0.285, brightness 50, contrast 50; HSP70, gain 1232, offset -1.6, brightness 50, contrast 60; BVR, gain 1187, offset -1.6, brightness 50, contrast 60; CB gain 818, offset -0.157, brightness 50 and contrast 52. The acquisition parameters for PMA-treated and non-treated cells were set as follows: LTA4H, gain 1093, offset -0.272, brightness 50, contrast 53; HSP70, gain 936, offset -0.3, brightness 50, contrast 57; BVR, gain 991, offset -0.441, brightness 50, contrast 54; CB gain 1055, offset -0.799, brightness 50 and contrast 55.
To determine both PM and cytoplasmic distribution of these proteins, intracellular staining of monocytes was performed. Human monocytes (1× 10⁵ per group) were fixed with 4% PFA pH 7.4 for 15 min at RT. Cells were washed twice with ice cold PBS and permeabilized with 5% BSA, 1% Triton-X 100 (Sigma) in PBS for 15 min. Cells were then separately stained against LTA4H, BVR, HSP70-FITC conjugated, and CB Ab in 5% BSA in PBS for 1 h at RT followed by incubation with the secondary anti-mouse and anti-rabbit Alexa488-conjugated Ab. Cells were washed three times with PBS and sedimented into Shandon cytoslides (Thermo Fisher) by centrifugation at 800 × g for 5 min. Cells were covered with ProLong® Gold anti-fade mounting solution (Invitrogen) and imaged on Zeiss 510 LSM confocal microscope. Confocal images were acquired by using identical parameters for groups stained against the same protein (LTA4H, gain 1051, offset -0.815, brightness 50, contrast 53; HSP70, gain 936, offset -0.3, brightness 50, contrast 57; BVR, gain 931, offset -0.943, brightness 50, contrast 54; CB gain 936, offset -0.581, brightness 50 and contrast 54).
2.11. Statistical analyses
All resulting data were analyzed for statistical significance by Student's t-tests with a one-way analysis of variance and were calculated using Microsoft Excel.
3. Results
3.1. Surface labeling of human monocytes
CyDye surface labeling was performed in living virus-treated and non-treated cells, and protein expression was compared by 2D DIGE (Fig. 1A). The approach is based on the chemistry of minimal labeling CyDyes to covalently bind the ε-amine of lysine with their N-hydroxy-sulfosuccinimide (NHS) ester group via an amide linkage (Fig. 1B). The CyDye and lysine carry an intrinsic +1 charge at neutral or acidic pH, and during the coupling process the charge is transferred ensuring that the isoelectric point of the protein does not shift significantly.
Figure 1. Surface labeling of living cells.
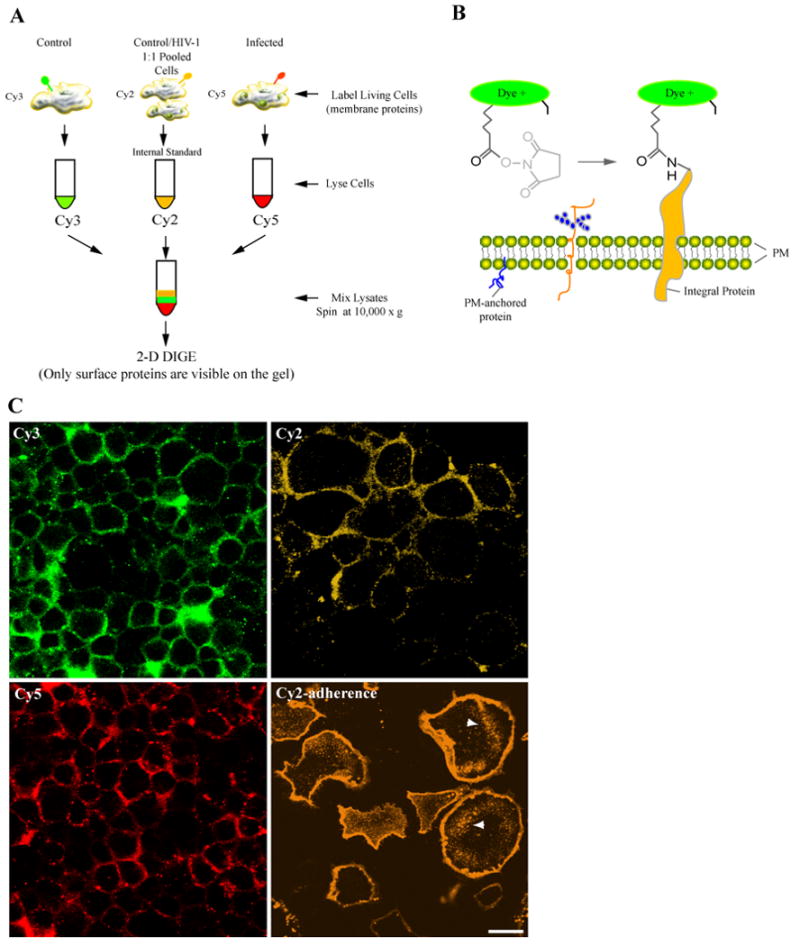
(A) Seven days after isolation and treatment with HIV-1, non-treated and HIV-1-treated monocytes were stained on ice with Cy3 (uninfected), Cy5 (HIV-1), and Cy2 (1:1 ratio of pooled samples) in 2 M urea in HBSS pH 8.0 for 20 min. Reaction was quenched with 10 mM L-lysine and excess dye was removed followed by cells lysis, and 2D-DIGE. (B) The chemistry of minimal labeling is illustrated for CyDyes, which bind to the exposed ε-amine of lysine with an N-hydroxysulfosuccinimide (NHS) ester group through an amide linkage. Staining with CyDyes on ice increases membrane rigidity and reduces dye permeability. (C) Imaging of surface-labeled cells is illustrated. Monocytes grown in Teflon flasks and chamber slides (adherence; lower right panel) were labeled with Cy2, Cy3, and Cy5. Cells were sedimented onto microscope slides, fixed with PFA and examined by confocal microscope. Images show dyes selectively label the PM proteins of live monocytes, and the staining procedure does not compromise the integrity of the PM. Cells grown in adherence show a similar pattern, however dye pinocytosis (indicated by arrows) and swelling were observed (bar = 25 μm).
Impermeability of the PM to fluorescent dyes is a crucial requirement in selective labeling of cell surface proteins. Thus, we tested both PM permeability and active uptake of the CyDye fluorophores by cells grown in suspension and adherence. Cells were counted and 15 × 106 viable cells from HIV-1-treated and non-treated groups were labeled with the Cy3 (control, 10 ×106 cells), Cy5 (virus-infected, 10 × 106 cells), Cy2 (equal ratios of both groups, 10 × 106). Following labeling excess dye was removed; cells were sedimented onto glass slides, and imaged by confocal microscopy. Fig. 1C shows human monocytes stained with Cy2, Cy3 and Cy5. Images indicate that PM in these cells remains intact despite long exposures to high salt labeling solution (1 M urea in, HBSS) and dyes. Most importantly, dyes displayed selective staining of PM proteins and limited permeability of the lipid bilayer. To test whether monocytes grown in adherence displayed similar staining patterns we labeled cells with CyDyes. Unlike cells grown in suspension, Cy2-labeled adherent monocytes (Fig. 1C, bottom right panel) exhibited swollen morphologies and increased dye uptake into intracellular compartments (arrows indicate pinocytic compartments). Cy3 and Cy5-labeled adherent cells demonstrated similar effects (data not shown). Based on these findings, our study investigated only cells grown in suspension.
3.2. Selective labeling of cell surface proteins by CyDyes
To determine whether fractionation of surface-labeled cells was a necessary step for the enrichment of PM proteins, we compared 2D profiles of whole cell lysate from surface-labeled cells and the membrane fraction of cells surface-labeled prior to fractionation. Cy5-labeled (red) non-fractionated cells and the membrane fraction from the Cy3-labeled (green) cells were combined and 2D electrophoresis was performed. Yellow spots in Fig. 2A represent similar proteins present in Cy3- and Cy5-labeled cells. Green and red spots were unique for the fractionated and non-fractionated samples, respectively. Importantly, DeCyder comparison of spot profiles indicated that the fractionation step did not affect significantly the outcome of 2D profiles.
Figure 2. Enrichment of the PM proteome and CyDye labeling.
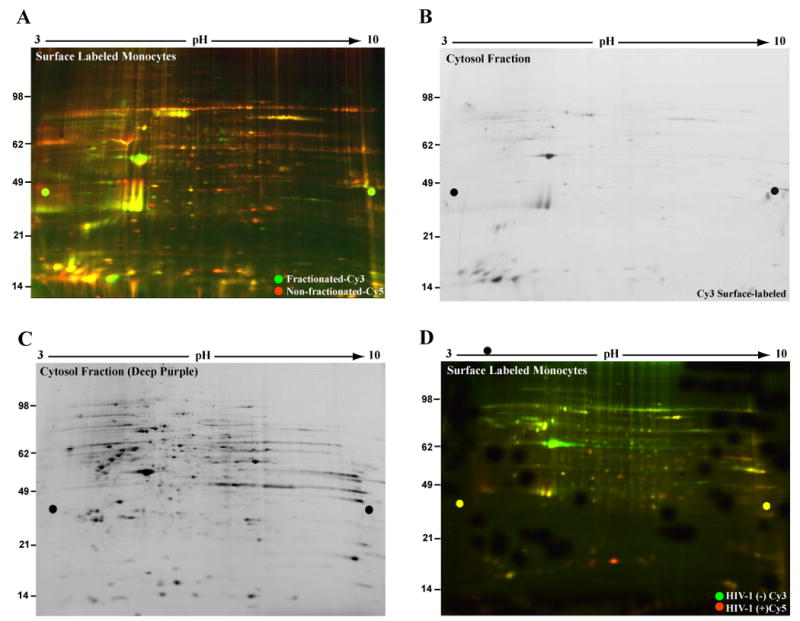
Cells within the same group (not exposed to HIV-1) were surface-labeled with Cy3 and Cy5, washed to remove excess dye and lysed. The Cy3 labeled lysates were fractionated into membrane and cytosol. (A) Cell fractionation and PM proteome enrichment are illustrated. Cy3 membrane fraction and the Cy5 cell lysates were combined and 2D was performed. Image of gel containing the membrane fraction (Cy3, green) and non-fractionated (Cy5, red) cell PM proteins showed considerable overlap (yellow) in spot profiles. This indicates fractionation post-CyDye labeling represents a desired but not necessary step for PM proteome enrichment. (B) Labeling specificity is shown by analysis of the cytosolic fraction of the Cy3-labeled cells. These were screened for fluorescently-labeled cytosolic proteins. Gel image was acquired at identical parameters to those used for the Cy3 membrane fraction and showed very limited Cy3 staining of the cytosolic proteins. (C) CyDye permeability of the PM is limited. Protein abundance of the cytosolic fraction was tested by deep purple stain of gel shown in panel B. Image indicates high protein content further confirming CyDye targeted labeling of the PM proteome. (D) 2D DIGE comparison of non-treated and HIV-1-treated monocytes is illustrated. Representative gel image of 2D DIGE compared PM protein expression profiles of control (Cy3-green) and HIV-1-treated (Cy5-red) non-fractionated monocytes.
To further assess labeling selectivity of the PM proteome, the cytosolic fraction from the Cy3-labeled cells (above) was analyzed separately by 2D for presence of CyDye-stained cytosolic proteins. Fig. 2B shows presence of a limited number of Cy3-positive spots in the cytosolic fraction, most likely due to cross-contamination from the hydrophobic (membrane) fraction. To ensure that the absence of cytosolic stain was due to specificity of PM labeling rather than scarcity of proteins in the cytosolic fraction, the same gel was stained with deep purple fluorescent dye (labels all proteins) and re-scanned. Fig. 2C shows that the cytosolic fraction is rich in protein. This suggests that lack of Cy3 labeling (shown in B) is not due to scarcity of cytosolic proteins in this fraction but rather selective labeling of only PM proteins by CyDyes. Based on these results, we next analyzed PM protein differences between non-fractionated HIV-1-treated and non-treated monocytes.
3.3. HIV-1 transforms the monocyte PM proteome
Prior to proteomic analysis HIV-1ADA life cycle in human monocytes was assayed. At day 7 in culture HIV-1-treated cells demonstrated minimal levels of productive viral growth. Flow cytometry analysis of HIV-1 p24/CD14 indicated limited HIV-1 p24 expression and progeny virion production (<0.01 % of HIV-1 p24+ cells) in HIV-1-exposed monocytes (data not shown). Previous studies have shown that HIV-1 infection of human monocytes in vitro is halted at the pre-entry and pre-integration stages [33-35]. To confirm these findings early and late HIV-1 reverse transcription and long terminal repeat (2-LTR) circles were measured. Limited pre-integration (early and late reverse transcripts, 1500 and 3000 copies per μg of DNA) and very low post-integration activity (1.2 copies per μg of DNA) confirmed that HIV-1 infection of human monocytes in vitro is restricted (data not shown).
Next, quantitative changes in the PM proteome of HIV-1ADA exposed monocytes were assessed by 2D DIGE. Representative gel image shows differentially expressed proteins between untreated and HIV-1-treated monocytes corresponding to spots in green (Cy3-labeled non-treated) and red (Cy5-labeled HIV-1-treated monocytes, Fig. 2D). Prior to analysis, fluorescence intensities for each spot were normalized to those from the Cy2-labeled pooled internal standard. DeCyder analysis identified 986 spots after automatic exclusion of false positive and pseudospots (pharmalyte peaks and dust particles). The DIGE index was set so that ± 2 fold change or higher in protein expression among samples would be recorded. Based on this parameter, DeCyder™ software showed that 67 (7.2%) of the spots classified were upregulated, 172 (12.6%) were downregulated, and 747 (80.2%) were similar. Only proteins identified with 2 or more unique peptides, XC score >20 and P ≤0.05 were included in the analysis. Due to repetitive identifications of post-translationally modified or degraded protein forms with different DIGE indices, several identifications appear in both differentially (Table S1) and similarly (Table S2) expressed lists. Number of unique peptides, molecular weight (MW), and sub-cellular localization pertaining to each protein are provided in the supplementary tables.
3.4. Characterization of the PM proteome
To assess cellular compartmentalization of the identified proteins, searches were performed on the Swiss-Prot/TrEMBL (http://ca.expasy.org/sprot) and Locate/Subcellular Localization (http://locate.imb.uq.edu.au) databases by protein name and/or accession number. Fig. 3 shows classification in sub-cellular compartments of differentially (A) and similarly (B) expressed proteins. Data are presented in percentiles of protein abundance within each compartment to the overall protein abundance within the group (similar or differentially expressed). Results show that 53.5% of all differentially expressed proteins represent PM (38%), secreted (S; 10.3%) and endosomal (E)/lysosomal (L) 5.5% proteins. The PM membrane proteins identified were further classified into integral proteins (7% were multipass, type I and type II), PM anchored proteins (10%) and PM associated and extracellular matrix proteins (21%).
Figure 3. Surface labeling and the PM proteome.

(A-B) Sub-cellular classification of differentially and similarly expressed proteins. The similar and differentially expressed spots were automatically excised from the gels, trypsin-digested and identified by LC/MS-MS. Proteins were classified according to their postulated compartmentalization using Swiss-Prot/TrEMBL and Locate/Subcellular Localization data bases. Proteins pertaining to each cellular compartment [PM, secreted (S), endosomal (E), lysosomal (L), Golgi (G), mitochondria (M), endoplasmic reticulum (ER), cytosol (C), cytoskeleton (CSK), nucleus (N), ubiquitous (U), and not classified (NC)] were shown in percentiles to the overall group of differentially expressed proteins. Graphs in panels A and B show PM and PM-associated proteins are substantially represented on the gels (53 % of the overall characterized proteome). (C) Functional classifications of differentially expressed proteins are illustrated through use of Ingenuity® Software 6.0. This was used to classify proteins pertaining to similar signaling pathways within groups of functional relevance (P< 0.05 and score> 50). Graph shows the major sub-groups of differentially expressed proteins involved in oxidative stress (23%), immune activation (19%), apoptosis (6%), phagocytosis/autophagy (8%), PM turnover/vesicle transport (11%), protein folding/ degradation (8%), cellular morphology and motility (9%), as well as carbohydrate (10%), fatty acid metabolism (1%) and ion transport (5%). Perturbation of such processes may reflect responses to HIV-induced chronic stress and survival strategies of latently infected cells.
Proteins within sub-cellular compartments were classified as follows: 0.4% Golgi (G); 4.8% mitochondria (M; 0.4% mitochondrial membranes); 5.2% endoplasmic reticulum (ER; 2.8% membranes), 11.9% cytosol (C); 6.3% cytoskeleton (CSK); 6.3% nucleus (N; 2% membranes); 3.2% ubiquitous (U; including PM); and 8.7% not classified (NC; including cDNA libraries and putative proteins). Fig. 4B shows that the majority, 60.7%, of similarly expressed proteins are in the PM (39.1%), S (6.4%) and E/L (5.7%). The remainder of the proteins was classified as “other” cellular compartments (1.6% E, 3.6% L, 0.4% G, 4.8% M, 13.9% C, 6.3% CSK, 6.3% N, 3.2% U, and 8.7% NC). Identification of canonically non-PM proteins may be due to various factors. These may reflect contamination with underlying unlabeled cytosolic proteins of the same molecular weight and isoelectric point during spot picking. Albeit limited, cellular disruption due to centrifugation during the labeling procedure may also explain identification of nuclear, mitochondrial and cytosolic proteins. Presence in the PM of endolysosomal, Golgi, ER and secreted proteins may reflect a highly active state of protein transport in the HIV-1-treated cells. More importantly, association of cytosolic (heat shock family) and cytoskeletal proteins (actin, tubulin, profilin) with the PM is well documented and may be indeed due to their specific functions in tight interaction with the PM [36-40].
Figure 4. Surface labeling 2D DIGE and measures of protein expression.
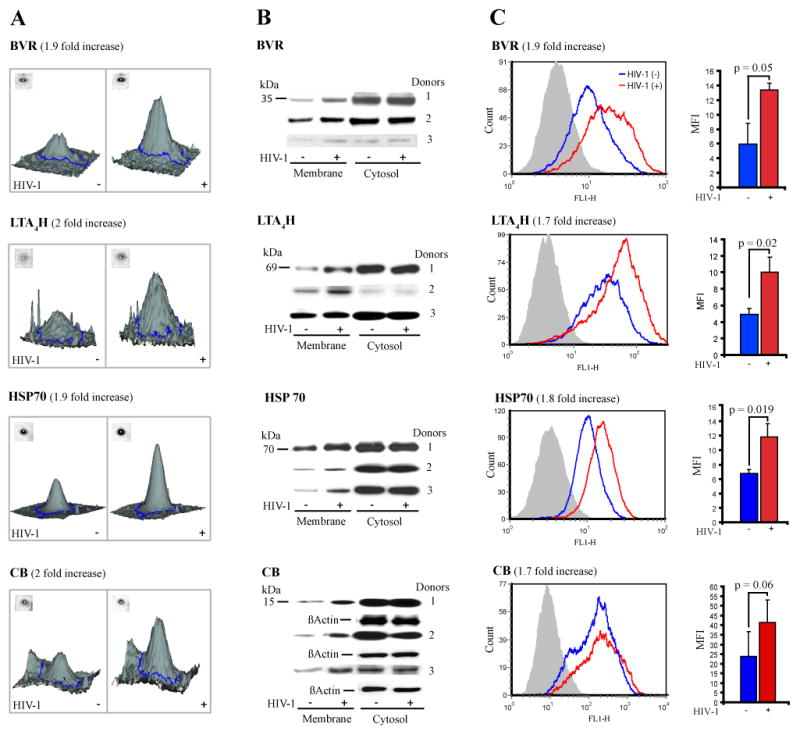
(A) 2D DIGE analysis of differentially expressed proteins is shown. Gel containing protein from Cy3 (non-treated), Cy5 (HIV-1-treated), and Cy2 (1:1 ratio of unlabeled protein from both cell groups, as internal control) was analyzed by DeCyder software and statistics for up regulated, downregulated and similarly expressed spots were generated. Panel A contains DeCyder relievo presentation of the protein spot volume in control (Cy3) and HIV-1 (Cy5) human monocytes. Proteins involved in cell survival and oxidative stress such as BVR (1.9 fold), LTA4H (2 fold), HSP70 (1.9 fold), and CB (2 fold) were upregulated in HIV-exposed monocytes. (B) Immunoblotting served to confirm the 2D DIGE findings. Monocytes collected from three different donors were exposed to HIV-1ADA or left untreated as controls. At day 7 in culture, cells were lysed and fractionated. Western blotting was performed and the membrane and cytosolic fractions were stained against rabbit anti-BVR, -LTA4H, -HSP70, mouse anti-CB and HRP-conjugated secondary Ab. Loading controls were generated by re-probing the cytosolic fractions against β-actin. Data shows these proteins are consistently upregulated in the membrane fraction of HIV-exposed cells in all donors. (C) Flow cytometry served to support protein expression and PM localization. Cells at day 7 were stained for BVR, LTA4H, and CB primary Ab, Alexa 488–conjugated secondary Ab, and HSP70-FITC for 1 h. Cells stained with IgG1-FITC conjugated isotype and secondary Ab were used to test for binding specificity (panel C, in gray). Cells were analyzed by flow cytometry post-fixation. Images in panel C (left) show upregulated PM expression in HIV-1-treated (red) compared to non-treated (blue). MFI values for each protein were normalized to those from the pertaining secondary and isotype controls. Average MFI for each cell group and from three independent experiments (3 donors) is shown for each protein. Analysis (panel C, right) showed statistically significant increase of MFI in HIV-exposed cells (red) for BVR (1.9 fold), LTA4H (1.7 fold), HSP70 (1.8 fold), and CB (1.7 fold) consistent with 2D DIGE results (P≤ 0.05; error bars= ± STDEV; n=3).
3.5. HIV-1 induces oxidative stress in monocytes
To identify cellular processes altered during restricted infection, we used Ingenuity® Pathway Analysis (Ingenuity Systems, Redwood City, CA). Differentially expressed proteins pertaining to distinct cellular processes were grouped according to their canonical function and presented in Fig. 3C. Cellular processes such as oxidative stress (23%), immune activation (19%), apoptosis (6%), phagocytosis/autophagy (8%), PM turnover/vesicle transport (11%), protein folding/degradation (8%), cellular morphology and motility (9%), as well as carbohydrate (10%), fatty acid metabolism (1%) and ion transport (5%) were altered in latently infected monocytes. Modulation of cellular immune response such as oxidative stress and inflammation may be a reaction to restricted HIV replication. Indeed, induction of tumor necrosis factor alpha (TNF-α) and consequently ROS results in two seemingly divergent processes such as enhanced viral infection [29, 41-43] and improved cell survival [44-46]. Accordingly, Ingenuity analysis-indicating presence of oxidative stress activators and anti-apoptotic factors supports this notion.
3.6. Redox and cell activation proteins are translocated to the PM
Next, we addressed the functional consequences of cytosolic protein association with the PM during restricted infection. We focused on BVR, LTA4H, HSP70 and CB (traditionally localized in the cytosol) and their association with the PM during cellular activation and oxidative stress. Our rationale was based on well documented involvement of these proteins in the cross-talk between immune-activation, oxidative stress and cell survival activities [47-51]. 2D DIGE and LC-MS/MS showed BVR (2 unique peptides identified, P≤ 0.007), LTA4H (17 peptides, P≤ 0.0001), HSP70 (6 peptides, P≤ 0.0005), CB (3 peptides, P≤ 0.002), were present in the PM of both control and HIV-treated monocytes and up-regulated approximately 2 fold in the latter (Fig. 4A). To confirm these findings we performed Western blotting for BVR, LTA4H, HSP70 and CB in both membrane and cytosolic fractions from non-treated and HIV-1-treated cells and in three different donors. Staining for β-actin of the cytosolic fraction was used as loading control and representative blots are shown in Fig. 4B. Results demonstrated BVR, LTA4H, HSP70, and CB were upregulated in the membrane fraction of HIV-1-treated cells for all donors.
To confirm localization and increased presence of these proteins in the PM, we performed flow cytometry on non-permeabilized HIV-1-treated and non-treated cells (Fig. 4C). Protein expression was measured in mean fluorescence intensity (MFI) for three different donors. Fold changes were generated as MFI ratios following normalization to the MFI levels from the isotype and secondary Ab controls. The DIGE index for BVR indicated a 1.9-fold increase in HIV-1-treated monocytes. Flow cytometry analysis indicated a significant (P= 0.05) 1.9 fold increase in HIV-1-treated cells. DIGE results were also confirmed for LTA4H (DIGE index = 2.0; MFI =1.7; P =0.02), HSP70 (DIGE index= 1.9; MFI =1.8; P =0.0019), and CB (DIGE index = 2.0; MFI =1.7; P =0.06). Confirmation of 2D DIGE findings by two independent approaches, and identification of more than 53% of PM and PM-associated proteins indicate that the surface-labeling method is efficient and accurate in quantitating alterations in protein expression.
3.7. BVR, LTA4H, HSP70 and CB are PM associated
To distinguish between localization of these proteins in the PM and other cellular membranes, monocytes (HIV-1-treated and control) stained with Ab against BVR, LTA4H, HSP70, and CB and fluorescent secondary Ab were fixed with PFA, sedimented onto glass slides by cytocentrifugation and analyzed by confocal microscopy (Fig. 5A). Cells stained with IgG1 isotype and secondary Ab were used as staining controls (data not shown). Confocal images show distinct and increased presence of BVR, LTA4H, HSP70, and CB in the PM of virus-treated cells.
Figure 5. Increased translocation to the PM of BVR, LTA4H, HSP70 and CB in HIV-1-treated cells.
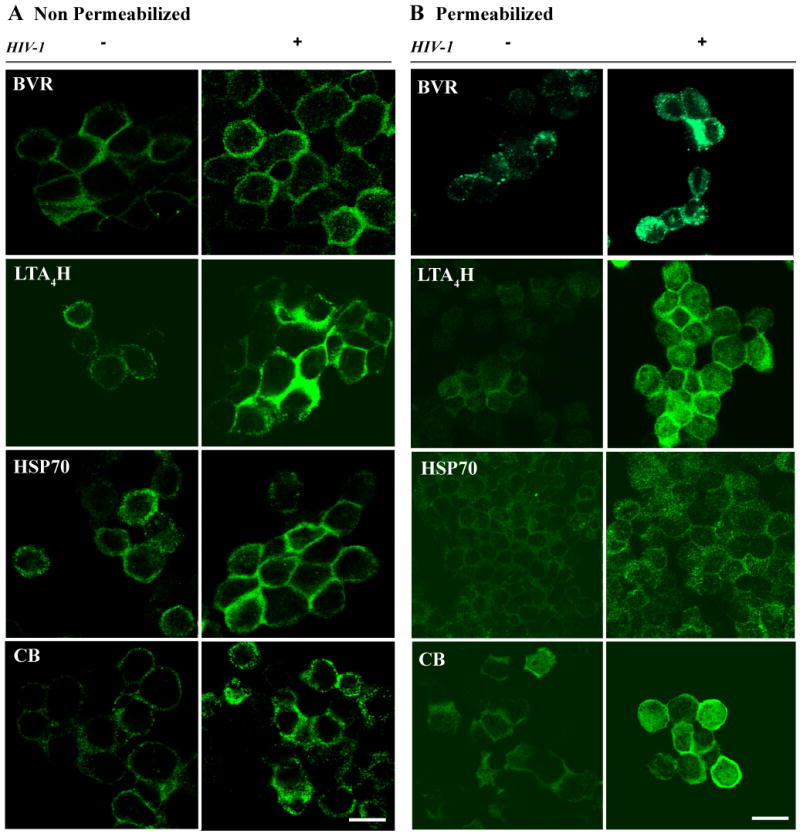
Cells (HIV- and +) were stained against BVR, LTA4H, HSP70 and CB proteins either prior (A) or post-permeabilization (B). After staining, cells were washed, sedimented into cytoslides, and imaged by confocal microscope. Scanning acquisition parameters such as intensity gain, background offset, brightness and contrast were maintained identical between HIV-1 and control cells, stained for the same protein. Images from non-permeabilized (A) and permeabilized (B) cells show specific and increased localization of BVR, LTA4H, HSP70 and CB to the PM in HIV-1-treated cells (bar 25 μm).
To observe the general cellular distribution of these proteins and exclude the possibility that the observed PM staining was due to Ab internalization, untreated control and HIV-1 treated cells were fixed and permeabilized prior to staining against BVR, LTA4H, HSP70 and CB. Cells were sedimented on glass slides and analyzed by confocal microscopy. Scanning parameters such as laser settings, brightness and contrast intensity for images in Fig. 5 were kept equivalent for both treated and control cells stained for the same protein. Images in panel B show increased localization of BVR, LTA4H, HSP70, and CB at the PM of HIV-1-treated monocytes.
3.8. HIV-1 induced oxidative stress
Previous studies demonstrated that HIV-1 induced depletion of glutathione and superoxide dismutase results in accumulation of peroxynitrites, which in turn enhance viral replication in infected cells [52-54]. Concurrent up regulation of redox proteins and hROS obviate lipid peroxydation and cell death [55]. A principal question is whether there was a parallel functional role for the upregulation and transformation of proteins to the PM. Thus, we next investigated the role of PM BVR, LTA4H, HSP70 and CB in association with the PM. We realized there are multitudes of protein functions linked to a broad spectrum of biological endpoints. The work we pursued was in fact one of many possibilities in attempts to provide an example of how the proteins discovered and differentially localized in the cells could affect cell functional endpoints. Oxidative stress using APF was used widely to detect singlet oxygen, superoxide, hydrogen peroxide, nitric oxide, and alkyl peroxide hROS. Fig. S1 A HIV-1 exposed cells displayed significantly elevated (P= 0.008) oxidative changes compared to controls in three independent experiments (3 donors). Cell death was measured by flow cytometry of propidium iodide (PI) stained cells. Results seen in Fig. S1 C show limited death (with less than 2% of cells at the G0 arrested stage shown as M1) between HIV-exposed and controls.
Next we determined whether association of BVR, HSP70, LTA4H and CB with the PM and the outcomes of cell survival were specific to HIV-1. We performed dose response experiments using PMA to induce similar levels of ROS and cell death as demonstrated for HIV-1. Cells were likewise labeled with APF followed by 1 h incubation with 10, 50, and 100 ng/mL of PMA. MFI values were generated for three independent experiments. Results indicated that 10 ng/mL of PMA mimicked the ROS levels induced by HIV-1. Cells treated with 10 ng/ml of PMA for 1 h then stained with Annexin V (phophatidylserine, PS staining, apoptosis) and PI (fragmented DNA, necrosis) and analyzed by flow cytometry demonstrated that 10 ng/ml PMA induced necrosis (4.14%) at levels similar to HIV-1-treated cells (Fig. S1 D).
3.9. Transport of BVR, LTA4H, HSP70 and CB to the PM is linked to cell viability
To determine whether PM-associated BVR, LTA4H, HSP70 and CB play cytoprotective roles in oxidative stress, we investigated the effects of treatment with Ab against these proteins. Cells were incubated with Ab to selected proteins for 1 h followed by a 30 min treatment with PMA. Control and PMA-treated cells were tested for apoptotic and necrotic activities by co-staining with Annexin V and PI and analyzed by flow cytometry. PMA- and mock-treated cells (Fig. 6A) were used to test the effects of staining procedure on cell viability. Fig. 6A demonstrates that procedure-related cell death amounted to 10%. This group was used to normalize the results obtained for Ab- and PMA-treated cells. Figure 6B shows that treatment with Ab to BVR and LTA4H had limited effects on cell viability. BVR neutralization resulted in a decrease of necrosis by 5% and apoptosis by 1.8%, while incubation with the LTA4H Ab minimally reduced necrosis by 2.9%, and had no effect on apoptosis. Neutralization of HSP70 reduced necrosis 3-fold (to 4%) and had no effect on apoptosis. Conversely, incubation with Ab against CB induced a 2-fold increase in both necrosis (15% in cell treated only with PMA to 30% in Ab- and PMA-treated cells) and apoptosis (from 3.3 % to 6%). PMA-treated cells were incubated in a similar manner with isotype mouse and rabbit Ab to ensure the observed effects were specific to BVR, LTA4H, HSP70 and CB. Representative data in Fig. 6C showed that indeed treatment with the isotype antibodies did not affect cell viability. Next, we investigated whether these alterations in cell viability were due to effects of Ab-protein binding on oxidative stress. Cells exposed to PMA and Ab against BVR, LTA4H, HSP70 and CB were incubated with AFP, and hROS levels were measured in MFI units. A slight insignificant increase in hROS levels in cells neutralized for CB and no major fluctuations in other cell groups were observed (data not shown). Collectively, these data suggest that PM-associated BVR, HSP70 and CB activities are responsive, rather than causative, factors of oxidative stress and influence the cell survival.
Figure 6. Treatment with Ab against PM translocated proteins and cell viability.
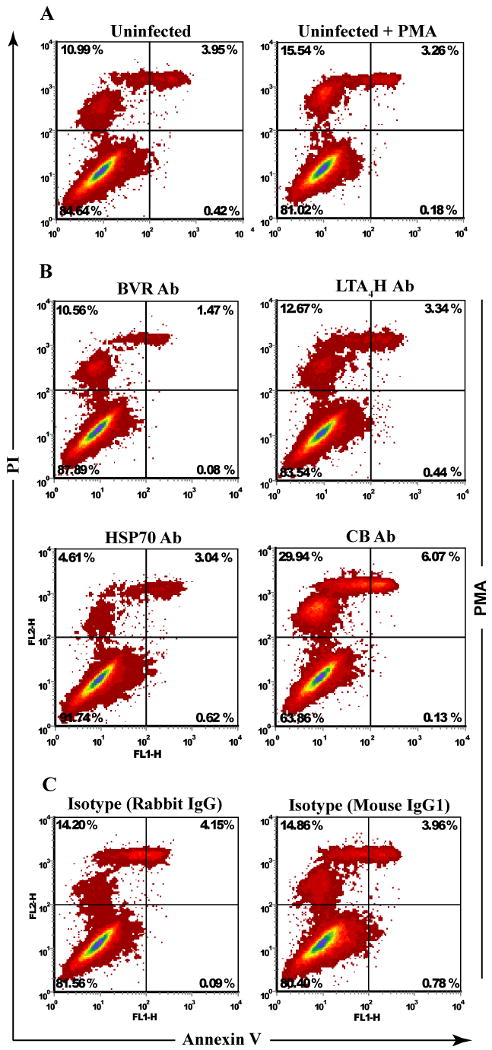
Monocytes at day 7 in culture were treated with excess (20 μg/5 × 105 cells) Ab against BVR, LTA4H, HSP70 and CB. Cells were incubated with PMA for 1 h and stained with Annexin V and PI to test for apoptosis and necrosis. (A) Cells without and with PMA were used as base line control for the procedure-related cell death. (B) Flow analysis shows block of PM associated BVR, LTA4H modestly affects cell death, block of HSP70 and CB reduced and increased necrosis 3 and 2 fold respectively. (C) Cells treated with PMA and isotype rabbit and mouse Ab were used to test for Ab-specific effects. Flow cytometry analysis demonstrated treatment with isotype Ab did not alter the cell death activity and yielded similar levels of apoptosis and necroses as those observed in the cells treated with PMA alone.
3.10. PMA and HIV-1 affect divergent cell death pathways
To determine whether PMA-induced expression of BVR, LTA4H, HSP70 and CB at the PM followed the same pattern as in HIV-infected cells, we performed confocal analysis on cells treated with PMA alone. Surprisingly, unlike HIV-infected cells, PMA-treated cells in Fig. 7A showed a down regulation of BVR, LTA4H and HSP70 and augmented presence of CB at the PM. We further investigated cellular distribution of BVR, LTA4H, HSP70 and CB under acute (PMA-induced) or chronic (HIV) oxidative stress in the presence of VE. HIV-1-treated cells were exposed to VE with or without PMA or left untreated as controls. Cells (untreated, HIV-1-treated, PMA-, VE, and VE- and PMA-treated) at day 7 in culture were fractionated into membrane and cytosol and analyzed by Western blotting. Re-probing the blotting membranes against β-actin generated loading controls.
Figure 7. Translocation of proteins to the PM affect HIV-1 induced cell death.
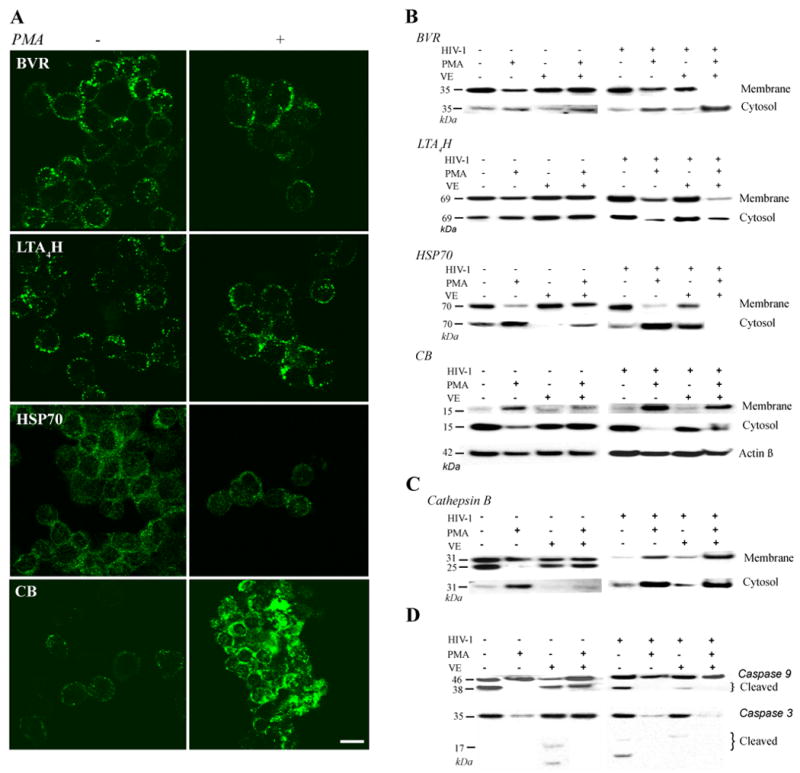
(A) Control (untreated) and PMA-treated (1 h incubation) cells stained for BVR, LTA4H, HSP70, and CB were sedimented on cytoslides, fixed and analyzed by confocal microscope. Scanning parameters were kept constant amongst all control and experimental components. PMA-induced oxidative stress revealed opposite trends of expression for BVR, LTA4H, and HSP70 and similar for CB compared to HIV-1. Images show a reduced presence of BVR, LTA4H, HSP70 and enhanced CB presence at the PM. (B) Immunoblotting of membrane and cytosolic fractions of uninfected and infected cells treated with PMA show decreased levels of BVR, LTA4H, and HSP70 at the PM due to their relocation to the cytosol. PMA-treated HIV-1 cells show maximal and minimal presence in the cytosol for CB and HSP70, respectively. Treatment with vitamin E (VE) restored protein levels to the PM. (C) Staining for cathepsin B of the membrane and cytosolic fractions showed an increase in the cytosol of HIV-1-treated cells exposed to PMA and cells exposed to PMA alone. Treatment with VE of these cells resulted diminished presence of cathepsin B in the cytosol. (D) Western blotting analysis on the cytosolic fraction showed no presence of caspase 9 and 3 cleavage activity in HIV-1-treated and non-treated cells exposed to PMA. Indicating PMA-induced oxidative stress initiates cathepsin B-dependent caspase 3, 9-independent necrosis. However, attenuation of oxidative stress by VE increased caspase cleavage in PMA-treated and HIV-1 infected cells suggesting a shift from sudden to controlled cell death.
Fig. 7B shows decreased levels of BVR, LTA4H, and HSP70 in the membrane fraction and increased presence in the cytosolic fraction of cells exposed to PMA alone. CB showed opposite expression trends by appearing more robust in the membrane fraction than in the cytosol of PMA-treated cells compared to the untreated (HIV-) controls. Cells exposed to both HIV-1 and PMA showed similar trends as those exposed to PMA alone; however more dramatic changes in protein expressions were observed indicating a synergy between HIV-1 and PMA in oxidative stress built-up and consequently cell death. Considering cells were exposed briefly to PMA, together, these results suggest that BVR, LTA4H, HSP70 and CB are re-distributed rather than synthesized de novo in response to elevated levels of oxidative stress.
3.12. VE restores translocation of BVR, BVR, LTA4H, HSP70 and CB to the PM and regulates cell death
Next, we investigated whether dampening of the oxidative response would restore BVR, LTA4H, HSP70 and CB distribution to that seen in cells under physiological conditions. We determined optimal levels of VE by performing dose response experiments and using ROS measurement as a read out method (data not shown). VE has been shown to exert its effects by binding directly to the phospholipids, neutralizing ROS and inhibiting cyclooxygenase-2 (COX-2) activity [56, 57]. Fig. 7B shows that in monocytes non-treated and treated with HIV-1 and exposed to PMA, VE restores BVR, HSP70 and CB in the PM and cytosol to levels observed in control cells. However, VE did not have an effect in cell activation levels as reflected by the unchanged levels of expression for LTA4H. In cells exposed to both PMA and HIV-1, VE does not overcome the effects of the overwhelming oxidative stress build up. This was reflected by the unchanged levels in protein distribution to the PM compared to those observed in PMA-treated cells. Collectively these findings showed increased association of BVR, HSP70, LTA4H and CB to the PM suggest monocytes may initiate stimuli-dependent and distinct responses to oxidative stress.
The effects of Ab-mediated protein block together with the VE-induced restoration of these proteins to the PM in PMA-treated cells hinted for their involvement in cellular survival. Next, we determined whether HIV-1-induced chronic oxidative stress and PMA-induced acute oxidative burst activated similar cell death pathways. To distinguish between apoptotic and necrotic processes, Western blots were performed for cathepsin B and caspase 3 and 9. The rationale for this approach was based on the well documented involvement of cathepsin B in both necrosis and caspase-regulated apoptosis. Studies have shown that sudden increase in the presence of the lysosomal enzymes, such as cathepsins in the cytosol, is a distinguishing marker for necrosis [44, 58-60]; however slow leakage of cathepsin B from the lysosomes into the cytosol and combined with activation of the caspase 9, 3 pathway is an indicator for apoptosis [59-61].
Indeed, cells undergoing severe oxidative stress (PMA-treated alone and PMA/HIV-treated monocytes) revealed elevated levels of cytosolic cathepsins B compared to the other cell groups. VE-treatment decreased cytosolic Cathepsin B (Fig. 7C). Interestingly, cathepsin B distribution in the cytosol and PM paralleled that of BVR, LTA4H, HSP70, and opposed that of CB. These findings, together with previous reports that associated the presence of CB-cathepsin B cytosolic complexes with sudden cell death [58, 59, 62, 63], suggest that shuttling of CB from the cytosol to the PM may affect protein complexes and consequently the outcome of cell death. Next, we investigated whether presence of elevated levels of cathepsin B in the cytosolic fraction were associated with the activation of the caspase 9, 3 pathway. Fig. 7D shows the presence of cleaved forms of caspase 9 in both control and HIV-infected cells treated with VE and no cleavage in PMA-treated cells. Downstream activation of caspase 3 was observed only in VE treated control and HIV-infected cells and in HIV-infected cells with no treatment. These data support the divergent roles of PMA in monocyte necrosis and HIV-1 for apoptosis. Necrotic events in the PMA-treated cells follow cathepsin B mediated and caspase-independent pathways. Treatment with VE restores the cellular control over apoptosis, as shown in HIV-1-infected VE treated cells.
4. Discussion
We applied live fluorescent labeling of monocyte surface proteins followed by 2D DIGE analyses to investigate changes in the cell proteome affected by HIV-1 exposure [35, 64, 65]. Despite viral restriction, a pro-inflammatory cell phenotype was induced associated with alterations in redox processes. Indeed, virus-exposed cells showed high levels of ROS with minimal necrosis. Importantly, our findings mimic an in vivo study showing that circulating blood monocytes from AIDS patients sustain high levels of ROS which parallel changes in viral load and are associated with upregulation of anti-apoptotic and antioxidant proteins, such as Bcl-2 and thioredoxin [29].
Several notable observations were made in this study. First, we characterized the PM proteome of restricted infection of monocytes exposed to virus to investigate how the cell copes with chronic inflammation and stress during restricted HIV-1 replication. Second, we quantified changes in protein expression on the PM by using live cell labeling with fluorescent dyes followed by 2D DIGE. Without any prior reduction in sample complexity, a 53% efficiency rate was seen in identifying PM proteins. Third, we characterized major cellular functions being altered regardless of the restricted infection. Global analysis of PM protein participation in canonical signaling networks using Ingenuity® software revealed distinct alterations in oxidative stress and cell activation pathways.
Cellular activation pathways are known to be accompanied by a respiratory burst and the production of ROS (O2-, H2O2 and NO) [66]. In particular, in HIV-infected cells peroxynitrites synergize with interleukin-1 (IL-1) and tumor necrosis factor alpha (TNF-α) in activating the nuclear factor-kappa B (NF-κB) pathway and inducing HIV LTR trans-activation and increased HIV-1 replication MP [62, 67-69]. These events in chronically infected cells are associated with suppression of cytosolic levels of glutathione [29, 41-43]. Parallel to the synergy with the ROS, TNF-α can improve monocyte survival by upregulating Bcl-2 and Bcl-xL through NF-κB-independent and dependent pathways, respectively [44, 46].Consistent with these observations, we show that four proteins implicated in redox, cell activation and death and traditionally located in the cytosol were found to be present at high levels in the PM.
LTA4H belongs to the zinc metalloproteinase family and cleaves leukotriene A4 to its active secreted form LB4 during immune activation and leukotriene secretion [48]. Previous studies from our laboratory have shown LTA4H as a cell activation marker that is heavily secreted by productively infected monocyte-derived macrophages [27]. LTA4H may engage in intercellular communication, where the protein released by one cell is used as a hydrolase in another [70]. In the current study, LTA4H was used as a marker of chronic activation and immunoassays were run in parallel to assess levels of oxidative stress. BVR, the enzyme responsible for conversion of biliverdin (toxic) to bilirubin (potent antioxidant for peroxynitrites) is a major redox cytoprotectant through its involvement in the heme-oxygenase-biliverdin-carbon monoxide pathway and inhibition of nitric oxide synthase [47, 49].
HSP70, previously characterized as chaperone, regulates apoptosis in response to heat shock and oxidative stress by preventing release of cathepsins and cytochrome C [71]. This protein prevents lysosome-mediated sudden death by binding to lysosomal cathepsins B, D, L and H and by providing structural stability to the lysosomal membranes [72]. In the context of HIV-1 infection, HSP70 promotes cell survival by inhibiting Vpr-induced apoptosis [73]. When associated with PM, HSP70 has been shown to promote metastatic progression and reduced cell death in cancer cells [72]. It has also been shown that HSP70 secretion by polymorphonuclear phagocytes is not related to cell damage, but rather represents a distinct mechanism involving lysosomal transport and lipid rafts [36]. Previous studies demonstrated that HSP70 stabilizes the lysosomal membranes thus inhibiting lysosomal-induced necrosis [72].
Our findings on HSP70 suggest that its translocation to the PM may reflect HIV-induced cellular attempts to provide extra structural stability to the lysosomal membranes during transport to the PM but more importantly to reduce the risk of necrosis by eliminating cathepsin spill into the cytosol. Under acute oxidative stress, monocytes may attempt to eliminate these enzymes from the cytosol; however, immediate peroxydation of lysosomal membranes does not permit this mechanism to go to completion. This would explain reduced levels of HSP70, BVR in the membrane of PMA-treated cells and restored levels of these proteins when cells are treated with VE. Interestingly, VE reduced levels of cathepsin B in the cytosol and increased caspase 9 and 3 cleavage activity in uninfected cells; in contrast, it reduced both presence of cathepsin B and cleaved caspases in HIV-1-treated cells. This suggests that VE-mediated preservation of the integrity of the membranes may induce a switch from cathepsin B-induced necrosis to cathepsin B-independent caspase 9, 3-dependent apoptosis.
Cystatins, among their other roles, are characterized as regulators of protein degradation in the lysosomes and inhibitors of cysteine proteases (cathepsins). Previous studies have shown that dissociation of CB from cathepsin B greatly improves cell survival [58, 61, 63]. In the context of HIV-1 infection, it is proposed they interact with IFN-γ to induce synthesis of IL-10, TNF-α, and NO [50]. Our data showing massive necrosis in cells treated with CB Ab and PMA may be explained by previous findings, which suggest that increased levels of TNF-α and NO in the cytosol promote movement of CB-cathepsin B complexes from the lysosomes into the cytosol causing sudden cell death [60, 74, 75]. Enhanced transport of CB to the PM under acute oxidative stress compared to chronic conditions may reflect a mechanism of protection aimed to reduce both the presence of CB-cathepsin B complexes and CB-induced TNF-α and NO in the cytosol.
In conclusion, we show that HIV-1 induces major PM proteome changes in human monocytes, together with chronic activation and sustained production of ROS. These events, together with redox protein translocation to the PM, may represent attempts of the virus to overcome the replication block without compromising host cell survival. We also found that, unlike cathepsin B-induced necrosis during acute oxidative burst, HIV-1 regulates cell death through activation of cathepsin B-independent caspase 9, 3 pathway. These findings are relevant in the context of HIV-associated neuropathies as they may provide insights into the metabolic status of the infected circulating monocytes pre- and post- infiltration into the brain. Additionally, these studies will expand our understanding on how innate immune components exert in tandem both powerful pathogen killing responses and self-protection from harmful radicals.
Supplementary Material
Acknowledgments
We would like to thank R. Taylor and Dr. R.L. Mosley for critical reading of the manuscript and editorial assistance. We also acknowledge the support given by Dr. C. Kuszynski from the flow cytometry, J. Taylor and J. Talaska from the confocal core facilities at the University of Nebraska Medical Center and Dr. R. Cerny from the proteomics core at Nebraska Center for Virology.
Footnotes
Grant support: Support for research was provided by National Institutes of Health Grants 2R37 NS36126, PO1 NS31492, 2R01 NS034239, P20RR15635, P20RR15635, P30 AI42845, U54NS43011-01, P01MH64570, 1T32 NS07488, P01 NS43985 and from Baxter Healthcare (to H.E.G)
Publisher's Disclaimer: This is a PDF file of an unedited manuscript that has been accepted for publication. As a service to our customers we are providing this early version of the manuscript. The manuscript will undergo copyediting, typesetting, and review of the resulting proof before it is published in its final citable form. Please note that during the production process errors may be discovered which could affect the content, and all legal disclaimers that apply to the journal pertain.
References
- 1.Peirce MJ, Saklatvala J, Cope AP, Wait R. Mapping lymphocyte plasma membrane proteins: a proteomic approach. Methods Mol Med. 2007;136:361–7. doi: 10.1007/978-1-59745-402-5_25. [DOI] [PubMed] [Google Scholar]
- 2.Peirce MJ, Wait R, Begum S, Saklatvala J, Cope AP. Expression profiling of lymphocyte plasma membrane proteins. Mol Cell Proteomics. 2004;3:56–65. doi: 10.1074/mcp.M300064-MCP200. [DOI] [PubMed] [Google Scholar]
- 3.Santoni V, Molloy M, Rabilloud T. Membrane proteins and proteomics: un amour impossible? Electrophoresis. 2000;21:1054–70. doi: 10.1002/(SICI)1522-2683(20000401)21:6<1054::AID-ELPS1054>3.0.CO;2-8. [DOI] [PubMed] [Google Scholar]
- 4.Krogh A, Larsson B, von Heijne G, Sonnhammer EL. Predicting transmembrane protein topology with a hidden Markov model: application to complete genomes. J Mol Biol. 2001;305:567–80. doi: 10.1006/jmbi.2000.4315. [DOI] [PubMed] [Google Scholar]
- 5.Adessi C, Miege C, Albrieux C, Rabilloud T. Two-dimensional electrophoresis of membrane proteins: a current challenge for immobilized pH gradients. Electrophoresis. 1997;18:127–35. doi: 10.1002/elps.1150180124. [DOI] [PubMed] [Google Scholar]
- 6.Hurley WL, Finkelstein E, Holst BD. Identification of surface proteins on bovine leukocytes by a biotin-avidin protein blotting technique. J Immunol Methods. 1985;85:195–202. doi: 10.1016/0022-1759(85)90287-x. [DOI] [PubMed] [Google Scholar]
- 7.Sabarth N, Lamer S, Zimny-Arndt U, Jungblut PR, Meyer TF, Bumann D. identification of surface proteins of Helicobacter pylori by selective biotinylation, affinity purification, and two-dimensional gel electrophoresis. J Biol Chem. 2002;277:27896–902. doi: 10.1074/jbc.M204473200. [DOI] [PubMed] [Google Scholar]
- 8.Adam PJ, Boyd R, Tyson KL, Fletcher GC, Stamps A, Hudson L, Poyser HR, Redpath N, Griffiths M, Steers G, Harris AL, Patel S, Berry J, Loader JA, Townsend RR, Daviet L, Legrain P, Parekh R, Terrett JA. Comprehensive proteomic analysis of breast cancer cell membranes reveals unique proteins with potential roles in clinical cancer. J Biol Chem. 2003;278:6482–9. doi: 10.1074/jbc.M210184200. [DOI] [PubMed] [Google Scholar]
- 9.Simpson RJ, Connolly LM, Eddes JS, Pereira JJ, Moritz RL, Reid GE. Proteomic analysis of the human colon carcinoma cell line (LIM 1215): development of a membrane protein database. Electrophoresis. 2000;21:1707–32. doi: 10.1002/(SICI)1522-2683(20000501)21:9<1707::AID-ELPS1707>3.0.CO;2-Q. [DOI] [PubMed] [Google Scholar]
- 10.Link AJ, Eng J, Schieltz DM, Carmack E, Mize GJ, Morris DR, Garvik BM, Yates JR., 3rd Direct analysis of protein complexes using mass spectrometry. Nat Biotechnol. 1999;17:676–82. doi: 10.1038/10890. [DOI] [PubMed] [Google Scholar]
- 11.Wu CC, MacCoss MJ, Howell KE, Yates JR., 3rd A method for the comprehensive proteomic analysis of membrane proteins. Nat Biotechnol. 2003;21:532–8. doi: 10.1038/nbt819. [DOI] [PubMed] [Google Scholar]
- 12.Gygi SP, Rist B, Gerber SA, Turecek F, Gelb MH, Aebersold R. Quantitative analysis of complex protein mixtures using isotope-coded affinity tags. Nat Biotechnol. 1999;17:994–9. doi: 10.1038/13690. [DOI] [PubMed] [Google Scholar]
- 13.Ross PL, Huang YN, Marchese JN, Williamson B, Parker K, Hattan S, Khainovski N, Pillai S, Dey S, Daniels S, Purkayastha S, Juhasz P, Martin S, Bartlet-Jones M, He F, Jacobson A, Pappin DJ. Multiplexed protein quantitation in Saccharomyces cerevisiae using amine-reactive isobaric tagging reagents. Mol Cell Proteomics. 2004;3:1154–69. doi: 10.1074/mcp.M400129-MCP200. [DOI] [PubMed] [Google Scholar]
- 14.Chevallet M, Santoni V, Poinas A, Rouquie D, Fuchs A, Kieffer S, Rossignol M, Lunardi J, Garin J, Rabilloud T. New zwitterionic detergents improve the analysis of membrane proteins by two-dimensional electrophoresis. Electrophoresis. 1998;19:1901–9. doi: 10.1002/elps.1150191108. [DOI] [PubMed] [Google Scholar]
- 15.Rabilloud T, Adessi C, Giraudel A, Lunardi J. Improvement of the solubilization of proteins in two-dimensional electrophoresis with immobilized pH gradients. Electrophoresis. 1997;18:307–16. doi: 10.1002/elps.1150180303. [DOI] [PMC free article] [PubMed] [Google Scholar]
- 16.Rabilloud T, Luche S, Santoni V, Chevallet M. Detergents and chaotropes for protein solubilization before two-dimensional electrophoresis. Methods Mol Biol. 2007;355:111–9. doi: 10.1385/1-59745-227-0:111. [DOI] [PubMed] [Google Scholar]
- 17.Jang JH, Hanash S. Profiling of the cell surface proteome. Proteomics. 2003;3:1947–54. doi: 10.1002/pmic.200300563. [DOI] [PubMed] [Google Scholar]
- 18.Mayrhofer C, Krieger S, Allmaier G, Kerjaschki D. DIGE compatible labelling of surface proteins on vital cells in vitro and in vivo. Proteomics. 2006;6:579–85. doi: 10.1002/pmic.200500104. [DOI] [PubMed] [Google Scholar]
- 19.Meltzer MS, Gendelman HE. Mononuclear phagocytes as targets, tissue reservoirs, and immunoregulatory cells in human immunodeficiency virus disease. Curr Top Microbiol Immunol. 1992;181:239–63. doi: 10.1007/978-3-642-77377-8_9. [DOI] [PubMed] [Google Scholar]
- 20.Zhu T, Mo H, Wang N, Nam DS, Cao Y, Koup RA, Ho DD. Genotypic and phenotypic characterization of HIV-1 patients with primary infection. Science. 1993;261:1179–81. doi: 10.1126/science.8356453. [DOI] [PubMed] [Google Scholar]
- 21.Cheng-Mayer C, Levy JA. Human immunodeficiency virus infection of the CNS: characterization of “neurotropic” strains. Curr Top Microbiol Immunol. 1990;160:145–56. doi: 10.1007/978-3-642-75267-4_9. [DOI] [PubMed] [Google Scholar]
- 22.Heinzinger N, Baca-Regen L, Stevenson M, Gendelman HE. Efficient synthesis of viral nucleic acids following monocyte infection by HIV-1. Virology. 1995;206:731–5. doi: 10.1016/s0042-6822(95)80097-2. [DOI] [PMC free article] [PubMed] [Google Scholar]
- 23.Kedzierska K, Crowe SM, Turville S, Cunningham AL. The influence of cytokines, chemokines and their receptors on HIV-1 replication in monocytes and macrophages. Rev Med Virol. 2003;13:39–56. doi: 10.1002/rmv.369. [DOI] [PubMed] [Google Scholar]
- 24.Schuitemaker H, Kootstra NA, Koppelman MH, Bruisten SM, Huisman HG, Tersmette M, Miedema F. Proliferation-dependent HIV-1 infection of monocytes occurs during differentiation into macrophages. J Clin Invest. 1992;89:1154–60. doi: 10.1172/JCI115697. [DOI] [PMC free article] [PubMed] [Google Scholar]
- 25.Lewin SR, Kirihara J, Sonza S, Irving L, Mills J, Crowe SM. HIV-1 DNA and mRNA concentrations are similar in peripheral blood monocytes and alveolar macrophages in HIV-1-infected individuals. AIDS. 1998;12:719–27. doi: 10.1097/00002030-199807000-00008. [DOI] [PubMed] [Google Scholar]
- 26.McElrath MJ, Pruett JE, Cohn ZA. Mononuclear phagocytes of blood and bone marrow: comparative roles as viral reservoirs in human immunodeficiency virus type 1 infections. Proc Natl Acad Sci U S A. 1989;86:675–9. doi: 10.1073/pnas.86.2.675. [DOI] [PMC free article] [PubMed] [Google Scholar]
- 27.Ciborowski P, Kadiu I, Rozek W, Smith L, Bernhardt K, Fladseth M, Ricardo-Dukelow M, Gendelman HE. Investigating the human immunodeficiency virus type 1-infected monocyte-derived macrophage secretome. Virology. 2007;363:198–209. doi: 10.1016/j.virol.2007.01.013. [DOI] [PMC free article] [PubMed] [Google Scholar]
- 28.Kadiu I, Glanzer JG, Kipnis J, Gendelman HE, Thomas MP. Mononuclear phagocytes in the pathogenesis of neurodegenerative diseases. Neurotox Res. 2005;8:25–50. doi: 10.1007/BF03033818. [DOI] [PubMed] [Google Scholar]
- 29.Elbim C, Pillet S, Prevost MH, Preira A, Girard PM, Rogine N, Matusani H, Hakim J, Israel N, Gougerot-Pocidalo MA. Redox and activation status of monocytes from human immunodeficiency virus-infected patients: relationship with viral load. J Virol. 1999;73:4561–6. doi: 10.1128/jvi.73.6.4561-4566.1999. [DOI] [PMC free article] [PubMed] [Google Scholar]
- 30.Nottet HD, Persidsky Y, Sasseville VG, Nukuna AN, Bock P, Zhai QH, Sharer LR, McComb RD, Swindells S, Soderland C, Gendelman HE. Mechanisms for the transendothelial migration of HIV-1-infected monocytes into brain. J Immunol. 1996;156:1284–95. [PubMed] [Google Scholar]
- 31.Ricardo-Dukelow M, Kadiu I, Rozek W, Schlautman J, Persidsky Y, Ciborowski P, Kanmogne GD, Gendelman HE. HIV-1 infected monocyte-derived macrophages affect the human brain microvascular endothelial cell proteome: new insights into blood-brain barrier dysfunction for HIV-1-associated dementia. J Neuroimmunol. 2007;185:37–46. doi: 10.1016/j.jneuroim.2007.01.004. [DOI] [PMC free article] [PubMed] [Google Scholar]
- 32.Gendelman HE, Orenstein JM, Martin MA, Ferrua C, Mitra R, Phipps T, Wahl LA, Lane HC, Fauci AS, Burke DS, et al. Efficient isolation and propagation of human immunodeficiency virus on recombinant colony-stimulating factor 1-treated monocytes. J Exp Med. 1988;167:1428–41. doi: 10.1084/jem.167.4.1428. [DOI] [PMC free article] [PubMed] [Google Scholar]
- 33.Gendelman HE, Phelps W, Feigenbaum L, Ostrove JM, Adachi A, Howley PM, Khoury G, Ginsberg HS, Martin MA. Trans-activation of the human immunodeficiency virus long terminal repeat sequence by DNA viruses. Proc Natl Acad Sci U S A. 1986;83:9759–63. doi: 10.1073/pnas.83.24.9759. [DOI] [PMC free article] [PubMed] [Google Scholar]
- 34.Gendelman HE, Theodore TS, Willey R, McCoy J, Adachi A, Mervis RJ, Venkatesan S, Martin MA. Molecular characterization of a polymerase mutant human immunodeficiency virus. Virology. 1987;160:323–9. doi: 10.1016/0042-6822(87)90002-x. [DOI] [PubMed] [Google Scholar]
- 35.Arfi V, Riviere L, Jarrosson-Wuilleme L, Goujon C, Rigal D, Darlix JL, Cimarelli A. Characterization of the early steps of infection of primary blood monocytes by human immunodeficiency virus type 1. J Virol. 2008;82:6557–65. doi: 10.1128/JVI.02321-07. [DOI] [PMC free article] [PubMed] [Google Scholar]
- 36.Hunter-Lavin C, Davies EL, Bacelar MM, Marshall MJ, Andrew SM, Williams JH. Hsp70 release from peripheral blood mononuclear cells. Biochem Biophys Res Commun. 2004;324:511–7. doi: 10.1016/j.bbrc.2004.09.075. [DOI] [PubMed] [Google Scholar]
- 37.Gastpar R, Gehrmann M, Bausero MA, Asea A, Gross C, Schroeder JA, Multhoff G. Heat shock protein 70 surface-positive tumor exosomes stimulate migratory and cytolytic activity of natural killer cells. Cancer Res. 2005;65:5238–47. doi: 10.1158/0008-5472.CAN-04-3804. [DOI] [PMC free article] [PubMed] [Google Scholar]
- 38.Kadiu I, Ricardo-Dukelow M, Ciborowski P, Gendelman HE. Cytoskeletal protein transformation in HIV-1-infected macrophage giant cells. J Immunol. 2007;178:6404–15. doi: 10.4049/jimmunol.178.10.6404. [DOI] [PubMed] [Google Scholar]
- 39.Jolly C, Mitar I, Sattentau Q. Requirement for an intact T-cell actin and tubulin cytoskeleton for efficient assembly and spread of human immunodeficiency virus type 1. J Virol. 2007;81:5547–60. doi: 10.1128/JVI.01469-06. [DOI] [PMC free article] [PubMed] [Google Scholar]
- 40.Mor-Vaknin N, Punturieri A, Sitwala K, Markovitz DM. Vimentin is secreted by activated macrophages. Nat Cell Biol. 2003;5:59–63. doi: 10.1038/ncb898. [DOI] [PubMed] [Google Scholar]
- 41.Gougerot-Pocidalo MA, Roche Y, Fay M, Perianin A, Bailly S. Oxidative injury amplifies interleukin-1-like activity produced by human monocytes. Int J Immunopharmacol. 1989;11:961–9. doi: 10.1016/0192-0561(89)90119-7. [DOI] [PubMed] [Google Scholar]
- 42.Israel N, Gougerot-Pocidalo MA, Aillet F, Virelizier JL. Redox status of cells influences constitutive or induced NF-kappa B translocation and HIV long terminal repeat activity in human T and monocytic cell lines. J Immunol. 1992;149:3386–93. [PubMed] [Google Scholar]
- 43.Israel N, Hazan U, Alcami J, Munier A, Arenzana-Seisdedos F, Bachelerie F, Israel A, Virelizier JL. Tumor necrosis factor stimulates transcription of HIV-1 in human T lymphocytes, independently and synergistically with mitogens. J Immunol. 1989;143:3956–60. [PubMed] [Google Scholar]
- 44.Buttke TM, Sandstrom PA. Oxidative stress as a mediator of apoptosis. Immunol Today. 1994;15:7–10. doi: 10.1016/0167-5699(94)90018-3. [DOI] [PubMed] [Google Scholar]
- 45.Laochumroonvorapong P, Paul S, Elkon KB, Kaplan G. H2O2 induces monocyte apoptosis and reduces viability of Mycobacterium avium-M intracellulare within cultured human monocytes Infect. Immun. 1996;64:452–9. doi: 10.1128/iai.64.2.452-459.1996. [DOI] [PMC free article] [PubMed] [Google Scholar]
- 46.Um HD, Orenstein JM, Wahl SM. Fas mediates apoptosis in human monocytes by a reactive oxygen intermediate dependent pathway. J Immunol. 1996;156:3469–77. [PubMed] [Google Scholar]
- 47.Baranano DE, Rao M, Ferris CD, Snyder SH. Biliverdin reductase: a major physiologic cytoprotectant. Proc Natl Acad Sci U S A. 2002;99:16093–8. doi: 10.1073/pnas.252626999. [DOI] [PMC free article] [PubMed] [Google Scholar]
- 48.Haeggstrom JZ. Structure, function, and regulation of leukotriene A4 hydrolase. Am J Respir Crit Care Med. 2000;161:S25–31. doi: 10.1164/ajrccm.161.supplement_1.ltta-6. [DOI] [PubMed] [Google Scholar]
- 49.Jung NH, Kim HP, Kim BR, Cha SH, Kim GA, Ha H, Na YE, Cha YN. Evidence for heme oxygenase-1 association with caveolin-1 and -2 in mouse mesangial cells. IUBMB Life. 2003;55:525–32. doi: 10.1080/15216540310001620968. [DOI] [PubMed] [Google Scholar]
- 50.Kopitar-Jerala N. The role of cystatins in cells of the immune system. FEBS Lett. 2006;580:6295–301. doi: 10.1016/j.febslet.2006.10.055. [DOI] [PubMed] [Google Scholar]
- 51.Pines A, Perrone L, Bivi N, Romanello M, Damante G, Gulisano M, Kelley MR, Quadrifoglio F, Tell G. Activation of APE1/Ref-1 is dependent on reactive oxygen species generated after purinergic receptor stimulation by ATP. Nucleic Acids Res. 2005;33:4379–94. doi: 10.1093/nar/gki751. [DOI] [PMC free article] [PubMed] [Google Scholar]
- 52.Aquaro S, Svicher V, Schols D, Pollicita M, Antinori A, Balzarini J, Perno CF. Mechanisms underlying activity of antiretroviral drugs in HIV-1-infected macrophages: new therapeutic strategies. J Leukoc Biol. 2006;80:1103–10. doi: 10.1189/jlb.0606376. [DOI] [PubMed] [Google Scholar]
- 53.Choi J, Liu RM, Kundu RK, Sangiorgi F, Wu W, Maxson R, Forman HJ. Molecular mechanism of decreased glutathione content in human immunodeficiency virus type 1 Tat-transgenic mice. J Biol Chem. 2000;275:3693–8. doi: 10.1074/jbc.275.5.3693. [DOI] [PubMed] [Google Scholar]
- 54.Mollace V, Salvemini D, Riley DP, Muscoli C, Iannone M, Granato T, Masuelli L, Modesti A, Rotiroti D, Nistico R, Bertoli A, Perno CF, Aquaro S. The contribution of oxidative stress in apoptosis of human-cultured astroglial cells induced by supernatants of HIV-1-infected macrophages. J Leukoc Biol. 2002;71:65–72. [PubMed] [Google Scholar]
- 55.Setsukinai K, Urano Y, Kakinuma K, Majima HJ, Nagano T. Development of novel fluorescence probes that can reliably detect reactive oxygen species and distinguish specific species. J Biol Chem. 2003;278:3170–5. doi: 10.1074/jbc.M209264200. [DOI] [PubMed] [Google Scholar]
- 56.Brigelius-Flohe R, Kelly FJ, Salonen JT, Neuzil J, Zingg JM, Azzi A. The European perspective on vitamin E: current knowledge and future research. Am J Clin Nutr. 2002;76:703–16. doi: 10.1093/ajcn/76.4.703. [DOI] [PubMed] [Google Scholar]
- 57.Wu D, Hayek MG, Meydani S. Vitamin E and macrophage cyclooxygenase regulation in the aged. J Nutr. 2001;131:382S–8S. doi: 10.1093/jn/131.2.382S. [DOI] [PubMed] [Google Scholar]
- 58.Droga-Mazovec G, Bojic L, Petelin A, Ivanova S, Romih R, Repnik U, Salvesen GS, Stoka V, Turk V, Turk B. Cysteine cathepsins trigger caspase-dependent cell death through cleavage of bid and antiapoptotic Bcl-2 homologues. J Biol Chem. 2008;283:19140–50. doi: 10.1074/jbc.M802513200. [DOI] [PubMed] [Google Scholar]
- 59.Foghsgaard L, Wissing D, Mauch D, Lademann U, Bastholm L, Boes M, Elling F, Leist M, Jaattela M. Cathepsin B acts as a dominant execution protease in tumor cell apoptosis induced by tumor necrosis factor. J Cell Biol. 2001;153:999–1010. doi: 10.1083/jcb.153.5.999. [DOI] [PMC free article] [PubMed] [Google Scholar]
- 60.Leist M, Jaattela M. Triggering of apoptosis by cathepsins. Cell Death Differ. 2001;8:324–6. doi: 10.1038/sj.cdd.4400859. [DOI] [PubMed] [Google Scholar]
- 61.Sloane BF, Rozhin J, Johnson K, Taylor H, Crissman JD, Honn KV. Cathepsin B: association with plasma membrane in metastatic tumors. Proc Natl Acad Sci U S A. 1986;83:2483–7. doi: 10.1073/pnas.83.8.2483. [DOI] [PMC free article] [PubMed] [Google Scholar]
- 62.Babior BM. Oxidants from phagocytes: agents of defense and destruction. Blood. 1984;64:959–66. [PubMed] [Google Scholar]
- 63.Verdot L, Lalmanach G, Vercruysse V, Hartmann S, Lucius R, Hoebeke J, Gauthier F, Vray B. Cystatins up-regulate nitric oxide release from interferon-gamma-activated mouse peritoneal macrophages. J Biol Chem. 1996;271:28077–81. doi: 10.1074/jbc.271.45.28077. [DOI] [PubMed] [Google Scholar]
- 64.Neil S, Martin F, Ikeda Y, Collins M. Postentry restriction to human immunodeficiency virus-based vector transduction in human monocytes. J Virol. 2001;75:5448–56. doi: 10.1128/JVI.75.12.5448-5456.2001. [DOI] [PMC free article] [PubMed] [Google Scholar]
- 65.Triques K, Stevenson M. Characterization of restrictions to human immunodeficiency virus type 1 infection of monocytes. J Virol. 2004;78:5523–7. doi: 10.1128/JVI.78.10.5523-5527.2004. [DOI] [PMC free article] [PubMed] [Google Scholar]
- 66.Colton CA, Gilbert DL. Production of superoxide anions by a CNS macrophage, the microglia. FEBS Lett. 1987;223:284–8. doi: 10.1016/0014-5793(87)80305-8. [DOI] [PubMed] [Google Scholar]
- 67.Babior BM. NADPH oxidase: an update. Blood. 1999;93:1464–76. [PubMed] [Google Scholar]
- 68.Babior BM. NADPH oxidase. Curr Opin Immunol. 2004;16:42–7. doi: 10.1016/j.coi.2003.12.001. [DOI] [PubMed] [Google Scholar]
- 69.Elbim C, Hakim J, Gougerot-Pocidalo MA. Heterogeneity in Lewis-X and sialyl Lewis-X antigen expression on monocytes in whole blood: relation to stimulus-induced oxidative burst. Am J Pathol. 1998;152:1081–90. [PMC free article] [PubMed] [Google Scholar]
- 70.Gut J, Goldman DW, Jamieson GC, Trudell JR. Conversion of leukotriene A4 to leukotriene B4: catalysis by human liver microsomes under anaerobic conditions. Arch Biochem Biophys. 1987;259:497–509. doi: 10.1016/0003-9861(87)90516-9. [DOI] [PubMed] [Google Scholar]
- 71.Bivik C, Rosdahl I, Ollinger K. Hsp70 protects against UVB induced apoptosis by preventing release of cathepsins and cytochrome c in human melanocytes. Carcinogenesis. 2007;28:537–44. doi: 10.1093/carcin/bgl152. [DOI] [PubMed] [Google Scholar]
- 72.Nylandsted J, Gyrd-Hansen M, Danielewicz A, Fehrenbacher N, Lademann U, Hoyer-Hansen M, Weber E, Multhoff G, Rohde M, Jaattela M. Heat shock protein 70 promotes cell survival by inhibiting lysosomal membrane permeabilization. J Exp Med. 2004;200:425–35. doi: 10.1084/jem.20040531. [DOI] [PMC free article] [PubMed] [Google Scholar]
- 73.Iordanskiy S, Zhao Y, Dubrovsky L, Iordanskaya T, Chen M, Liang D, Bukrinsky M. Heat shock protein 70 protects cells from cell cycle arrest and apoptosis induced by human immunodeficiency virus type 1 viral protein R. J Virol. 2004;78:9697–704. doi: 10.1128/JVI.78.18.9697-9704.2004. [DOI] [PMC free article] [PubMed] [Google Scholar]
- 74.Deiss LP, Galinka H, Berissi H, Cohen O, Kimchi A. Cathepsin D protease mediates programmed cell death induced by interferon-gamma, Fas/APO-1 and TNF-alpha. EMBO J. 1996;15:3861–70. [PMC free article] [PubMed] [Google Scholar]
- 75.Yamashima T, Kohda Y, Tsuchiya K, Ueno T, Yamashita J, Yoshioka T, Kominami E. Inhibition of ischaemic hippocampal neuronal death in primates with cathepsin B inhibitor CA-074: a novel strategy for neuroprotection based on ‘calpain-cathepsin hypothesis. Eur J Neurosci. 1998;10:1723–33. doi: 10.1046/j.1460-9568.1998.00184.x. [DOI] [PubMed] [Google Scholar]
- 76.Kalter DC, Nakamura M, Turpin JA, Baca LM, Hoover DL, Dieffenbach C, Ralph P, Gendelman HE, Meltzer MS. Enhanced HIV replication in macrophage colony-stimulating factor-treated monocytes. J Immunol. 1991;146:298–306. [PubMed] [Google Scholar]
Associated Data
This section collects any data citations, data availability statements, or supplementary materials included in this article.