Abstract
Flaviviruses such as tick-borne encephalitis virus, Japanese encephalitis virus, West Nile virus, and St. Louis encephalitis virus are important neurotropic human pathogens, typically causing a devastating and often fatal neuroinfection. Flaviviruses induce neuroinflammation with typical features of viral encephalitides, including inflammatory cell infiltration, activation of microglia, and neuronal degeneration. Development of safe and effective live-virus vaccines against neurotropic flavivirus infections demands a detailed knowledge of their neuropathogenesis in a primate host that is evolutionarily close to humans. Here, we used computerized morphometric analysis to quantitatively assess the cellular inflammatory responses in the central nervous system (CNS) of rhesus monkeys infected with three antigenically divergent attenuated flaviviruses. The kinetics, spatial pattern, and magnitude of microglial activation, trafficking of T and B cells, and changes in T cell subsets within the CNS define unique phenotypic signatures for each of the three viruses. Our results provide a benchmark for investigation of cellular inflammatory responses induced by attenuated flaviviruses in the CNS of primate hosts and provide insight into the neuropathogenesis of flavivirus encephalitis that might guide the development of safe and effective live-virus vaccines. (J Histochem Cytochem 57:973–989, 2009)
Keywords: flaviviruses, non-human primates, central nervous system, cellular inflammatory response, immunohistochemistry, digital whole-tissue section slides, computerized morphometric analysis
Viruses within the Flavivirus genus of the Flaviviridae family, such as tick-borne encephalitis virus (TBEV), Japanese encephalitis virus (JEV), West Nile virus, and St. Louis encephalitis virus, are important neurotropic human pathogens, typically causing a devastating and often fatal neuroinfection. Flaviviruses induce neuroinflammation with features typical of viral encephalitides, including leptomeningitis, perivascular and parenchymal accumulation of various lymphocytes, and development of microglial nodules associated with neuronophagia in regions of viral replication (Chambers and Diamond 2003). Because there are no specific antiviral drugs licensed for flaviviruses and because attempts to control mosquito and tick vector populations have proven difficult, vaccination remains the most effective preventative measure. Use of a live attenuated flavivirus vaccine is the most likely approach to disease prevention, since immunization with yellow fever 17D (YF 17D) or JEV live vaccines provides long-term immunity in humans (Monath 2005; Sohn et al. 2008). The inactivated vaccines are generally expensive and need some improvement in terms of safety and long-term efficacy. Currently, the main focus of our laboratory is to develop live attenuated flavivirus vaccine candidates using reverse genetics (Pletnev and Men 1998; Pletnev et al. 2006; Rumyantsev et al. 2006).
Development of safe and effective vaccines against neurotropic flaviviruses would be facilitated by a detailed knowledge of their neuropathogenesis, including a characterization of the cellular inflammatory responses within the infected central nervous system (CNS). For the last decade, substantial progress has been made in the study of the pathogenesis of flavivirus infections in mouse models (Liu and Chambers 2001; Diamond et al. 2003; Shrestha et al. 2006; Sitati and Diamond 2006; Sitati et al. 2007). There are only a limited number of studies characterizing the flavivirus-associated inflammatory cell infiltrate of the CNS in fatal human cases (Johnson et al. 1985; Kelley et al. 2003; Omalu et al. 2003; Gelpi et al. 2005,2006). These studies of postmortem human brain tissue showed that inflammatory infiltrates consisted of T and B cells and macrophages/microglia. Our previous studies in rhesus monkeys that were intracerebrally inoculated with attenuated flaviviruses demonstrated very similar findings; CD68+ macrophages/microglia, CD3+ T cells, and CD20+ B cells were the major cell types found in the inflammatory foci (Maximova et al. 2008). However, the spatiotemporal distribution, magnitude, and kinetics of flavivirus-induced cellular inflammatory responses within the CNS of non-human primates have not been studied in detail. Studies in primates are especially valuable because they are evolutionarily closer to humans than are mice. These studies might also provide a better understanding of why some current live-virus vaccines, such as YF 17D, are safe and efficacious (Monath 2005; Miller et al. 2008). Characterization of T cell and B cell recruitment into the CNS of non-human primates in response to infection with attenuated flaviviruses might be an important element in the assessment of their overall safety for humans. Therefore, the characterization of cellular inflammatory responses to viral infection of the CNS is of interest both for understanding the neuropathogenesis of flavivirus CNS infections and for development of safe live-virus vaccines.
The objective of this study was to assess and compare the cellular inflammatory responses within the CNS of rhesus monkeys following intracerebral (IC) inoculation with antigenically divergent flaviviruses: YF 17D virus, tick-borne Langat virus (LGTV), and chimeric tick-borne encephalitis/dengue type 4 virus (TBEV/DEN4Δ30). We characterized the microglial activation, the infiltration by T and B cells, and the type of cells undergoing apoptosis within the virus-infected CNS. Using computerized morphometric analysis, the magnitude of these responses was quantified, enabling us to analyze the relative proportions of infiltrating T cells and B cells as well as changes in their ratios over time. We observed substantial differences among the three viruses in the kinetics of induced microglial activation, T cell and B cell responses, and changes in the ratio of CD4+ and CD8+ T cell subsets within the inflammatory infiltrates. Our results provide a benchmark for the evaluation of cellular inflammatory responses within the CNS induced by attenuated flaviviruses and provide insight into the neuropathogenesis of flavivirus encephalitis that might guide the development of safe live-virus vaccines.
Materials and Methods
Viruses
LGTV wild-type strain TP21 was received from the Rockefeller Foundation Collection and amplified in Vero cells (Pletnev and Men 1998). The chimeric recombinant TBEV/DEN4Δ30 virus, containing the prM and E genes of the TBEV strain Sofjin and a 30-nucleotide deletion in the 3′ non-coding region of the genome, was originally recovered after transfection of Vero cells with RNA transcripts of its full-length chimeric cDNA genome (Rumyantsev et al. 2006). The YF 17D vaccine virus was received from Sanofi Pasteur, Inc. (Swiftwater, PA) and amplified by one passage in Vero cells (Maximova et al. 2008).
Animals and Inoculations
All animal procedures were performed according to United States Department of Agriculture Animal Welfare Regulations, Public Health Service Policy on Humane Care and Use of Laboratory Animals, and the Guide for the Care and Use of Laboratory Animals and approved by the Institutional Animal Care and Use Committee [National Institute of Allergy and Infectious Diseases (NIAID), National Institutes of Health, Bethesda, MD]. The study was conducted using rhesus monkeys (Macaca mulatta) obtained from the NIAID Morgan Island Breeding Program, Yemassee, SC. Animals were screened for neutralizing antibodies to LGTV, TBEV, DEN4, and YF virus and were found to be seronegative. Three groups of 12 animals each were intrathalamically inoculated with 105 plaque-forming units of LGTV, TBEV/DEN4Δ30, or YF 17D; the clinical, virological, and histopathological data for these animals were described previously (Maximova et al. 2008). Animals inoculated with each virus were observed twice daily for clinical signs of neurological illness and were euthanized at five time points: 3 (n=2), 7 (n=2), 14 (n=2 or 3), 21 (n=3 or 4), and 30 (n=2) days postinoculation (dpi). Four control animals were mock-inoculated with Leibovitz's L-15 medium (Invitrogen; Carlsbad, CA) and euthanized on 7, 14, 21, and 30 dpi. Brains and spinal cords were fixed in 10% buffered formalin and processed according to standard histological methods. Paraffin-embedded tissue sections (5 μm thick) were stained with hematoxylin and eosin or were processed for immunohistochemical detection of cellular markers. The following CNS regions were analyzed: basal ganglia (caudate nucleus, putamen, and globus pallidus), thalamus, and spinal cord (cervical and lumbar regions). These CNS regions were among those previously shown to be consistently affected by flaviviruses and designated as “indicator centers” (Nathanson et al. 1966).
Immunohistochemistry
Cell phenotyping was performed using antibodies (Biocare Medical; Concord, CA) to human CD3 (pan T cell marker), CD4 (labeling helper/regulator T cells), CD8 (labeling cytotoxic/suppressor T cells), CD20 (pan B cell marker), caspase-3 (cleaved), and antibody to CD68 (Dako; Carpinteria, CA) (directed against lysosomal protein expressed by phagocytic macrophages of microglial and monocytic origin). Further processing for diaminobenzidine colorimetric detection and controls were as described previously (Maximova et al. 2008).
Terminal Deoxynucleotidyl Transferase-mediated Deoxyuridine Triphosphate Nick-end Labeling (TUNEL) Staining
In situ TUNEL assay (Promega; Madison, WI) was performed according to the manufacturer's instructions. Tissue sections were developed with diaminobenzidine and were counterstained with hematoxylin.
Computerized Morphometric Analysis (CMA) of Immunostained Cellular Markers
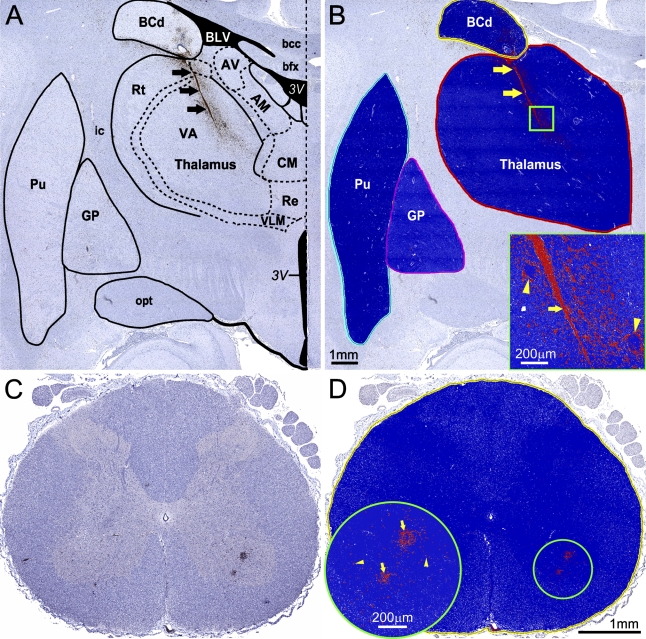
The entire immunostained coronal sections of brain that included the basal ganglia and thalamus, and entire cross-sectional areas of the cervical and lumbar regions of spinal cord were scanned at original magnification ×20 using ScanScope T2 (Aperio Technologies; Vista, CA). Aperio ImageScope 8.2 software was used for digital slide image viewing and analysis. The “Primate Brain Maps: Structure of the Macaque Brain” CD (Martin and Bowden 2000) was used for neuroanatomical orientation and mapping of CNS regions of interest (ROIs) within digital sections. A hue-saturation-intensity color threshold detection system and positive pixel count algorithm were used to quantify the amount of a specific cellular immunostaining (brown) present within the scanned area of CNS ROIs. Examples of CMA of the cellular markers in the basal ganglia, thalamus, and spinal cord of monkeys inoculated with YF 17D are shown in Figure 1. The algorithm input parameters were selected for each cellular marker, and the algorithm was tested on a variety of images of different brain and spinal cord sections before its performance was evaluated as reliable and reproducible. Once established, the algorithm input parameters for each cellular marker were kept constant. The total area (mm2) was measured for each CNS ROI, and the number of positive pixels within the CNS ROI was determined. The algorithm output parameters were exported to Microsoft Office Excel spreadsheets. The specific immunoreactivity (IR) for each cell phenotype was calculated as the number of positive pixels per mm2 of tissue in CNS ROIs. Mean IR values and standard errors (SEs) for each cell phenotype within the defined CNS ROI at a given time point postinoculation (7, 14, 21, and 30 dpi) were calculated based on the evaluation of a minimum 4 sections (basal ganglia and thalamus) up to 12 sections (spinal cord) per animal. The IR measured using this approach provides an overall quantitative estimate of the inflammatory cell response associated with each specific cell type and reflects the total number of cells involved. CMA of the cellular inflammatory response to flaviviruses in the CNS of monkeys at 3 dpi was not performed, because a mock-control animal was not available to us at this time point.
Figure 1.
Computerized morphometric analysis (CMA) of immunostained cellular markers. (A,B) CMA of the activated microglia/macrophages [CD68-immunoreactivity (CD68-IR)] in the basal ganglia and thalamus of monkeys inoculated with yellow fever 17D (YF 17D) vaccine virus. (A) Neuroanatomical orientation and mapping of the central nervous system (CNS) regions of interest (ROIs) in the original scanned image using the “Primate Brain Maps: Structure of the Macaque Brain” CD (Martin and Bowden, 2000). (B) Outlining the ROI and applying the CD68-IR–customized positive pixel count algorithm. Results of ROI analysis are shown in the markup image by pseudo-color overlay (orange, moderately positive pixels; red, strong positive pixels; blue, negative pixels; white, neutral pixels that are neither positive nor negative). Inset in B shows the boxed area of thalamus (1 mm2) at higher magnification. Arrows (black in A, and yellow in B and inset) show intensive CD68-IR within and adjacent to the needle track resulting from intrathalamic inoculation of the virus. Yellow arrowheads in inset show CD68-IR on the periphery of perivascular inflammatory infiltrates within the zone of inoculation. AM, anteromedial nucleus of thalamus; AV, anteroventral nucleus of thalamus; bcc, body of corpus callosum; BCd, body of caudate nucleus; bfx, body of fornix; BLV, body of lateral ventricle; CM, central medial nucleus of thalamus; GP, globus pallidus; ic, internal capsule; opt, optic tract; Rt, reticular nucleus of thalamus; Pu, putamen; Re, reuniens nucleus of thalamus; VA, ventral anterior nucleus of thalamus; VLM, medial part of ventral lateral nucleus of thalamus; 3V, third ventricle. (C,D) CMA of the T cell infiltration (CD3-IR) in the spinal cord of monkeys inoculated with YF 17D vaccine virus. (C) Original scanned image of entire cross-section of the cervical region of the spinal cord. (D) Markup image showing the outlined ROI with applied CD3-IR–customized positive pixel count algorithm (red, strong positive pixels; blue, negative pixels; white, neutral pixels). Inset in D shows the circled area (1 mm diameter) of the ventral horn at higher magnification. Yellow arrows, perivascular CD3-IR; yellow arrowheads, parenchymal CD3-IR.
Statistical Analysis
The differences in IR for the specific cellular marker within the CNS ROI between groups of animals at 21 dpi (three to four monkeys per virus group) were analyzed using Student's t-test (two-tailed, heteroscedastic). Significance was assumed for probability values of p<0.05.
Results
Microglial Activation and Macrophage Infiltration
Morphological Characterization of Microglia and Macrophages
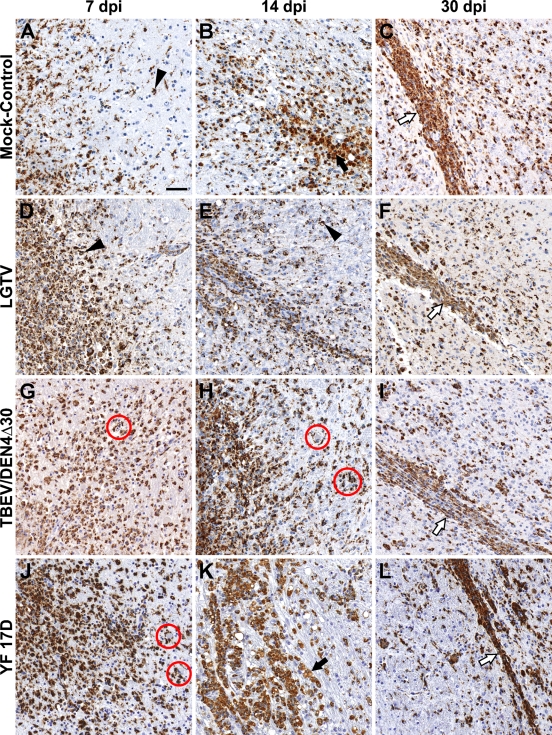
IC inoculation of the flaviviruses under study induced vigorous microglial activation and macrophage infiltration that were attributed to both tissue injury and virus replication. Infiltration by monocyte/macrophages and activation of microglial cells labeled by their expression of CD68 were observed in the thalamus of virus-infected monkeys as early as at 3 dpi. At this time point, some microglial cells displayed a ramified morphology characterized by discrete thin processes, but most of the microglial cells entered a transition/activation state characterized by hypertrophic cell bodies and shorter, thicker cell processes (not shown). Starting at 7 dpi, the time course of monocyte/macrophage infiltration and microglial activation in the thalamus is shown in Figure 2. Numerous CD68+ macrophages and activated microglial cells were observed in the zone of inoculation of either mock-control or virus-infected monkeys, forming a linear profile (needle track) by 30 dpi. However, in the thalamus of virus-infected monkeys, activated microglial cells were found engulfing or immediately adjacent to the degenerating/dying neurons and/or their debris.
Figure 2.
Monocyte/macrophage infiltration and microglial activation in the zone of inoculation. Representative images of CD68-IR (brown) are shown on indicated days postinoculation (dpi) in the thalamus of mock-control monkeys (A–C) or monkeys infected with Langat virus (LGTV) (D–F), chimeric tick-borne encephalitis/dengue type 4 virus (TBEV/DEN4Δ30) (G–I), or YF 17D (J–L). Black arrows, CD68+ cells with non-uniform cytoplasmic immunolabeling and morphology of phagocytic “foamy” macrophages; arrowheads, CD68+-activated microglia; red circles, activated microglial cells engulfing or immediately adjacent to the degenerating/dying neurons and/or neuronal debris; white arrows, CD68+ cells forming a linear profile (needle track). Bar = 50 μm (also applies to B–L).
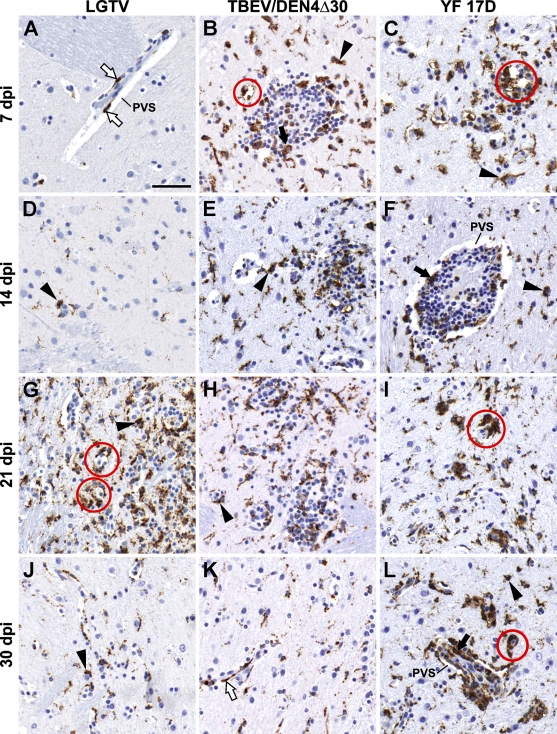
CD68+ cells in the basal ganglia were represented by perivascular macrophages, activated microglial cells, and macrophages randomly distributed among lymphocytes within the perivascular inflammatory infiltrates (Figure 3). Numerous activated microglial cells were seen immediately adjacent to the neuronal debris, indicating ongoing or previous phagocytic activity. At 7 and 14 dpi, only scant numbers of CD68+ cells were found in the basal ganglia of monkeys infected with LGTV (Figures 3A and 3D) compared with numerous CD68+ cells in these CNS regions of monkeys infected with TBEV/DEN4Δ30 or YF 17D (Figures 3B and 3E or 3C and 3F, respectively). At 21 and 30 dpi, CD68+ cells were frequently found in the basal ganglia (Figures 3G–3L), as well as in remote areas of the CNS such as the spinal cord. Notably, among the three viruses (LGTV, TBEV/DEN4Δ30, and YF 17D), LGTV induced more-widespread microglial activation in the spinal cord, which was most intense in the ventral horns (not shown).
Figure 3.
Monocyte/macrophage infiltration and microglial activation in the putamen of monkeys infected with LGTV (A,D,G,J), TBEV/DEN4Δ30 (B,E,H,K), or YF 17D (C,F,I,L). Representative images of CD68-IR (brown) are shown on indicated dpi. PVS, perivascular space; white arrows, perivascular CD68+ macrophages; black arrows, CD68+ macrophages within the perivascular inflammatory infiltrates; arrowheads, CD68+-activated microglia; red circles, activated microglial cells engulfing or immediately adjacent to the degenerating/dying neurons and/or neuronal debris. Bar = 50 μm (also applies to B–L).
In Situ Quantitative Analysis of CD68-IR
CD68-immunostained sections from the inoculation site (thalamus), CNS regions adjacent to the inoculation site (basal ganglia), and remote areas of the CNS (spinal cord) of monkeys infected with each of the three viruses under study (LGTV, TBEV/DEN4Δ30, and YF17D) were subjected to computerized morphometric analysis as described in Materials and Methods and as shown in Figure 1. The time course of CD68-IR in the CNS of infected and mock-control monkeys is shown in Figure 4. Monkeys infected with TBEV/DEN4Δ30 or YF 17D had a very similar time course of CD68-IR in the brain. In contrast, development of CD68-IR appeared to be delayed in the brain of monkeys infected with LGTV. Statistical analysis was performed to determine differences between mean CD68-IR values at 21 dpi (three to four monkeys per virus group). At this time point, the magnitude of CD68-IR in monkeys infected with TBEV/DEN4Δ30 was significantly higher in the thalamus compared with LGTV-infected monkeys and in the spinal cord compared with YF 17D–infected monkeys. In the spinal cord, CD68-IR was highest in monkeys infected with LGTV, although it reached the level of statistical significance only when compared with YF 17D–infected monkeys (p<0.05).
Figure 4.
Time course of CD68-IR in the CNS of infected monkeys. Mean values of CD68-IR per mm2 of tissue and standard errors (SEs) are shown on indicated dpi for the following CNS regions: (A) basal ganglia (included caudate nucleus, putamen, and globus pallidus); (B) thalamus; and (C) spinal cord (included cervical and lumbar regions). Statistically significant differences in the mean CD68-IR values at 21 dpi (three to four monkeys per virus group) are indicated with asterisks (p<0.05).
T Cell Infiltration
Morphological Characterization of Infiltrating T Cells
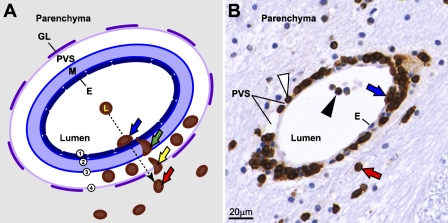
CD3+ T cells infiltrated the brain parenchyma of flavivirus-infected monkeys within 3 days. A schematic illustration of the process of migration of T cells from the blood into the perivascular space and brain parenchyma is shown in Figure 5, along with a representative image of CD3+ T cell infiltration in the brain of a YF 17D–infected monkey. Although the mock-control at 3 dpi was not available, the analysis of the CNS of mock-control monkeys at the following time point (7 dpi) showed a paucity of CD3+ T cells, which were solitary and mostly intravascular.
Figure 5.
T cells infiltrate the brain parenchyma of flavivirus-infected monkeys within 3 days. (A) Schematic illustration of postcapillary venule showing the steps in the process of migration of CD3+ T cells from the blood into the perivascular space and brain parenchyma (the same sequence of events was also observed for CD20+ B cell infiltration, not shown). (B) Representative corresponding image showing CD3+ T cell infiltration in the thalamus of YF 17D–infected monkey at 3 dpi. Blue arrows in both panels show the first step of infiltration, which involved the adhesion of T cells to the endothelium (1, dark blue). Green arrow shows their passage across the endothelium and inner and outer vascular basement membranes (2 and 3, blue) into the perivascular space. Yellow arrow shows the second step, which involved the passage of T cells into the parenchyma across the basement membrane on top of the glia limitans (4, light purple). Red arrows on both panels point to T cells extravasated into the parenchyma. Black arrowhead, T cell within the lumen of the vessel; white arrowhead, T cell in the perivascular space. E, endothelium; M, media; PVS, perivascular space; GL, glia limitans.
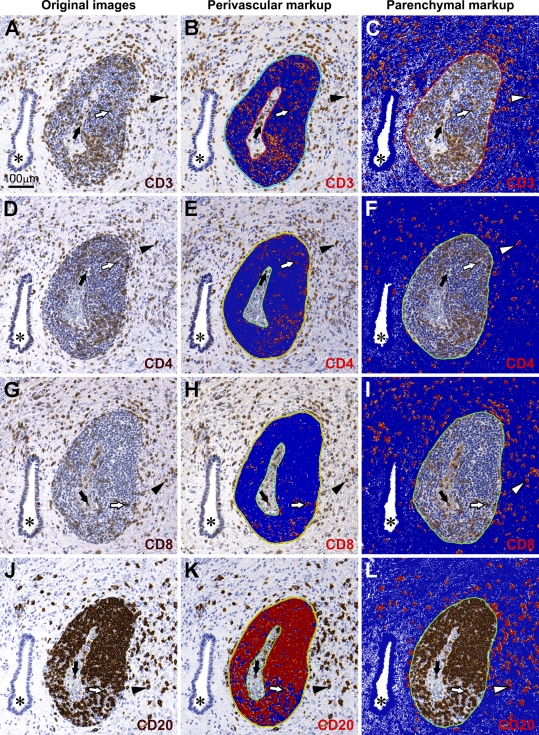
At later times postinoculation, T cell infiltration increased in both perivascular and parenchymal compartments of the infected CNS. The topographical analysis of perivascular vs parenchymal localization of infiltrating T cells is shown in Figures 6A–6I. The distribution of infiltrating CD3+ T cells was relatively even between perivascular and parenchymal compartments (Figures 6A–6C). However, CD4+ and CD8+ T cells displayed different compartmentalization: considerably greater numbers of CD4+ T cells were retained within the perivascular spaces as compared with CD8+ T cells (Figures 6E and 6H, respectively), and the parenchyma was infiltrated to a greater extent by CD8+ T cells than by CD4+ T cells (Figures 6I and 6F, respectively). In addition, CD4+ and CD8+ T cells were frequently found in the parenchyma within the foci of neuronophagia and/or were in close contact with neurons (not shown). To reveal the magnitude and time course of T cell infiltration in the CNS of flavivirus-infected monkeys, we next performed quantitative analysis of IR for CD3+, CD4+, and CD8+ T cells.
Figure 6.
Topographical localization of infiltrating T and B cells within the CNS compartments. Representative adjacent sections showing the central gray matter of the spinal cord of a TBEV/DEN4Δ30–infected monkey at 21 dpi. First column, original images of T cells (A,D,G) and B cells (J). Second column (B,E,H,K), corresponding markup images with IR (positive pixels; orange-red) within the perivascular spaces. Third column (C,F,I,L), corresponding markup images with IR within the parenchyma. Asterisks, the central canal; black arrows, T or B cells located inside blood vessels; white arrows, T or B cells located within the perivascular space; arrowheads (black or white), T or B cells located within the parenchyma. Negative pixels are shown in blue. Neutral pixels (neither positive nor negative) are shown in white. Bar = 100 μm (also applies to B–L).
In Situ Quantitative Analysis of CD3-IR
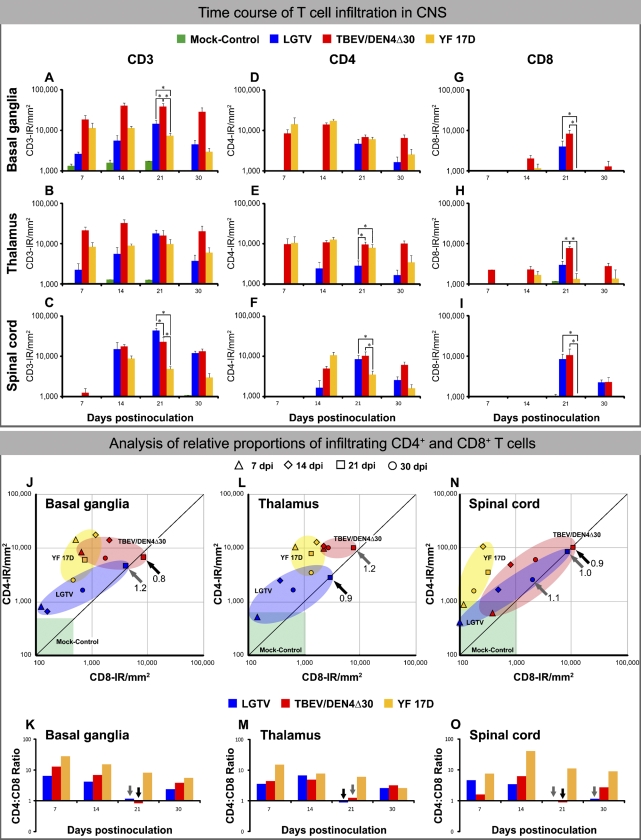
The time course of CD3-IR in the CNS of infected and mock-control monkeys is shown in Figure 7. Among the monkeys infected with the three different flaviviruses under study, the level of CD3-IR was consistently greater in the brain of TBEV/DEN4Δ30–infected monkeys (Figures 7A and 7B, upper panel). However, at 21 dpi, the level of CD3-IR reached the statistically significant highest level in the spinal cord of LGTV-infected monkeys (Figure 7C, upper panel). To further investigate the role of different T cell subsets in the control of infection within the CNS, we performed a quantitative analysis of CD4+ and CD8+ T cell infiltration, as well as estimating the CD4+ to CD8+ T cell ratio (CD4:CD8 ratio) throughout the time course of CNS infection.
Figure 7.
Time course of T cell infiltration in the CNS of infected monkeys (upper panel): Mean values of IR for CD3 (A–C), CD4 (D–F), and CD8 (G–I) and SE are shown on indicated dpi for the basal ganglia, thalamus, and spinal cord. Statistically significant differences in the mean values at 21 dpi (three to four monkeys per virus group) are indicated with asterisks (p<0.05). Lower panel, analysis of the relative proportions of infiltrating CD4+ and CD8+ T cells. (J,L,N) Scatter plots showing the relative proportions of CD4+ and CD8+ T cells in the basal ganglia, thalamus, and spinal cord of monkeys infected with LGTV (blue), TBEV/DEN4Δ30 (red), or YF 17D (yellow) on indicated dpi. The ranges of CD4-IR and CD8-IR values in the CNS regions of mock-control monkeys (one monkey per each time point) are shown by the green boxes. (K,M,O) The ratios of CD4+ to CD8+ cells in the CNS on indicated dpi. Ratios of 1.0 to 1.2 (representing equal or similar CD4-IR and CD8-IR) are shown by gray arrows, whereas CD4:CD8 ratios below 1.0 are shown by black arrows (J–O).
In Situ Quantitative Analysis of CD4-IR and CD8-IR
CD4-IR in the CNS of infected monkeys followed a time course similar to that of CD3-IR (Figures 7D–7F, upper panel). In LGTV-infected monkeys, a significant increase in CD4-IR occurred very late in the course of CNS infection, on 21 dpi (Figures 7D and 7F, upper panel). At this time point, the magnitude of CD4-IR in monkeys infected with LGTV was significantly lower in the thalamus compared with monkeys infected with either TBEV/DEN4Δ30 or YF 17D (Figure 7E, upper panel). However, both tick-borne encephalitis-related viruses, LGTV and TBEV/DEN4Δ30, induced significantly higher levels of CD4-IR in the spinal cord compared with the vaccine YF 17D virus (Figure 7F, upper panel). Appreciable levels of CD8-IR in the CNS of infected monkeys were measured at later time points compared with CD4-IR (Figures 7G–7I, upper panel). A relative paucity of CD8-IR was noted in all analyzed CNS regions during infection with YF 17D virus. In contrast, the levels of CD8-IR in the CNS of monkeys infected with LGTV and TBEV/DEN4Δ30 reached high levels on 21 dpi. The values of CD4-IR and CD8-IR in the CNS of mock-control monkeys were very low. The ranges of mock-control values of CD4-IR or CD8-IR are shown in Figures 7J, 7L, and 7N (green boxes) and were observed to never exceed 1800 pixels per mm2. Because all T cells were uniform in shape and had a size of ∼300 pixels (not shown), the number of T cells in the CNS of mock-control monkeys was estimated to be 0–6 cells/mm2, which indicates a relative paucity of T cells (as well as B cells, see below) in the non-infected CNS.
Analysis of relative proportions of CD4+ and CD8+ cells throughout the time course of flavivirus CNS infection is shown in Figure 7 (lower panel). Interestingly, CD4:CD8 ratios were consistently highest in the CNS of YF 17D–infected monkeys. For all three viruses, the CD4+ T cell subset was predominant throughout most of the time course of the CNS infection, except for 21 dpi, when the CD4:CD8 ratio suddenly dropped or even became inverted in the CNS of monkeys infected with LGTV or TBEV/DEN4Δ30.
B Cell Infiltration
Morphological Characterization of Infiltrating B Cells
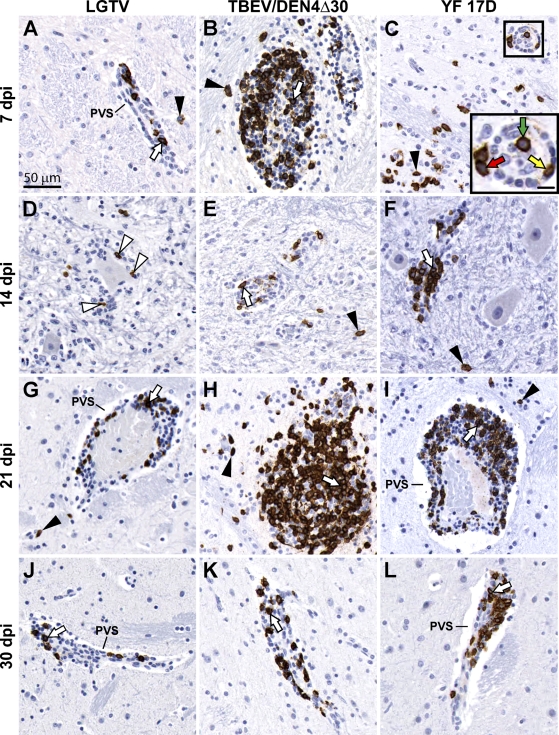
CD20+ B cells infiltrated the brain parenchyma of flavivirus-infected monkeys within 3 days following similar steps in the process of migration from the blood shown for T cells in Figure 5. B cell infiltration increased at later time points in both perivascular and parenchymal compartments of all brain regions examined (Figure 8). The topographical analysis of perivascular vs parenchymal localization of infiltrating B cells is shown in Figures 6J–6L. Considerably greater numbers of CD20+ B cells were retained within the perivascular spaces, compared with the parenchymal compartment (Figures 6K and 6L, respectively). In addition, CD20+ B cells were frequently found within the foci of neuronophagia and/or were in close contact with neurons (Figure 8D). B cell infiltration waned by 30 dpi in the CNS of all groups of infected monkeys, with the vast majority of B cells retained within the perivascular compartments (Figures 8J–8L).
Figure 8.
B cell infiltration in the CNS of infected monkeys. Representative images of CD20-IR on indicated dpi are shown in the basal ganglia (A–C,G–L) and in the spinal cord [(D,F), ventral horn; and (E), Clarke's column]. PVS, perivascular space; white arrows, B cells located within the perivascular inflammatory infiltrates; arrowheads, B cells located within the parenchyma. Inset in C shows the boxed area at higher magnification: intravascular B cell (green arrow); B cell extravasating into the perivascular space (yellow arrow); and B cell leaving the perivascular space to invade the parenchyma (red arrow). Note: white arrowheads in D show B cells situated close to the degenerating neuron. Bars: A = 50 μm (also applies to B–L); inset in C = 10 μm.
In Situ Quantitative Analysis of CD20-IR
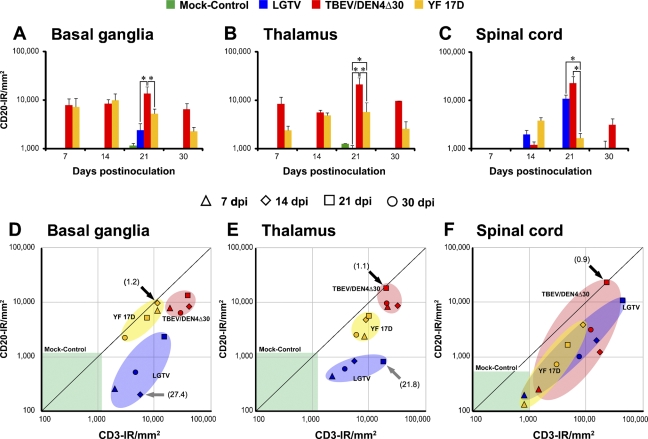
The time course of CD20-IR in the CNS of infected and mock-control monkeys is shown in Figures 9A–9C. The levels of CD20-IR were remarkably low in the brain of LGTV-infected monkeys, compared with monkeys infected with TBEV/DEN4Δ30 or YF 17D. However, in the spinal cord, monkeys infected with LGTV or TBEV/DEN4Δ30 had statistically significant higher levels CD20-IR on 21 dpi compared with YF 17D–infected monkeys. The values of CD20-IR in the CNS of mock-control monkeys were very low, reflecting a paucity of B cells in the non-infected CNS.
Figure 9.
Time course of B cell infiltration in the CNS of infected monkeys (A–C). Mean values of CD20-IR and SEs are shown on indicated dpi for the basal ganglia (A), thalamus (B), and spinal cord (C). Statistically significant differences in the mean values at 21 dpi (three to four monkeys per virus group) are indicated with asterisks (p<0.05). Analysis of the relative proportions of infiltrating T and B cells (D–F). Scatter plots showing relative proportions of T cells (CD3-IR/mm2) and B cells (CD20-IR/mm2) in the CNS of monkeys inoculated with LGTV (blue), TBEV/DEN4Δ30 (red), or YF 17D (yellow) on indicated dpi. Ratios representing equal or similar proportions of T and B cells are shown by black arrows. Ratios representing greater proportions of T cells compared with B cells are shown by gray arrows. The ranges of CD3-IR and CD20-IR values in the CNS regions of mock-control monkeys (one monkey per each time point) are shown by the green boxes.
Analysis of Relative Proportions of Infiltrating T Cells and B Cells
T cells were predominant infiltrating lymphocytes throughout most of the time course of the CNS infection with all three flaviviruses under study (Figures 9D–9F). Nevertheless, relative proportions of infiltrating T and B cells were similar in the brain of monkeys infected with TBEV/DEN4Δ30 or YF 17D on 14 or 21 dpi (T to B cell ratios of 1.1 and 1.2, respectively). In contrast, LGTV-infected monkeys at these time points had the highest T to B cell ratios in the brain (T to B cell ratios of 27.4 and 21.8, respectively). Interestingly, CD3-IR and CD20-IR data for the basal ganglia and thalamus clearly formed three separate clusters for each virus in the scatter plots (Figures 9D and 9E). However, this was not the case for the spinal cord, where all three clusters overlapped (Figure 9F). In the spinal cord, the lowest T to B cell ratio (0.9) was observed in monkeys infected with TBEV/DEN4Δ30 at 21 dpi. This relative prevalence of infiltrating B cells was also noted in the perivascular compartments of spinal cord of these monkeys (compare Figures 6B and 6K). These findings suggest that the relative proportion of infiltrating T and B cells during viral infection of the CNS might discriminate between viruses with different ability to induce the adaptive immune response and, possibly, with different levels of neurovirulence.
Morphological Characterization of Apoptosis Within the CNS
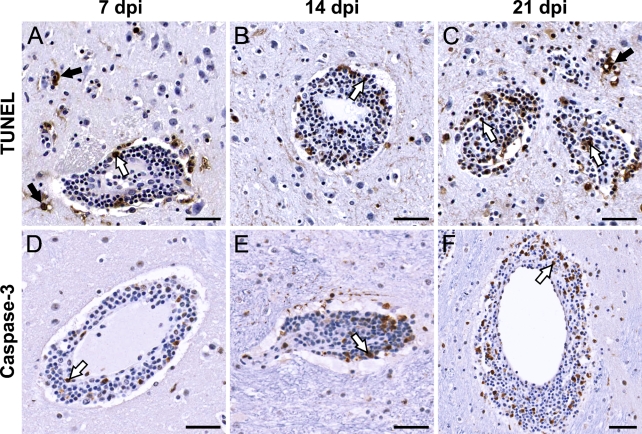
Using TUNEL and activated caspase-3 staining, we investigated whether apoptotic cell death occurs in the CNS of monkeys during the time course of virus infection, and whether this process leads to resolution of the cellular inflammatory response. There were no significant differences in the extent, distribution, and types of TUNEL+ or activated caspase-3+ cells between monkeys infected with LGTV, TBEV/DEN4Δ30, or YF 17D virus. In all infected monkeys, very few macrophage/microglial cells and neurons in the inoculation zone were TUNEL+ at 3 dpi (not shown). Representative images of apoptosis observed at 7 to 21 dpi in the CNS of TBEV/DEN4Δ30–infected monkeys are shown in Figure 10. A considerable number of TUNEL+ cells were located predominantly within the perivascular inflammatory infiltrates and, to a lesser extent, in the adjacent parenchyma (Figures 10A–10C). TUNEL+ cells within the perivascular inflammatory infiltrates may represent lymphocytes and/or macrophages. Macrophages situated at the rim of the perivascular inflammatory infiltrates often appeared to contain TUNEL+ lymphocytes within their cytoplasm, indicating ongoing phagocytosis. Within the parenchyma, TUNEL+ cells, which may represent dying neurons and/or glial cells, were observed only in the areas surrounding the perivascular inflammatory infiltrates (Figures 10A and 10C). Importantly, neither TUNEL nor activated caspase-3 signal was detected in the degenerating motor neurons of spinal cord of infected monkeys (not shown), indicating that apoptosis is not the mechanism of neuronal death in this model. Activated caspase-3+ cells were almost as frequent as TUNEL+ cells within the perivascular inflammatory infiltrates, but not in the surrounding parenchyma (Figures 10D–10F). Thus, apoptosis was unequivocally confirmed only for mononuclear cells located within the perivascular inflammatory infiltrates (perivascular apoptosis). This process appears to result in a decreased number of T and B lymphocytes in the CNS of infected monkeys by 30 dpi (as measured by CD3-IR and CD20-IR), and might ultimately lead to resolution of the cellular inflammatory response.
Figure 10.
Apoptosis within the CNS of infected monkeys. Representative images of terminal deoxynucleotidyl transferase-mediated deoxyuridine triphosphate nick-end labeling (TUNEL) (A–C) and activated caspase-3 (D–F) staining in the basal ganglia (putamen, A–D,F) and thalamus (E) of monkeys inoculated with TBEV/DEN4Δ30 virus are shown on indicated dpi. White arrows, TUNEL+ or activated caspase-3+ cells within the perivascular inflammatory infiltrates. These cells may represent lymphocytes and/or macrophages. Black arrows, TUNEL+ cells within the parenchyma adjacent to the perivascular inflammatory infiltrates. These TUNEL+ cells may represent dying neurons and/or glial cells. Note: activated caspase-3+ cells are predominantly located within the perivascular inflammatory infiltrates. Bar = 50 μm (applies to A–F).
Discussion
The pathogenesis of flavivirus CNS infection involves complex virus–host interactions, and successful development of live flavivirus vaccines would benefit from an understanding of cellular inflammatory responses during neuroinfection. However, although of great interest, current information regarding the immune responses to acute flavivirus infections is largely based on experimental studies in mouse models (Liu and Chambers 2001; Diamond et al. 2003; Shrestha et al. 2006; Sitati and Diamond 2006; Sitati et al. 2007). IC infection of non-human primates with neurotropic flaviviruses provides a closer paradigm for assessing neuropathogenesis of acute encephalitis in humans. We have recently reported data on the phenotyping of cells involved in the inflammatory response within the CNS of non-human primates following IC inoculation with flaviviruses that exhibit an acceptable (YF 17D vaccine), unacceptable (LGTV), or unknown (TBEV/DEN4Δ30) level of attenuation for the CNS of humans (Maximova et al. 2008). In the present study, we performed a quantitative kinetic analysis of the cellular inflammatory responses in the CNS of non-human primates induced by these antigenically divergent attenuated flaviviruses.
IC inoculation of the attenuated flaviviruses (LGTV, TBEV/DEN4Δ30, or YF 17D) resulted in the induction of innate and adaptive cellular immune responses characterized by activation of resident CNS cells and infiltration by peripheral immune cells. We observed vigorous microglial activation in response to each virus, although the spatiotemporal patterns and magnitude of this response differed among the three viruses, probably reflecting the different neuropathogenicity of each virus. Microglial cells are the principal intrinsic immune effector cells of the CNS and are the first cell type to respond to CNS injury, infection, or inflammation (Gehrmann et al. 1995; Rock et al. 2004). However, little is known about the role of activated microglia in the pathogenesis of flavivirus encephalitis. One recent study suggested that increased microglial activation influences the outcome of flavivirus encephalitis in mice (Bréhin et al. 2008). We previously demonstrated a widespread activation of microglia in the CNS of monkeys infected with attenuated flaviviruses as well as a strong spatiotemporal relationship between increased microglial activation and neuronal degeneration (Maximova et al. 2008).
Microglia have a strong antigen-presenting function. Upon activation, microglia proliferate, change morphology, and assume many macrophage-like functions. Activated microglia contribute to the removal of degenerated neurons but still respect the integrity of surviving neurons, even in close vicinity of necrotic neurons. Two distinctive features of microglial activation were observed in response to LGTV that differentiated this flavivirus from TBEV/DEN4Δ30 or YF 17D. First, microglial activation in response to LGTV infection was significantly delayed. Second, in agreement with previously published data (Thind and Price 1966), LGTV induced more-intense and widespread microglial activation in the ventral horns of the spinal cord, which was associated with increased virus replication in motor neurons and their degeneration (Maximova et al. 2008). Taken together, these findings suggest that microglial activation plays a key role in the anti-flaviviral response initiated within the CNS and in the subsequent neuropathogenesis.
The immune functions of microglia are regulated by cytokines, including interferon gamma (IFN-γ), which is a major mediator of macrophage activation. Activation of microglia by IFN-γ induces proinflammatory T-lymphocyte–related chemokine genes as well as genes involved in antigen presentation. As a result, signals for T cell infiltration and antigen presentation are produced to allow interactions between microglia and T cells that probably contribute to the defense against invading pathogens (Rock et al. 2005). Indeed, in our study, virus-induced microglial activation was followed by the infiltration of peripheral lymphocytes into the CNS as early as 3 dpi. It is likely that the IC route of flavivirus inoculation resulted in activation of the afferent mechanism of immune surveillance in the CNS via the cerebrospinal fluid drainage to the cervical lymph nodes (CLNs) (Ransohoff et al. 2003). This pathway is consistent with a model in which initial virus-specific T cell activation occurs in the CLN, followed by chemokine-directed T cell trafficking into the CNS (Bergmann et al. 2006).
In acute viral encephalitis, the recruitment of immune cells into the CNS plays a fundamental role in the outcome of the disease. T cells play a key role and provide critical functions during control of CNS viral infections by destroying virus-infected cells, producing cytokines, increasing phagocytic activity of macrophages, and stimulating the local production of antibodies by B cells (Binder and Griffin 2001; Dörries 2001; Chambers and Diamond 2003; Bergmann et al. 2006). During coronavirus infection, T cell subsets exhibit different patterns of migration within the CNS (Bergmann et al. 2006). The majority of infiltrating CD4+ T cells have been shown to accumulate in the perivascular spaces, with a few trafficking to the parenchymal sites of coronavirus replication, whereas CD8+ T cells migrate into CNS parenchyma (Stohlman et al. 1998). In the present study, we analyzed the perivascular vs parenchymal localization of infiltrating T cells and show that CD4+ T cells and CD8+ T cells displayed different localization, with considerably greater numbers of CD4+ T cells retained within the perivascular spaces, compared with CD8+ T cells. In contrast, the parenchyma was infiltrated to a greater extent by CD8+ T cells than by CD4+ T cells.
These findings are consistent with the previously described predominance of CD8+ cytotoxic lymphocytes in the parenchymal compartment of postmortem brain tissue from fatal human tick-borne encephalitis (TBE) cases (Gelpi et al. 2006), and also with the greater number of T helper cells within perivascular cuffs in fatal human Japanese encephalitis (JE) cases (Johnson et al. 1985). This differential ability of CD8+ T cells vs CD4+ T cells to traffic through the infected tissue might be explained by the fact that perivascular CD4+ T cells are the primary source of the protease inhibitor protein TIMP-1, which prevents further migration of CD4+ T cells into the CNS parenchyma (Bergmann et al. 2006). In addition, in the absence of CD4+ T cells, parenchymal infiltration by CD8+ T cells was dramatically decreased and was associated with increased apoptosis, indicating that CD4+ T cells support both migration and survival of CD8+ T cells within the CNS (Stohlman et al. 1998).
Importantly, the CNS of monkeys inoculated with YF 17D vaccine virus showed a greater number of infiltrating CD4+ T cells than CD8+ T cells throughout the time course of infection. Other studies also showed that high CD4:CD8 ratios in the peripheral blood mononuclear cells were characteristic of YF 17 DD vaccinees (Santos et al. 2005). In contrast, the more-neurovirulent LGTV and TBEV/DEN4Δ30 viruses evoked a transient CD4:CD8 ratio inversion, which has been implicated in aberrant immune activation during dengue virus infection (Lei et al. 2001). The predominance of CD8+ cytotoxic lymphocytes within the CNS during flavivirus infection perhaps reflects the severity of neuroinflammation, since as it was also described for the majority of fatal human TBE cases (Gelpi et al. 2006). It should be emphasized that CD4:CD8 ratio inversion in our study was transient within a short time period (21 dpi), and that without longitudinal collection of brain and spinal cord tissue samples, it might have been missed. Although a role for the temporal CD4:CD8 T cell ratio changes in the neuropathogenesis of flaviviral encephalitis requires further investigation, our data indicate that a high CD4:CD8 T cell ratio seems to be the most reliable hallmark of neuroinfection with YF 17D, differentiating this successful flavivirus vaccine from the more-neurovirulent LGTV or TBEV/DEN4Δ30.
It is well documented that B cells and antibodies protect against viral CNS infection and contribute to the eradication of infection by clearing virus from the brain or preventing viral persistence (Liu and Chambers 2001; Diamond et al. 2003; Griffin 2003; Tschen et al. 2006). Studies have shown that the majority of B cells infiltrating the brain are composed of IgG- or IgA-positive cells, which suggests that their activation occurred prior to entry into the CNS (Griffin 2003). Studies of postmortem brain tissue from fatal human cases of JE (Johnson et al. 1985) and TBE (Gelpi et al. 2005,2006) reported that B cells infiltrating the CNS remained within the perivascular spaces. In the present study, analysis of tissue distribution of infiltrated B cells clearly demonstrated that these cells were able to leave the perivascular compartment and invade the CNS parenchyma. However, considerably greater numbers of B cells were retained within the perivascular spaces, compared with the parenchymal compartment, during the time course of CNS infection. Following virus clearance from the CNS (30 dpi) to levels below the limit of detection (Maximova et al. 2008), B cell infiltration significantly decreased, and the vast majority of B cells were found only within the perivascular compartments. Based on these data, it is reasonable to suggest that both perivascular and parenchymal localization of B cells is important for them to participate in clearing the virus from the CNS. This might possibly take place through the establishment of immunological synapses between B and T cells (Barcia et al. 2008) within the perivascular spaces, where B and T cells most often encounter each other, and the local production of antibody within both the perivascular and parenchymal compartments.
As a part of the innate CNS response to viral infection, the rapid local production of type 1 IFN (IFN-α and IFN-β) could decrease virus replication before and during the induction of adaptive immune responses. Type II interferon (IFN-γ) appears to be a key cytokine in the activation of microglial cells and serves critical functions in both innate and adaptive immunity. IFN-γ is involved in the successful defense against a variety of viruses (Griffin 2003; Shrestha et al. 2006). Moreover, the importance of IFN-γ was demonstrated for site-specific clearance of alphavirus, particularly from spinal cord motor neurons (Binder and Griffin 2001). However, flaviviruses appear to be capable of attenuating some IFN-dependent antiviral effector mechanisms (Chambers and Diamond 2003). Inhibition by RNA viruses of type I IFN production or signaling increases the probability that the virus will not be cleared (Griffin 2003). In light of a recent report that the non-structural LGTV protein NS5 antagonizes IFN signaling (Best et al. 2005), it is tempting to speculate that the delayed microglial activation and decreased infiltration by T and B cells observed in the CNS of LGTV-infected monkeys in this study contributed to delayed virus clearance and increased neuronal degeneration as described by us previously (Maximova et al. 2008).
We conclude that significant differences exist in the time course, composition, and magnitude of cellular inflammatory responses in the CNS of non-human primates during infection with antigenically divergent attenuated flaviviruses. The data implicate microglial activation, the compartmentalization and relative proportions of CD4+ and CD8+ T cell subsets, and B cell responses as the differential factors in the neuropathogenesis of flavivirus infection in this model. As T cell and B cell infiltration in the CNS increased, there was a concomitant decline or elimination of infectious virus (Maximova et al. 2008). Our data also demonstrate that following elimination of virus from the CNS, lymphocytic infiltration is undergoing resolution in situ by means of apoptosis, which is predominately confined to the perivascular spaces. Similar to the findings reported previously for human cases of fatal TBE (Gelpi et al. 2006), we did not observe unequivocal evidence of neuronal apoptosis, indicating that apoptosis is not a mechanism of neuronal death in flavivirus neuroinfection of primate hosts. Our results support the notion (Johnson et al. 1985) that in the immunocompetent host, it is not a failure of B cell response or a failure of virus clearance by T cells and macrophages/microglia, but rather the kinetics and magnitude of these responses in the context of the spatiotemporal pattern of virus replication that appear to be determinants of the outcome in flavivirus encephalitis.
Development of live-virus vaccines against neurotropic infections requires preclinical testing of new vaccine candidates for neurovirulence in non-human primates. The decision as to whether a new vaccine candidate is sufficiently attenuated should be made based on comparison with a reference vaccine virus known to exhibit an acceptable level of attenuation for the CNS of humans. Unfortunately, for new live-vaccine candidates against such neurotropic flavivirus infections as TBE, St. Louis encephalitis, or West Nile virus, the appropriate reference vaccine viruses do not exist. Among existing live flavivirus vaccines, approved or under development, only the yellow fever YF 17D vaccine has a remarkable record of safety and efficacy (Monath 2005). However, evidence is lacking to justify the use of this vaccine as a “standard” flavivirus vaccine comparator (Maximova et al. 2009). The current study would argue against a universal flavivirus vaccine reference and for virus-specific standards. Overall, our results provide a benchmark for investigation of cellular inflammatory responses induced by attenuated flaviviruses in the CNS of primate hosts and provide insight into the neuropathogenesis of flavivirus encephalitis that might guide the development of safe and effective live-virus vaccines.
Acknowledgments
This work was supported by funds provided by the National Institute of Allergy and Infectious Diseases (NIAID) Intramural Research Program.
We acknowledge the staff of Bioqual and Pathology Associates, Charles River Laboratories, for their excellent assistance in conducting the studies. We also thank Drs. S. Whitehead and J. Taubenberger, NIAID, National Institutes of Health, for helpful discussions and critical reading of the manuscript.
References
- Barcia C, Gomez A, de Pablos V, Fernández-Villalba E, Liu C, Kroeger KM, Martín J, et al. (2008) CD20, CD3, and CD40 ligand microclusters segregate three-dimensionally in vivo at B-cell-T-cell immunological synapses after viral immunity in primate brain. J Virol 82:9978–9993 [DOI] [PMC free article] [PubMed] [Google Scholar]
- Bergmann CC, Lane TE, Stohlman SA (2006) Coronavirus infection of the central nervous system: host-virus stand-off. Nat Rev Microbiol 4:121–132 [DOI] [PMC free article] [PubMed] [Google Scholar]
- Best SM, Morris KL, Shannon JG, Robertson SJ, Mitzel DN, Park GS, Boer E, et al. (2005) Inhibition of interferon-stimulated JAK-STAT signaling by a tick-borne flavivirus and identification of NS5 as an interferon antagonist. J Virol 79:12828–12839 [DOI] [PMC free article] [PubMed] [Google Scholar]
- Binder GK, Griffin DE (2001) Interferon-gamma-mediated site-specific clearance of alphavirus from CNS neurons. Science 293:303–306 [DOI] [PubMed] [Google Scholar]
- Bréhin AC, Mouries J, Frenkiel MP, Dadaglio G, Despres P, Lafon M, Couderc T (2008) Dynamics of immune cell recruitment during West Nile encephalitis and identification of a new CD19+B220-BST-2+ leukocyte population. J Immunol 180:6760–6767 [DOI] [PubMed] [Google Scholar]
- Chambers TJ, Diamond MS (2003) Pathogenesis of flavivirus encephalitis. Adv Virus Res 60:273–342 [DOI] [PMC free article] [PubMed] [Google Scholar]
- Diamond MS, Shrestha B, Mehlhop E, Sitati E, Engle M (2003) Innate and adaptive immune responses determine protection against disseminated infection by West Nile encephalitis virus. Viral Immunol 16:259–278 [DOI] [PubMed] [Google Scholar]
- Dörries R (2001) The role of T-cell-mediated mechanisms in virus infections of the nervous system. Curr Top Microbiol Immunol 253:219–245 [DOI] [PubMed] [Google Scholar]
- Gehrmann J, Matsumoto Y, Kreutzberg GW (1995) Microglia: intrinsic immuneffector cell of the brain. Brain Res Brain Res Rev 20:269–287 [DOI] [PubMed] [Google Scholar]
- Gelpi E, Preusser M, Garzuly F, Holzmann H, Heinz FX, Budka H (2005) Visualization of Central European tick-borne encephalitis infection in fatal human cases. J Neuropathol Exp Neurol 64:506–512 [DOI] [PubMed] [Google Scholar]
- Gelpi E, Preusser M, Laggner U, Garzuly F, Holzmann H, Heinz FX, Budka H (2006) Inflammatory response in human tick-borne encephalitis: analysis of postmortem brain tissue. J Neurovirol 12:322–327 [DOI] [PubMed] [Google Scholar]
- Griffin DE (2003) Immune responses to RNA-virus infections of the CNS. Nat Rev Immunol 3:493–502 [DOI] [PMC free article] [PubMed] [Google Scholar]
- Johnson RT, Burke DS, Elwell M, Leake CJ, Nisalak A, Hoke CH, Lorsomrudee W (1985) Japanese encephalitis: immunocytochemical studies of viral antigen and inflammatory cells in fatal cases. Ann Neurol 18:567–573 [DOI] [PubMed] [Google Scholar]
- Kelley TW, Prayson RA, Ruiz AI, Isada CM, Gordon SM (2003) The neuropathology of West Nile virus meningoencephalitis. A report of two cases and review of the literature. Am J Clin Pathol 119:749–753 [DOI] [PubMed] [Google Scholar]
- Lei HY, Yeh TM, Liu HS, Lin YS, Chen SH, Liu CC (2001) Immunopathogenesis of dengue virus infection. J Biomed Sci 8:377–388 [DOI] [PubMed] [Google Scholar]
- Liu T, Chambers TJ (2001) Yellow fever virus encephalitis: properties of the brain-associated T-cell response during virus clearance in normal and gamma interferon-deficient mice and requirement for CD4+ lymphocytes. J Virol 75:2107–2118 [DOI] [PMC free article] [PubMed] [Google Scholar]
- Martin RF, Bowden DM (2000) Primate Brain Maps: Structure of the Macaque Brain. Amsterdam, Elsevier
- Maximova OA, Ward JM, Asher DM, St Claire M, Finneyfrock BW, Speicher JM, Murphy BR, et al. (2008) Comparative neuropathogenesis and neurovirulence of attenuated flaviviruses in nonhuman primates. J Virol 82:5255–5268 [DOI] [PMC free article] [PubMed] [Google Scholar]
- Maximova OA, Whitehead SS, Murphy BR, Pletnev AG (2009) Neuropathogenesis and neurovirulence of live flaviviral vaccines in monkeys. J Virol 83:5290–5292 [DOI] [PMC free article] [PubMed] [Google Scholar]
- Miller JD, van der Most RG, Akondy RS, Glidewell JT, Albott S, Masopust D, Murali-Krishna K, et al. (2008) Human effector and memory CD8+ T cell responses to smallpox and yellow fever vaccines. Immunity 28:710–722 [DOI] [PubMed] [Google Scholar]
- Monath TP (2005) Yellow fever vaccine. Expert Rev Vaccines 4:553–574 [DOI] [PubMed] [Google Scholar]
- Nathanson N, Davis M, Thind IS, Price WH (1966) Histological studies of the monkey neurovirulence of group B arboviruses. II. Selection of indicator centers. Am J Epidemiol 84:524–540 [DOI] [PubMed] [Google Scholar]
- Omalu BI, Shakir AA, Wang G, Lipkin WI, Wiley CA (2003) Fatal fulminant pan-meningo-polioencephalitis due to West Nile virus. Brain Pathol 13:465–472 [DOI] [PMC free article] [PubMed] [Google Scholar]
- Pletnev AG, Men R (1998) Attenuation of the Langat tick-borne flavivirus by chimerization with mosquito-borne flavivirus dengue type 4. Proc Natl Acad Sci USA 95:1746–1751 [DOI] [PMC free article] [PubMed] [Google Scholar]
- Pletnev AG, Swayne DE, Speicher J, Rumyantsev AA, Murphy BR (2006) Chimeric West Nile/dengue virus vaccine candidate: preclinical evaluation in mice, geese and monkeys for safety and immunogenicity. Vaccine 24:6392–6404 [DOI] [PubMed] [Google Scholar]
- Ransohoff RM, Kivisakk P, Kidd G (2003) Three or more routes for leukocyte migration into the central nervous system. Nat Rev Immunol 3:569–581 [DOI] [PubMed] [Google Scholar]
- Rock RB, Gekker G, Hu S, Sheng WS, Cheeran M, Lokensgard JR, Peterson PK (2004) Role of microglia in central nervous system infections. Clin Microbiol Rev 17:942–964 [DOI] [PMC free article] [PubMed] [Google Scholar]
- Rock RB, Hu S, Deshpande A, Munir S, May BJ, Baker CA, Peterson PK, et al. (2005) Transcriptional response of human microglial cells to interferon-gamma. Genes Immun 6:712–719 [DOI] [PubMed] [Google Scholar]
- Rumyantsev AA, Chanock RM, Murphy BR, Pletnev AG (2006) Comparison of live and inactivated tick-borne encephalitis virus vaccines for safety, immunogenicity and efficacy in rhesus monkeys. Vaccine 24:133–143 [DOI] [PubMed] [Google Scholar]
- Santos AP, Bertho AL, Dias DC, Santos JR, Marcovistz R (2005) Lymphocyte subset analyses in healthy adults vaccinated with yellow fever 17DD virus. Mem Inst Oswaldo Cruz 100:331–337 [DOI] [PubMed] [Google Scholar]
- Shrestha B, Wang T, Samuel MA, Whitby K, Craft J, Fikrig E, Diamond MS (2006) Gamma interferon plays a crucial early antiviral role in protection against West Nile virus infection. J Virol 80:5338–5348 [DOI] [PMC free article] [PubMed] [Google Scholar]
- Sitati EM, Diamond MS (2006) CD4+ T-cell responses are required for clearance of West Nile virus from the central nervous system. J Virol 80:12060–12069 [DOI] [PMC free article] [PubMed] [Google Scholar]
- Sitati EM, McCandless EE, Klein RS, Diamond MS (2007) CD40-CD40 ligand interactions promote trafficking of CD8+ T cells into the brain and protection against West Nile virus encephalitis. J Virol 81:9801–9811 [DOI] [PMC free article] [PubMed] [Google Scholar]
- Sohn YM, Tandan JB, Yoksan S, Ji M, Ohrr H (2008) A 5-year follow-up of antibody response in children vaccinated with single dose of live attenuated SA14-14-2 Japanese encephalitis vaccine: immunogenicity and anamnestic responses. Vaccine 26:1638–1643 [DOI] [PubMed] [Google Scholar]
- Stohlman SA, Bergmann CC, Lin MT, Cua DJ, Hinton DR (1998) CTL effector function within the central nervous system requires CD4+ T cells. J Immunol 160:2896–2904 [PubMed] [Google Scholar]
- Thind IS, Price WH (1966) A chick embryo attenuated strain (TP21 E5) of Langat virus. I. Virulence of the virus for mice and monkeys. Am J Epidemiol 84:193–213 [DOI] [PubMed] [Google Scholar]
- Tschen SI, Stohlman SA, Ramakrishna C, Hinton DR, Atkinson RD, Bergmann CC (2006) CNS viral infection diverts homing of antibody-secreting cells from lymphoid organs to the CNS. Eur J Immunol 36:603–612 [DOI] [PMC free article] [PubMed] [Google Scholar]


