Abstract
Repeated (but not acute) exposure to brief, noninjurious seizures evoked by minimal electroconvulsive shock (ECS) decreases neuronal death in limbic system and increases mRNA levels for nerve growth factor (NGF). Thus, the induction of NGF is a potential mechanism for the neuroprotection evoked by repeated ECS. The neuroprotective action of NGF is mediated by the TrkA receptor. This study determined whether repeated ECS exposure increased TrkA and NGF protein levels. To determine the functional significance of changes in these proteins, we compared the effects of ECS given daily either for 7 days (chronic ECS) or for 1 day (acute ECS). After chronic ECS, upregulation of both NGF and TrkA was found in perirhinal cortex, thalamus, and amygdala. In hippocampus, TrkA was upregulated in CA2, CA3 and CA4. NGF increase in hippocampus was found in CA1 and dentate gyrus. In frontal cortex and substantia innominata, an increase in NGF (but not in TrkA) was found. In most brain regions, TrkA and NGF remained unchanged after acute ECS. Our results demonstrate that repeated exposure to ECS causes an upregulation of TrkA and NGF proteins in several limbic areas in which neuroprotective effects are observed suggesting that NGF contributes to ECS-evoked neuroprotection.
Keywords: Limbic seizures, Neuroprotection, Immunohistochemistry, NGF, TrkA, electroconvulsive shock
1. Introduction
Brief, noninjurious seizures evoked by repeated exposure to minimal electroconvulsive shock (ECS) have been shown to decrease vulnerability to neuronal cell death in limbic system regions (Kondratyev et al., 2001; Masco et al., 1999), and increase mRNA levels for nerve growth factor (NGF) in some of these brain areas, including hippocampus and rhinal cortex (Kondratyev et al., 2002). Chronic (over the period of 7 days) ECS also resulted in a sustained increase in both mRNA and protein for another neurotrophic factor, basic fibroblast growth factor (bFGF, also called FGF-2) (Gwinn et al., 2002; Kondratyev et al., 2002). Since these trophic factors have been shown previously to possess potent protective activity against excitotoxicity-related cell death (Dixon et al., 1997; Frim et al., 1993; Hefti et al., 1993; Liu et al., 1993; Montero and Hefti 1989), we hypothesized that the induction of signaling associated with the neurotrophic factors represents a potential mechanism for the neuroprotective action of chronic ECS treatment. In this study we examined protein expression levels of NGF and its specific receptors following chronic ECS exposure.
NGF plays an important role in the differentiation, survival, plasticity, and repair of neurons (Hefti et al., 1993; Mattson et al., 1995; Sofroniew et al., 2001) and has been shown to increase in the brain after neuronal stimulation and/or injury (for review, see (Hughes et al., 1999; Jankowsky and Patterson 2001; Levi-Montalcini et al., 1996)). For example, an increase in NGF mRNA has been shown during processes that accompany memory consolidation (Woolf et al., 2001) as well as after injury induced by ischemic insults, prolonged seizures, and epilepsy (Elliott and Gall 2000; Gall and Isackson 1989; Jankowsky and Patterson 2001; Lauterborn et al., 1994; Lee et al., 1998; Poulsen et al., 2004). In addition, intense neuronal stimulation without injury also resulted in upregulation of NGF. Widespread increases in NGF mRNA (but not in trkA mRNA (Bengzon et al., 1993)) and protein were found following kindling-induced seizures (Bengzon et al., 1992; Morimoto et al., 1998; Sato et al., 1996). Moreover, an increase in mRNA for NGF has been demonstrated following brief, noninjurious, recurrent limbic seizures evoked by focal administration of the GABA receptor antagonist bicuculline into the area tempestas, an epileptogenic site within the anterior piriform cortex (Piredda and Gale 1985; Piredda and Gale 1986) as well as after ECS exposure (Follesa et al., 1994; Kondratyev et al., 2002). The latter NGF increase is independent of injury since ECS treatment (either minimal or maximal), even when given repeatedly over several days, has not been found to induce neuronal injury (Devanand et al., 1994; Kondratyev et al., 2001; Masco et al., 1999; Orzi et al., 1990).
To exert its effects, NGF selectively binds to its high affinity TrkA receptors, located at the plasma membrane of responsive cells, which causes TrkA receptors to form homodimers and activates the intrinsic tyrosine kinase activity of the receptor resulting in autophosphorylation of receptor subunits. Phosphorylation of TrkA receptors is necessary for further downstream actions of NGF (Schlessinger 1994; Schlessinger and Ullrich 1992) including the induction of early genes such as c-fos, c-jun, and c-myc (Hughes et al., 1999; Maruta and Burgess 1994) generally thought to account for the most profound effects of NGF, including neuronal survival (Bonni and Greenberg 1997; Dudek et al., 1997).
For NGF to play a role in ECS-evoked neuroprotection, TrkA receptors should be present in the protected areas. However, in most of the regions of interest in our study, the constitutive expression of TrkA receptors is extremely low. The expression of TrkA receptors in the adult CNS was previously found only in a limited number of brain areas. TrkA was found to be expressed in cholinergic neurons of the basal forebrain and the striatum (Holtzman et al., 1992; Merlio et al., 1992; Steininger et al., 1993; Vazquez and Ebendal 1991). TrkA is also expressed in noncholinergic neurons in two thalamic nuclei (paraventricular anterior and reuniens), in the rostral and intermediate subnuclei of the interpenduncular nucleus, neurons in the medulla (ventrolateral and paramedian), the prepositus hypoglossal nucleus, and in the area postrema (Holtzman et al., 1995; Merlio et al., 1992; Venero and Hefti 1993). We hypothesized that chronic ECS would exert its neuroprotective action via the upregulation of NGF expression and activation of either the existing TrkA receptors in the areas mentioned above or a de novo synthesis of TrkA following ECS in the areas where these receptors are not normally found. In this study, we used an immunohistochemical approach to determine whether ECS treatment causes increases in expression of NGF and TrkA proteins and whether the upregulation of TrkA occurs in the same brain areas that contain measurable levels of NGF protein. To examine the potential relevance of changes in these parameters to neuroprotection, we compared the effects of a neuroprotective chronic ECS treatment with the effects of an acute ECS treatment that was shown not to be neuroprotective [Kondratyev and Gale, unpublished observation].
We report here that chronic minimal ECS resulted in an upregulation of both NGF and TrkA protein expression in the perirhinal cortex, thalamic nuclei (paraventricular and reunions) and in amygdala. Additionally, we found an increase in TrkA immunoreactivity in the selected hippocampal subfields. NGF immunoreactivity also increased in the dentate gyrus and in the CA1 region of the hippocampus, in the frontal cortex and in substantia innominata. Except for the CA2 hippocampal subfield and substantia innominata, an upregulation of TrkA or NGF was not found after acute ECS in all brain areas examined.
2. Materials and methods
Animals
Adult male Sprague-Dawley rats weighing 220–250 g were used for all experiments. Rats were kept in cages with free access to food and water in a temperature- (21°C) and light-controlled (12:12) environment. All treatments were given during the light period. All protocols were reviewed and approved by the Georgetown University Animal Care and Use Committee according to American Association for Accreditation of Laboratory Animal guidelines. A record of animal weights was kept, and it was determined that average weights did not differ between treatment groups prior to, during, or at the completion of the experiments. No significant weight loss occurred in any experimental groups. Animals were randomly assigned to control (sham-treated) or one of two experimental groups (treated with acute or chronic minimal ECS) at the beginning of the experiment.
Treatment groups
To investigate the effects induced by acute or chronic ECS on the levels of NGF and/or TrkA receptors proteins, rats were divided into three treatment groups. The control group received sham ECS treatment, the second group was given acute ECS treatment, and the third group was given repeated (chronic) minimal ECS treatments.
ECS seizure treatment
We selected the ECS procedure previously demonstrated to induce the largest and most selective increases in neurotrophic factors in limbic structures (Follesa et al., 1994; Gwinn et al., 2002; Kondratyev et al., 2002). It should be noted that minimal and maximal ECS both produce increases in mRNA for FGF-2 and NGF, but the changes in limbic areas are somewhat more pronounced and more anatomically selective with minimal ECS (Follesa et al., 1994). Thus, the minimal ECS procedure was selected for this study. Minimal ECS was administered in a standard fashion via corneal electrodes (60 Hz, 200ms, 30–35 mA) delivered by a Whalquist stimulator (Whalquist Instrument Company) as described previously (Gwinn et al., 2002; Kondratyev et al., 2002). Control (sham) animals received the same handling and contact with the electrodes, but no current was passed. Animals were behaviorally observed to ensure that minimal limbic motor seizures (clonic movements of the face and forelimbs) lasting 5–10 s occurred after each ECS application. A single daily ECS treatment session consisted of three ECS seizures given at 30 min intervals (i.e., at 0, 30, 60 min). Acute treatment consisted of a single ECS treatment session. Chronic ECS consisted of daily treatments for 7 days. Animals that did not display limbic motor seizures after stimulation were re-stimulated at the same or slightly higher amperage up to three times before being excluded as non-responders. Animals were also excluded if they displayed any evidence of tonic-clonic seizures with hindlimb involvement. No more than 5% of the rats in any experiment were excluded by these criteria.
Tissue preparation
Each of the ECS-treated groups was divided into 2 subgroups (n=6 per subgroup). Each subgroup was sacrificed by decapitation at 7 or 24 hr after the last ECS treatment. The group that received sham ECS treatment (n=6) was sacrificed after 24 hr. Animals were deeply anesthetized with equithesin (50 mg/ml) and perfused with 150–200 ml of 4% paraformaldehyde in a buffered saline (pH 7.4). Following perfusion, the brains were removed, postfixed in the same fixative solution for 24 hr at 4°C, and stored in phosphate buffered saline (PBS, pH 7.4). The brains were sectioned with a vibratome into a set of 50 µm coronal sections.
Selection of the antibodies for immunohistochemistry
Rabbit polyclonal antibodies against TrkA (UBI, Lake Placid, NY) and NGF (AB927; 1:500; Chemicon International, Temecula, CA) were selected for the studies. The specificity of the anti-TrkA and anti-NGF antibodies was verified by Western blotting (Supplementary Information, Fig. 1S). Anti-TrkA antibody recognized a major protein band (MW ~140 kDa, Supplementary Information, Fig. 1S-A) which tyrosine phosphorylation was increased following NGF addition to the tissue homogenates (Supplementary Information, Fig. 1S-B). Anti-NGF antibody recognized a single band with a MW of ~18kDa (Supplementary Information, Fig. 1S-C). The specificity of the antibodies was further confirmed by pre-absorption of the respective antibodies either with a TrkA-enriched membrane fraction of PC-12 cells (for TrkA antibodies; 100–500 µg/ml) or with a 2.5S mouse NGF protein (for anti-NGF antibodies; 0.2–3 µg/ml, Sigma), which resulted in the disappearance of immunohistochemical staining (see below) in a concentration-dependent manner (not shown).
Immunohistochemistry
NGF and TrkA immunohistochemistry was carried out using an ABC Elite detection kit (Vector, Burlingame, CA) following manufacturer’s recommendations. Briefly, sets of free-floating adjacent brain sections were washed in PBS, treated with 0.3% hydrogen peroxide for 30 minutes, and incubated overnight with rabbit polyclonal antibodies against either TrkA (1:500) or NGF (1:500). Sections were washed and then incubated overnight with the anti-rabbit biotinylated secondary antibody (1:200; Vector, Burlingame, CA). The antigen-antibody distribution was determined by using an avidin-biotin complex (ABC Elite kit, Vector, Burlingame, CA) followed by a nickel-intensified diaminobenzidine staining. Control staining was performed in the absence of the primary antibodies. After being stained, the sections were mounted on gelatin-coated slides, dehydrated in graded alcohol, cleared in xylene, and coverslipped. The sections were processed in batches (which included all treatment conditions and time points) and analyzed by an individual blind to the treatment conditions.
Analysis of immunoreactivity
The quantification of immunoreactivity in TrkA or NGF positive neurons and/or processes was obtained by measuring the number of stained bodies (neurons and/or processes) in the stained sections using a computer image acquisition and analysis software (Labworks-UVP Laboratory Products; Upland, CA). Briefly, images were captured using a 10x or 40x magnification via a digital photo camera (Coolpix995; Nikon, Denver, CO) attached to a microscope (VWR Scientific Products). Immunoreactive cells and/or processes considered for counting were confined to a specific range of optical density for each batch; only cells and/or processes showing staining within this range were automatically counted by the software. Three to five defined selected fields were counted within each brain region for each section, and the average of these values was calculated. The following brain regions were examined: hippocampus, cortex (including piriform, entorhinal, perirhinal, and frontal), amygdala, thalamus, olfactory bulbs, and striatum. Statistical comparisons were based on analysis of variance (ANOVA) with Fisher’s post-hoc test.
3. Results
Increase in both NGF and TrkA immunoreactivity in the same brain regions after chronic ECS
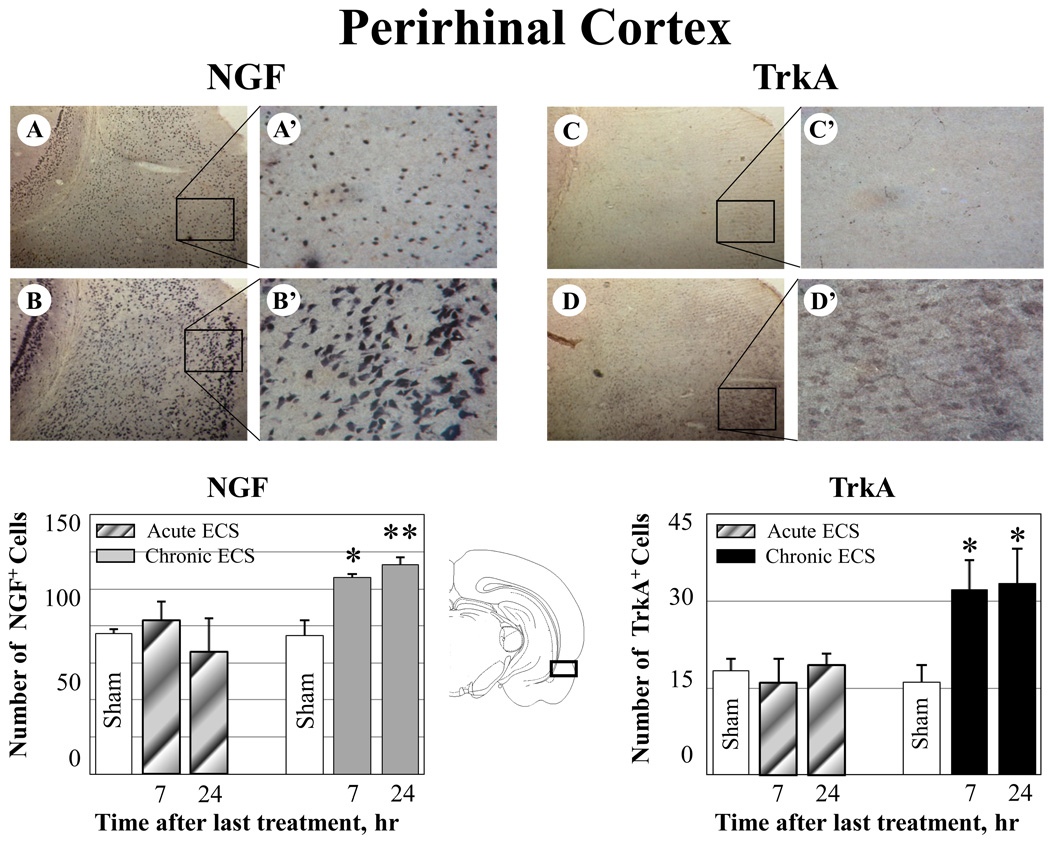
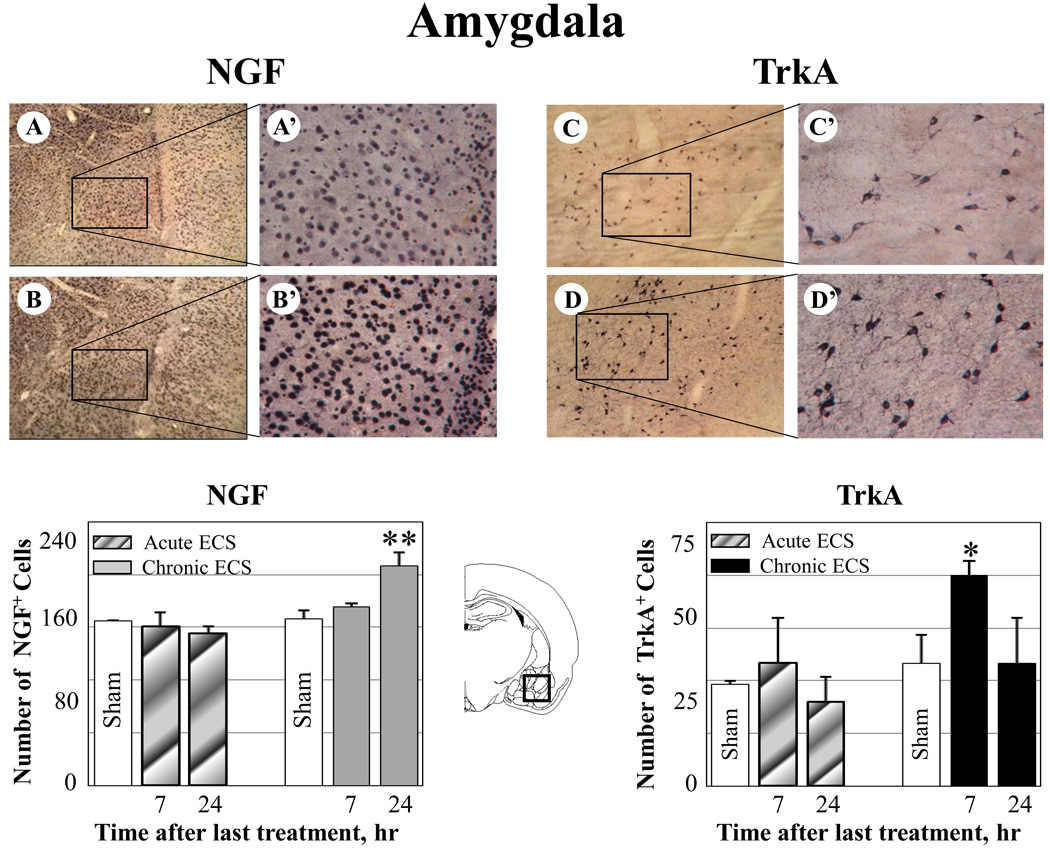
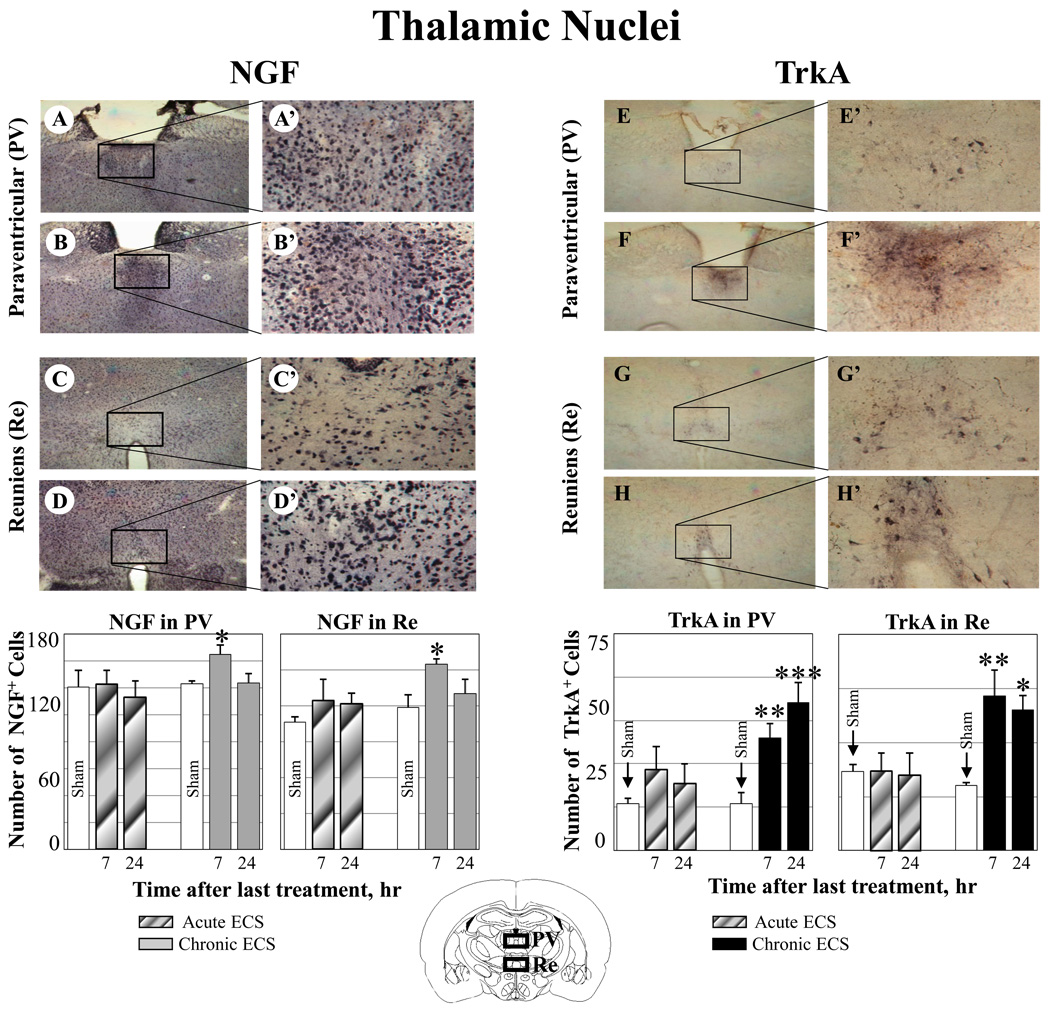
Chronic ECS (7 day treatment), but not acute ECS (1 day treatment) produced an increase in both NGF and its TrkA receptor immunoreactivity in the perirhinal cortex, thalamic nuclei (reuniens and paraventricular), and amygdala, as measured at 7 and 24 hr after the last seizure (Fig. 1–Fig. 3). No significant changes in NGF or Trk immunoreactivity was found in rats treated with acute ECS (Fig. 1–Fig. 3).
Fig. 1.
Effect of ECS on NGF and TrkA immunoreactivity in the perirhinal cortex. A–D: Representative photographs of NGF (A–B) and TrkA (C–D) immunoreactivity in sham treated control animals (A, C), and at 24hr (B, D) after chronic ECS treatment. Histograms show the mean values (for each groups of animals; n=6) of the number of NGF or TrkA immunopositive cells after acute (striped bars) or chronic ECS (solid bars), as compared to control (sham ECS) group (open bars). Asterisks indicate significant difference (*P<0.05 ; **P<0.01; ANOVA with Fisher’s test) from control group. A black box in the schematic brain section illustrates the area from which the photographs and measurements were taken. Photographs were acquired at 10x (A – D) and 40x magnification (A’ – D’).
Fig. 3.
Effect of ECS on NGF and TrkA immunoreactivity in the amygdala. A–B: Representative photographs of NGF immunoreactivity in (A) sham treated control animals, and (B) at 24 hr after chronic ECS treatment; C–D: Representative photographs of TrkA immunoreactivity in (C) sham treated control animals and (D) at 7 hr after chronic ECS treatment. Histograms show the mean values (for each groups of animals; n=6) of the number of NGF or TrkA immunopositive cells after acute (striped bars) or chronic ECS (solid bars), as compared to control (sham ECS) group (open bars). Asterisks indicate significant difference (*P<0.05 ; **P<0.01; ANOVA with Fisher’s test) from control group. A black box in the schematic brain section illustrates the area from which the photographs and measurements were taken. Photographs were acquired at 10x (A – D) and 40x magnification (A’ – D’).
In particular, increases in both NGF and TrkA immunoreactivity were found in the perirhinal cortex (Fig. 1 B-B’, NGF; D-D’, TrkA). Very weak immunoreactivity for TrkA was detected in control (sham treated) animals (Fig. 1 B-B’). No changes in either NGF or TrkA immunoreactivity were found in rats treated with acute ECS (Fig. 1).
Similarly, increases in both NGF and TrkA immunoreactivity were found in the paraventricular (Fig. 2 B-B’, NGF; F-F’, TrkA) and reuniens thalamic nuclei (Fig. 2 D-D’, NGF; H-H’, TrkA). In contrast, significantly weaker immunoreactivity for NGF and TrkA was detected in control (sham treated) animals (Fig. 2 A-A’, C-C’ NGF; E-E’, G-G’, TrkA) or in rats treated with acute ECS (Fig. 2).
Fig. 2.
Effect of ECS on NGF and TrkA immunoreactivity in the paraventicular (PV) and reuniens (Re) thalamic nuclei. Representative photographs illustrate NGF (A–D) and TrkA (E–H) immunoreactivity in sham treated control animals (A, C, E, and D), and at 7 hr after chronic ECS treatment (B, D, F, and H). Histograms show the mean values (for each groups of animals; n=6) of the number of NGF or TrkA immunopositive cells after acute (striped bars) or chronic ECS (solid bars), as compared to control (sham ECS) group (open bars). Asterisks indicate significant difference (*P<0.05 ; **P<0.01; ***P<0.001; ANOVA with Fisher’s test) from control group. The black boxes in the schematic brain section illustrate the areas from which the photographs and measurements were taken. Photographs were acquired at 10x (A – F) and 40x magnification (A’ – F’).
A significant increase in both NGF and TrkA immunoreactivity was also detected in the amygdala; however, these increases were not co-localized in the same amygdala subregions. In particular, while a significant increase in NGF immunoreactivity was detected in the basomedial nucleus of the amygdala, elevated levels of TrkA were found in the basolateral amygdaloid nucleus (Fig. 3 C-C’, NGF; F-F’, TrkA). Both NGF and TrkA immunoreactivity remained unchanged in animals treated with acute ECS (Fig. 3).
Increases in TrkA, but not NGF, immunoreactivity after chronic ECS
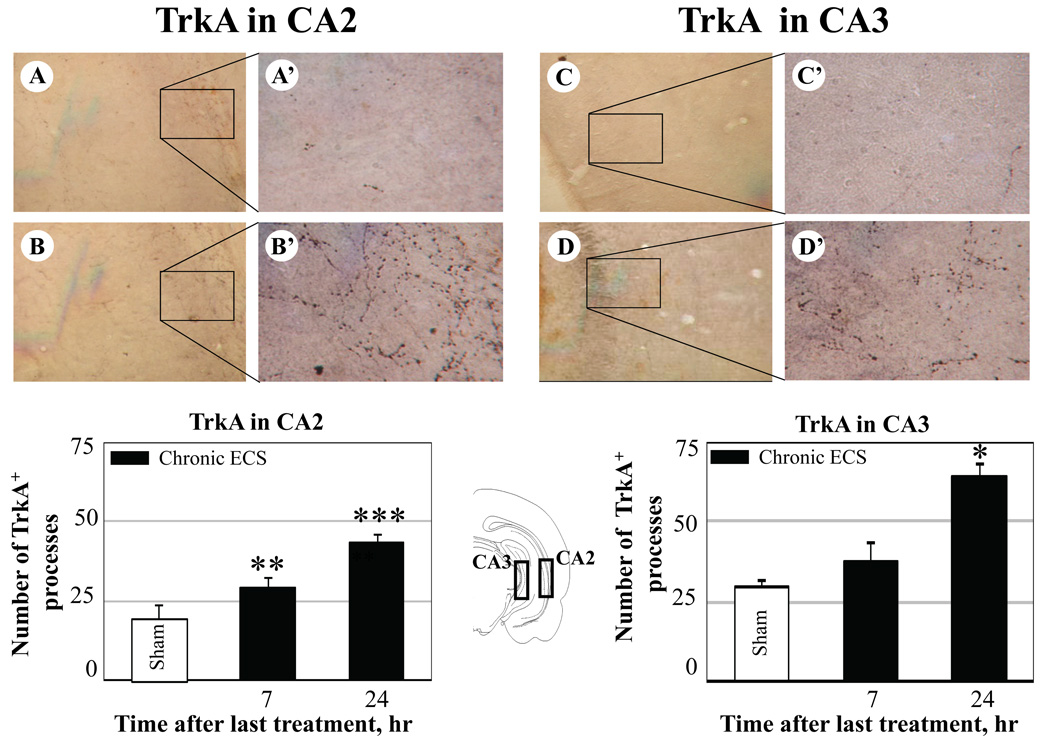
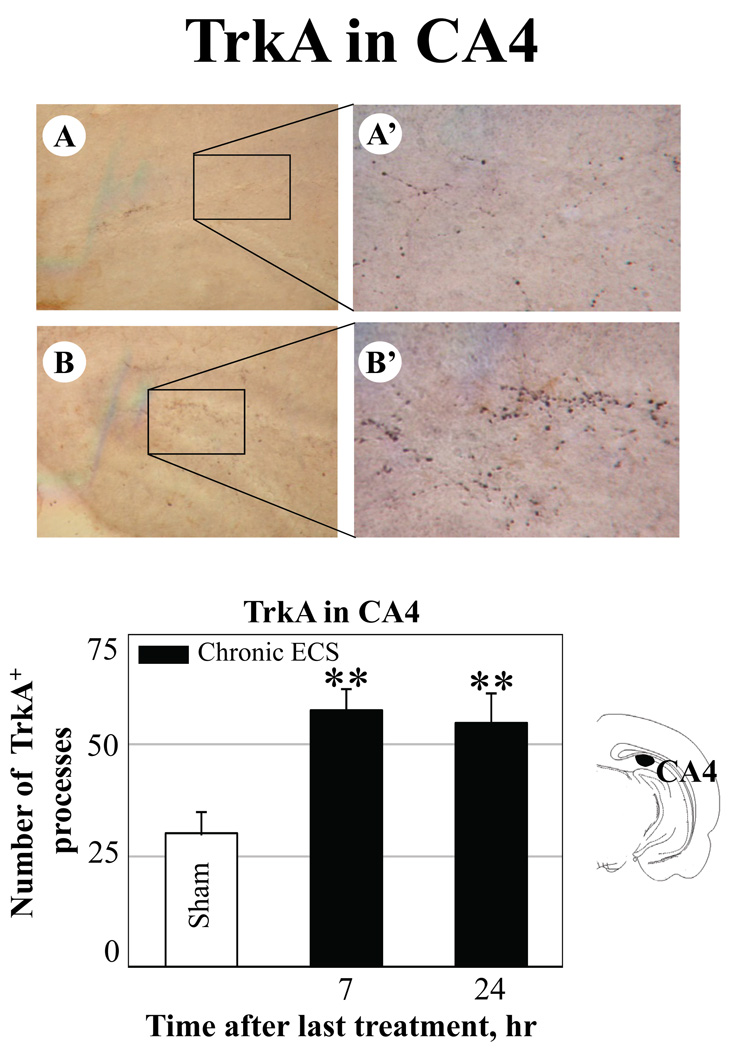
Chronic ECS treatment produced increases in immunoreactivity for TrkA but not for NGF in the CA2 (Fig. 4 B-B’), CA 3 (Fig. 4 D-D’), and CA 4 (polymorph layer of the dentate gyrus; Fig. 5 B-B’) subfields of the hippocampus as compared to sham-treated control animals (Fig. 4 A-A’, C-C’, CA2 and CA3; Fig. 5 A-A’, CA4). TrkA immunoreactivity in the CA2 layer increased rapidly, reaching significance by 7 hr, and remained elevated at 24 hr after the last seizure. In the CA3 layer, a significant increase in TrkA was detected 24 hr after chronic ECS treatment.
Fig. 4.
Effect of chronic ECS on TrkA immunoreactivity in the CA2 (A – B), and in the CA3 subfields of the hippocampus (C – D). Representative photographs illustrate TrkA immunoreactivity in sham treated control animals (A and C), and at 24 hr (B and D) after chronic ECS treatment. Histograms show the mean values (for each groups of animals; n=6) of the number of TrkA immunopositive cell processes after chronic ECS (solid bars), as compared to control (sham ECS) group (open bars). Asterisks indicate significant difference (*P<0.05 ; **P<0.01; ***P<0.001; ANOVA with Fisher’s test) from control group. The black boxes in the schematic brain section illustrate the areas from which the photographs and measurements were taken. Photographs were acquired at 10x (A – D) and 40x magnification (A’ – D’).
Fig. 5.
Effect of chronic ECS on TrkA immunoreactivity in the polymorph layer of dentate gyrus (CA4) in the hippocampus (A–B). Representative photographs illustrate TrkA immunoreactivity in (A)sham treated control animals, and at 24 hr (B) after chronic ECS treatment. Histograms show the mean values (for each groups of animals; n=6) of the number of TrkA immunopositive cell processes after chronic ECS (solid bars), as compared to control (sham ECS) group (open bars). Asterisks indicate significant difference (*P<0.05 ; **P<0.01; ***P<0.001; ANOVA with Fisher’s test) from control group. The black area in the schematic brain section illustrates the region from which the photographs and measurements were taken. Photographs were acquired at 10x (A – B) and 40x magnification (A’ – B’).
The CA2 subfield of the hippocampus was the only region examined where the increase in TrkA immunoreactivity reached significance at 7 hr after the last seizure in the animals treated with acute ECS, as compared to sham treated controls (38 ± 5 vs 22 ± 4, respectively; expressed as mean values of the number of TrkA immunopositive cells/processes ± SEM). This increase was no longer detectable at a 24 hr time point.
Increases in NGF, but not in TrkA, immunoreactivity after chronic ECS
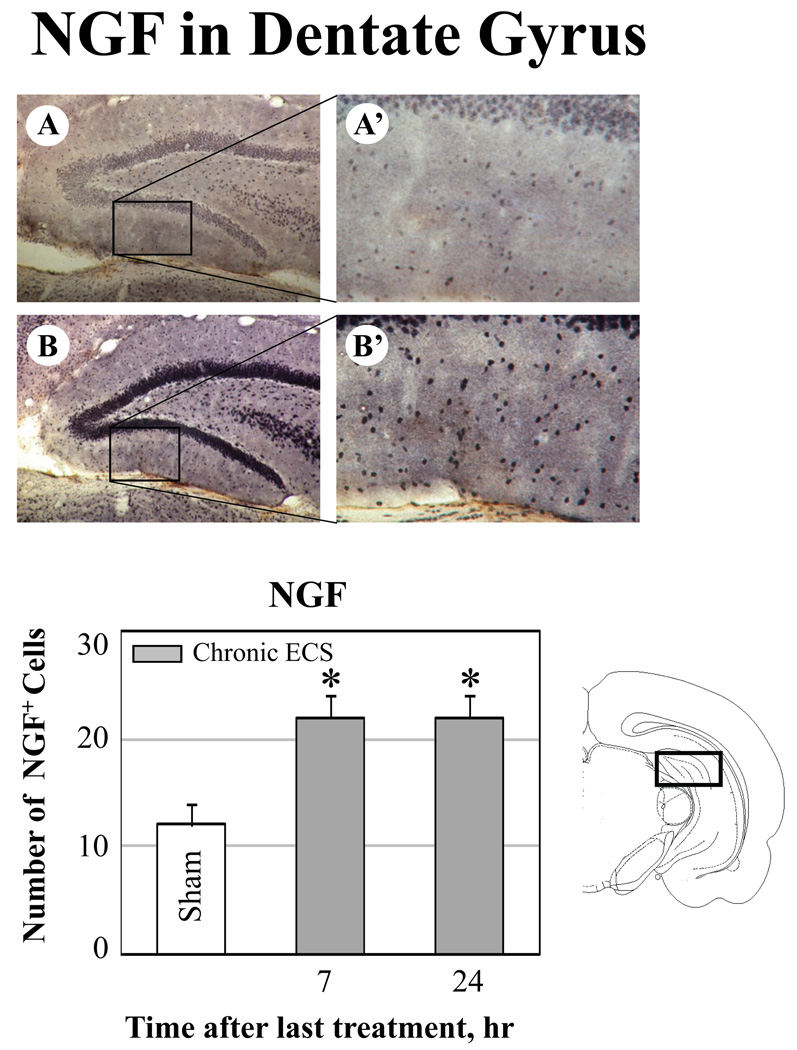
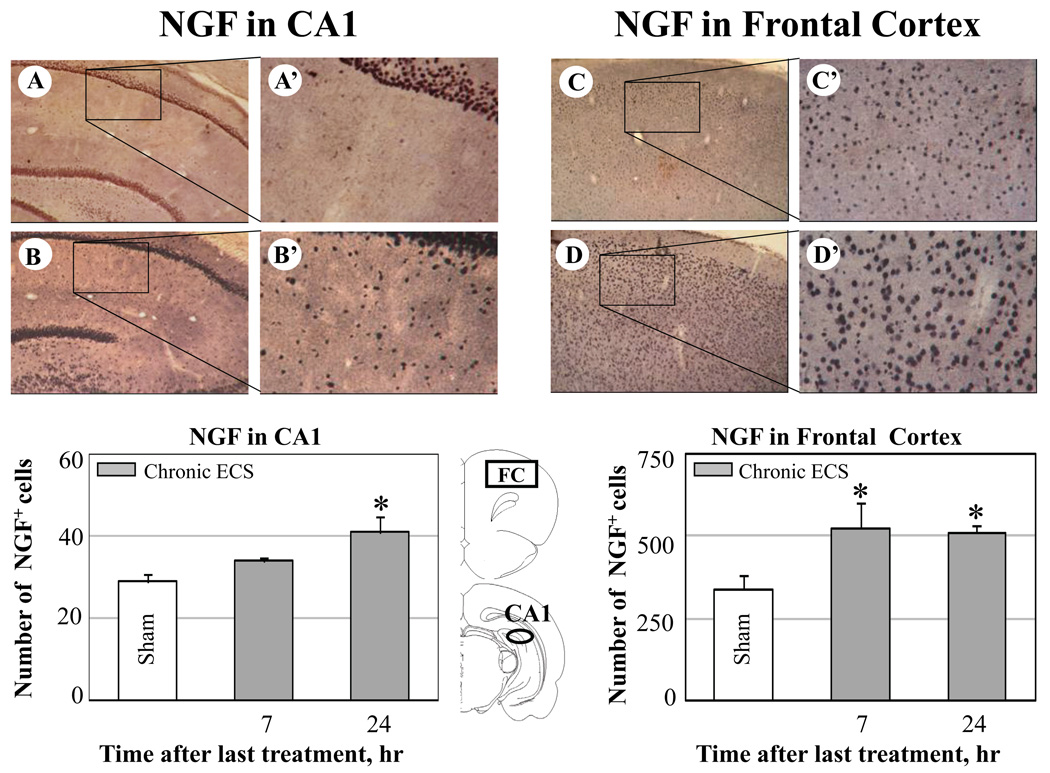
Significant increases in NGF immunoreactivity but not in TrkA staining were detected in the granular and molecular layers of the dentate gyrus (Fig. 6 B-B’) and in the CA1 region of the hippocampus (Fig. 7 B-B’) and in the frontal cortex (Fig. 7 D-D’) of animals treated with chronic ECS but not in those treated with acute ECS (not shown) or sham ECS (Fig. 6 A-A’ and Fig. 7 A-A’ and C-C’).
Fig. 6.
Effect of chronic ECS on NGF immunoreactivity in the dentate gyrus. A–B: Representative photographs of NGF immunoreactivity in (A) sham treated control animals, and (B) at 24 hr after chronic ECS treatment. Histograms show the mean values (for each groups of animals; n=6) of the number of NGF immunopositive cells after chronic ECS (solid bars), as compared to control (sham ECS) group (open bars). Asterisks indicate significant difference (*P<0.05 ; ***P<0.001; ANOVA with Fisher’s test) from control group. A black box in the schematic brain section illustrates the area from which the photographs and measurements were taken. Photographs were acquired at 10x (A – B) and 40x magnification (A’ – B’).
Fig. 7.
Effect of chronic ECS on NGF immunoreactivity in the CA1 subfield of hippocampus (A-A’, B-B’) and in the frontal cortex (FC) (C-C’, D-D’). Representative photographs illustrate NGF immunoreactivity in sham treated control animals (A-A’ and C-C’), and at 24 hr (B-B’ and D-D’) after chronic ECS treatment. Histograms show the mean values (for each groups of animals; n=6) of the number of NGF immunopositive cells after chronic (solid bars) ECS, as compared to control (sham ECS) group (open bars). Asterisks indicate significant difference (*P<0.05; ANOVA with Fisher’s test) from control group. The black areas in the schematic brain sections illustrate the regions from which the photographs and measurements were taken. Photographs were acquired at 10x (A – D) and 40x magnification (A’ – D’).
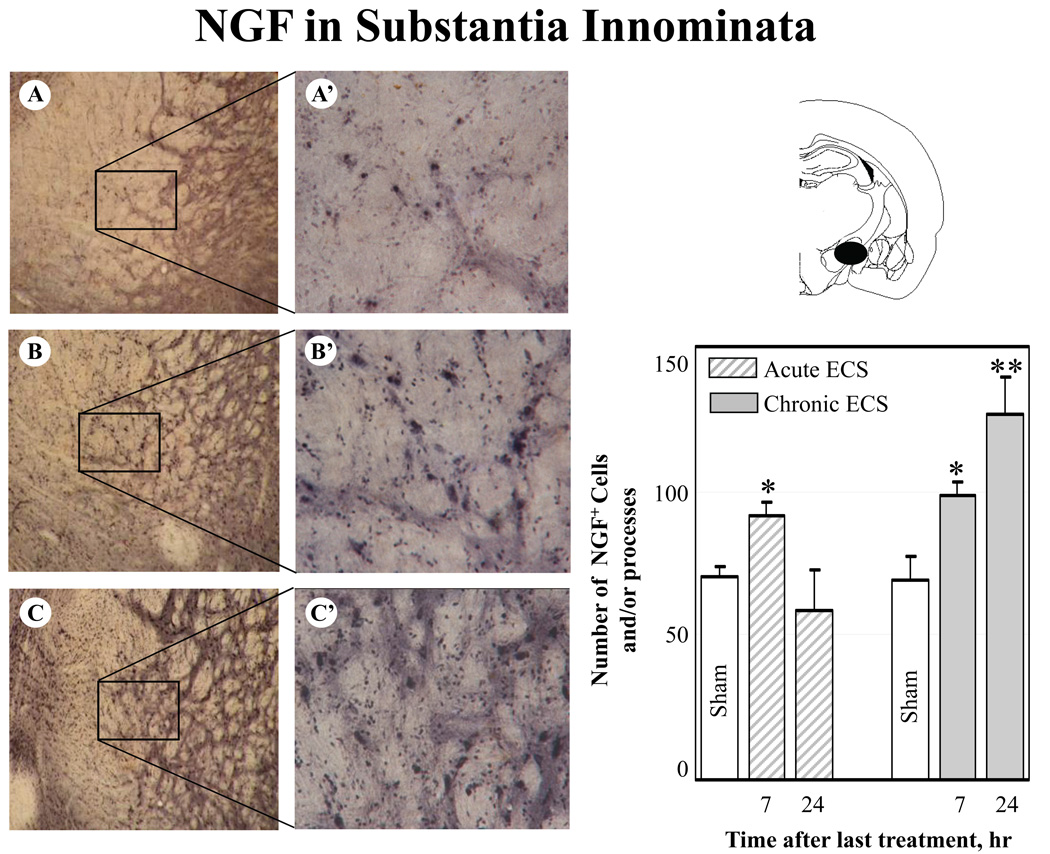
In the dentate gyrus and the frontal cortex, the increases in immunoreactivity for NGF protein were evident at 7 hr and 24 hr after the last seizure. In the CA1 region, an increase in NGF immunoreactivity reached significance by 24 hr after ECS treatment. Furthermore, a significant increase in NGF immunoreactivity was detected in the substantia innominata at 7 (Fig. 8 B-B’) and 24 hr after chronic ECS (Fig. 8 C-C’) as compared to sham-treated animals (Fig. 8 A-A’). Substantia innominata was the only region examined where the significant increase in NGF immunoreactivity was found at 7 hr after acute ECS (Fig. 8, histogram). This increase was no longer detectable at a 24 hr time point.
Fig. 8.
Effect of acute and chronic ECS on NGF immunoreactivity in the substantia innominata. Representative photographs illustrate NGF immunoreactivity in sham treated control animals (A), and at 7 hr (B) and 24 hr (C) after chronic ECS treatment. Histograms show the mean values (for each groups of animals; n=6) of the number of NGF immunopositive cells and/or processes after acute (striped bars) and chronic (solid bars) ECS, as compared to control (sham ECS) group (open bars). Asterisks indicate significant difference (*P<0.05 ; **P<0.01; ANOVA with Fisher’s test) from control group. A black area in the schematic brain section illustrates the region from which the photographs and measurements were taken. Photographs were acquired at 10x (A – C) and 40x magnification (A’ – C’).
4. Discussion
The results that we have obtained indicate that chronic exposure to repeated non-injurious seizures leads to a profound increase in both NGF and TrkA immunoreactivity in several specific brain regions. These changes were observed in the perirhinal cortex, thalamic nuclei (paraventricular and reuniens), and amygdala. In contrast, no significant increases were observed after exposure to acute ECS or in sham treated controls.
Our results also demonstrate that upreguation of immunoreactivity for NGF protein and TrkA receptors does not always co-occur, with some regions demonstrating an increase in NGF protein alone and others an increase in TrkA alone. In particular, in the hippocampus, upregulation of TrkA immunoreactivity after chronic ECS was found in the CA3, CA2 (the only region in which a significant increase of TrkA was also detected after acute ECS), and polymorph layer of the dentate gyrus (CA4), but not in the CA1. In contrast, an increase in NGF immunoreactivity was found in the granular and molecular layers of the dentate gyrus and in the CA1, but not in the CA2, CA3, and polymorph layer of dentate gyrus. In the substantia innominata (the only region in which a significant increase of NGF was also detected after acute ECS) and in the frontal cortex, an increase in NGF (but not in TrkA) immunoreactivity was found. These results suggest that either component (ligand or receptor) may respond independently to ECS treatment, and the pattern of this response is regionally selective. While the increases in TrkA in the absence of changes in NGF following ECS may be sufficient for the pre-existing NGF to exert its physiological actions, the significance of the reverse scenario (increases in NGF in the absence of pre-existing TrkA) in the areas that are not known to constitutively express TrkA remains unclear.
The induction of NGF immunoreactivity observed after chronic ECS in the dentate gyrus, parts of the amygdala, and in the perirhinal cortex as well as the absence of increased NGF expression following seizures in some of the hippocampal CA subfields is consistent with previously reported distribution of NGF mRNA in several experimental models of seizure activity (Gall et al., 1991; Lauterborn et al., 1994; Rocamora et al., 1992). The discrepancies in the regional distribution of NGF expression (e.g., in thalamic nuclei, and CA1) can be attributed to differences in the patterns of expression between mRNA and corresponding protein, increased utilization of protein under influence of seizures, and/or to the injurious nature of seizures in previous studies (Gall et al., 1991; Lauterborn et al., 1994; Rocamora et al., 1992) as opposed to the non-injurious seizures evoked by ECS (Kondratyev et al., 2001; Masco et al., 1999).
The exact cellular localization of the increased levels of NGF and TrkA proteins following exposure to ECS remains to be elucidated. Lauterborn et al (Lauterborn et al., 1994) reported that changes in NGF mRNA occurred exclusively in neurons after recurrent seizures induced by hilus lesion. At the same time, in the adult, CNS astrocytes are the main source of expression of the neurotrophic factors, including NGF (Arendt et al., 1995; Ballabriga et al., 1997; Ferrara et al., 1988; Friedman et al., 1998; Zafra et al., 1992). It is therefore possible that upregulation of NGF protein expression after exposure to ECS occurs in astrocytes. While NGF is known to be neuroprotective for neurons in the face of injury, thus requiring neuronal expression of TrkA, microglia and subpupulations of reactive astrocytes have been shown previously also to express TrkA following neural injury and in some neurological disorders involving inflammation (Elkabes et al., 1996; Heese et al., 1998; Oderfeld-Nowak et al., 2001; Oderfeld-Nowak et al., 2003a; Oderfeld-Nowak et al., 2003b; Soltys et al., 2003). Since ECS treatment does not result in any measurable injury and inflammatory response associated with injury (Devanand et al., 1994; Kondratyev et al., 2001; Masco et al., 1999), it is conceivable that elevated levels of TrkA reported here are activity-dependent as opposed to injury-dependent, and that the microglial expression of TrkA is not a significant component of the observed response. At the same time, activation of astrocytes following exposure to ECS, as evidenced by GFAP immunoreactivity, has been previously documented (Kragh et al., 1993), and it is possible that some of the observed TrkA upregulation occurs in reactive astrocytes. The physiological role of such a glial response, however, remains unclear. It has been suggested previously that NGF and TrkA may play a role in the generation of astrocytes from their precursors as well as in their maturation (Oderfeld-Nowak et al., 2003a; Soltys et al., 2003) thus strengthening the general supportive role of astroglia in response to intense neuronal stimulation.
We have previously demonstrated that repeated exposure to electroshock seizures enhances levels of mRNA and protein of another neurotrophic factor, FGF-2 (Gwinn et al., 2002; Kondratyev et al., 2002). The fact that the same treatment increases components of the NGF system (NGF protein and its corresponding receptor) further supports the possibility that controlled administration of electroconvulsive shock may have therapeutic potential in the treatment of a variety of neurodegenerative disorders via enhanced trophic factor response (Angelucci et al., 2002; Angelucci et al., 2003; Gwinn et al., 2002; Masco et al., 1999). Accumulation of NGF and other neurotrophic factors with neuroprotective potential, as well as their corresponding receptors, may represent an adaptive response to repeated non-injurious stimulation which, in turn, can prepare the organism to withstand more severe, normally injurious insults. In particular, we have previously demonstrated that chronic ECS (but not acute) treatment resulted in a complete prevention of neurodegeneration induced by status epilepticus (Kondratyev et al., 2001). Interestingly, acute exposure to ECS which is known not to be neuroprotective did not result in an upregulation of FGF-2 (Gwinn et al., 2002), TrkA, and, in most brain regions, of NGF protein (as we demonstrate here; see Results). The neuroprotective potential of this enhanced trophic response to chronic ECS may underlie the therapeutic effect of electroconvulsive therapy for bipolar disorders. It has been recently demonstrated that some affective disorders may have a neurodegenerative component (Drevets 2001; Rajkowska et al., 2001).
While it is possible that the receptor systems for other neurotrophic factors (e.g., FGF-2 or BDNF (Gwinn et al., 2002; Liu et al., 1993; Newton et al., 2003; Nibuya et al., 1995) may contribute to the adaptive potential of the chronic ECS treatment in the areas where the regional selectivity in NGF and TrkA expression was observed, it is conceivable that the endogenous levels of NGF or TrkA are sufficient for activation of receptor signaling and the resulting neuroprotective function in the absence of changes in either ligand or receptor in these particular brain regions. Because neuroprotective potential of NGF against excitotoxic injury in vivo has been extensively documented (Dixon et al., 1997; Frim et al., 1993; Hefti et al., 1993; Montero and Hefti 1989; Perez-Navarro et al., 1994), it will be important to further examine the activation of TrkA receptors following chronic ECS exposure in future studies. Our preliminary results (see Supplementary Information, Fig. 2S) demonstrate that chronic ECS treatment results in a robust increase in the overall level of tyrosine phosphorylation in some of the same brain regions where both NGF and TrkA were found to be upregulated (i.e., perirhinal cortex), suggesting that NGF activation of TrkA may contribute to this effect.
The results presented here demonstrate that chronic exposure to non-injurious seizures evoked by ECS results in induction of immunoreactivity for NGF and its corresponding receptor, TrkA, in a tissue-specific manner. Our results also indicate that in most brain regions this induction does not occur after acute ECS. These findings are consistent with our hypothesis that the NGF receptor system contributes to the neuroprotective effects evoked by chronic ECS pre-exposure.
Supplementary Material
Fig. 1S. Western blotting confirmation of antibody specificity. Panel A: Representative Western blot with anti-TrkA antibodies (UBI, 1:500) of the rat brain homogenates obtained from the rhinal cortices of rats treated with chronic ECS. Panel B: Western blotting of the same samples shown in Panel A but probed with anti-phosphotyrosine antibodies (Clone 4G10, UBI, Inc., 0.5 µg/ml). Lanes 1 and 2: Control homogenates; Lanes 3 and 4: NGF (50 ng/ml) was added to each sample and incubated for 10 min at 37°C prior to processing for Western analysis. Panel C: Representative Western blot of the mouse 2.5S NGF (Lane 1, control) and NGF from the rat brain homogenate (Lane 2) using antibodies against NGF (AB927; 1:500; Chemicon International, Temecula, CA).
Fig 2S. Effect of chronic ECS on NGF and TrkA and phosphotyrosine immunoreactivity in the perirhinal cortex. A: Representative photograph from sham treated control animal; B: Representative photograph 24 hr after chronic ECS treatment. The sections were double stained with the anti-TrkA antibodies (as described in Methods) and anti-phosphotyrosine antibodies (Clone 4G10, UBI, Inc., 0.5 mg/ml). Immunoreactivity corresponding to TrkA and anti-phosphotyrosine is seen in black and brown colors, respectively. Photographs were acquired at 40x magnification. Chronic ECS treatment resulted in the overall increase in anti-phosphotyrosine immunoreactivity as evidenced by the higher intensity of brown staining.
Acknowledgements
This work was supported by NIH grants MH 02040, NS 36035, and by the Epilepsy Foundation.
Abbreviations
- ECS
minimal electroconvulsive shock
- NGF
nerve growth factor
- FGF-2
fibroblast growth factor-2
- BDNF
brain derived neurotrophic factor
- mRNA
messenger RNA
- PBS
phosphate buffered saline
- GFAP
glial fibrillary acidic protein
Footnotes
Publisher's Disclaimer: This is a PDF file of an unedited manuscript that has been accepted for publication. As a service to our customers we are providing this early version of the manuscript. The manuscript will undergo copyediting, typesetting, and review of the resulting proof before it is published in its final citable form. Please note that during the production process errors may be discovered which could affect the content, and all legal disclaimers that apply to the journal pertain.
References
- Angelucci F, Aloe L, Jimenez-Vasquez P, Mathe AA. Electroconvulsive stimuli alter the regional concentrations of nerve growth factor, brain-derived neurotrophic factor, and glial cell line-derived neurotrophic factor in adult rat brain. J. ECT. 2002;18:138–143. doi: 10.1097/00124509-200209000-00005. [DOI] [PubMed] [Google Scholar]
- Angelucci F, Aloe L, Jimenez-Vasquez P, Mathe AA. Electroconvulsive stimuli alter nerve growth factor but not brain-derived neurotrophic factor concentrations in brains of a rat model of depression. Neuropeptides. 2003;37:51–56. doi: 10.1016/s0143-4179(03)00004-0. [DOI] [PubMed] [Google Scholar]
- Arendt T, Bruckner MK, Krell T, Pagliusi S, Kruska L, Heumann R. Degeneration of rat cholinergic basal forebrain neurons and reactive changes in nerve growth factor expression after chronic neurotoxic injury--II. Reactive expression of the nerve growth factor gene in astrocytes. Neuroscience. 1995;65:647–659. doi: 10.1016/0306-4522(94)00523-8. [DOI] [PubMed] [Google Scholar]
- Ballabriga J, Pozas E, Planas AM, Ferrer I. bFGF and FGFR-3 immunoreactivity in the rat brain following systemic kainic acid administration at convulsant doses: localization of bFGF and FGFR-3 in reactive astrocytes, and FGFR-3 in reactive microglia. Brain Res. 1997;752:315–318. doi: 10.1016/s0006-8993(96)01308-x. [DOI] [PubMed] [Google Scholar]
- Bengzon J, Kokaia Z, Ernfors P, Kokaia M, Leanza G, Nilsson OG, Persson H, Lindvall O. Regulation of neurotrophin and trkA, trkB and trkC tyrosine kinase receptor messenger RNA expression in kindling. Neuroscience. 1993;53:433–446. doi: 10.1016/0306-4522(93)90207-v. [DOI] [PubMed] [Google Scholar]
- Bengzon J, Soderstrom S, Kokaia Z, Kokaia M, Ernfors P, Persson H, Ebendal T, Lindvall O. Widespread increase of nerve growth factor protein in the rat forebrain after kindling-induced seizures. Brain Res. 1992;587:338–342. doi: 10.1016/0006-8993(92)91016-8. [DOI] [PubMed] [Google Scholar]
- Bonni A, Greenberg ME. Neurotrophin regulation of gene expression. Can. J. Neurol. Sci. 1997;24:272–283. doi: 10.1017/s0317167100032935. [DOI] [PubMed] [Google Scholar]
- Devanand DP, Dwork AJ, Hutchinson ER, Bolwig TG, Sackeim HA. Does ECT alter brain structure? Am. J. Psychiatry. 1994;151:957–970. doi: 10.1176/ajp.151.7.957. [DOI] [PubMed] [Google Scholar]
- Dixon CE, Flinn P, Bao J, Venya R, Hayes RL. Nerve growth factor attenuates cholinergic deficits following traumatic brain injury in rats. Exp. Neurol. 1997;146:479–490. doi: 10.1006/exnr.1997.6557. [DOI] [PubMed] [Google Scholar]
- Drevets WC. Neuroimaging and neuropathological studies of depression: implications for the cognitive-emotional features of mood disorders. Curr. Opin. Neurobiol. 2001;11:240–249. doi: 10.1016/s0959-4388(00)00203-8. [DOI] [PubMed] [Google Scholar]
- Dudek H, Datta SR, Franke TF, Birnbaum MJ, Yao R, Cooper GM, Segal RA, Kaplan DR, Greenberg ME. Regulation of neuronal survival by the serine-threonine protein kinase Akt [see comments] Science. 1997;275:661–665. doi: 10.1126/science.275.5300.661. [DOI] [PubMed] [Google Scholar]
- Elkabes S, DiCicco-Bloom EM, Black IB. Brain microglia/macrophages express neurotrophins that selectively regulate microglial proliferation and function. J. Neurosci. 1996;16:2508–2521. doi: 10.1523/JNEUROSCI.16-08-02508.1996. [DOI] [PMC free article] [PubMed] [Google Scholar]
- Elliott RC, Gall CM. Changes in activating protein 1 (AP-1) composition correspond with the biphasic profile of nerve growth factor mRNA expression in rat hippocampus after hilus lesion-induced seizures. J. Neurosci. 2000;20:2142–2149. doi: 10.1523/JNEUROSCI.20-06-02142.2000. [DOI] [PMC free article] [PubMed] [Google Scholar]
- Ferrara N, Ousley F, Gospodarowicz D. Bovine brain astrocytes express basic fibroblast growth factor, a neurotropic and angiogenic mitogen. Brain Res. 1988;462:223–232. doi: 10.1016/0006-8993(88)90550-1. [DOI] [PubMed] [Google Scholar]
- Follesa P, Gale K, Mocchetti I. Regional and temporal pattern of expression of nerve growth factor and basic fibroblast growth factor mRNA in rat brain following electroconvulsive shock. Exp. Neurol. 1994;127:37–44. doi: 10.1006/exnr.1994.1077. [DOI] [PubMed] [Google Scholar]
- Friedman WJ, Black IB, Kaplan DR. Distribution of the neurotrophins brain-derived neurotrophic factor, neurotrophin-3, and neurotrophin-4/5 in the postnatal rat brain: an immunocytochemical study. Neuroscience. 1998;84:101–114. doi: 10.1016/s0306-4522(97)00526-5. [DOI] [PubMed] [Google Scholar]
- Frim DM, Uhler TA, Short MP, Ezzedine ZD, Klagsbrun M, Breakefield XO, Isacson O. Effects of biologically delivered NGF, BDNF and bFGF on striatal excitotoxic lesions. Neuroreport. 1993;4:367–370. doi: 10.1097/00001756-199304000-00006. [DOI] [PubMed] [Google Scholar]
- Gall C, Murray K, Isackson PJ. Kainic acid-induced seizures stimulate increased expression of nerve growth factor mRNA in rat hippocampus. Brain Res. Mol. Brain Res. 1991;9:113–123. doi: 10.1016/0169-328x(91)90136-l. [DOI] [PubMed] [Google Scholar]
- Gall CM, Isackson PJ. Limbic seizures increase neuronal production of messenger RNA for nerve growth factor. Science. 1989;245:758–761. doi: 10.1126/science.2549634. [DOI] [PubMed] [Google Scholar]
- Gwinn R, Kondratyev A, Gale K. Time-dependent increase in basic fibroblast growth factor protein in limbic regions following electroshock seizures. Neuroscience. 2002;114:403. doi: 10.1016/s0306-4522(02)00265-8. [DOI] [PubMed] [Google Scholar]
- Heese K, Hock C, Otten U. Inflammatory signals induce neurotrophin expression in human microglial cells. J. Neurochem. 1998;70:699–707. doi: 10.1046/j.1471-4159.1998.70020699.x. [DOI] [PubMed] [Google Scholar]
- Hefti F, Knusel B, Lapchak PA. Protective effects of nerve growth factor and brain-derived neurotrophic factor on basal forebrain cholinergic neurons in adult rats with partial fimbrial transections. Prog. Brain Res. 1993;98:257–263. doi: 10.1016/s0079-6123(08)62407-3. [DOI] [PubMed] [Google Scholar]
- Holtzman DM, Kilbridge J, Li Y, Cunningham ET, Jr, Lenn NJ, Clary DO, Reichardt LF, Mobley WC. TrkA expression in the CNS: evidence for the existence of several novel NGF-responsive CNS neurons. J. Neurosci. 1995;15:1567–1576. doi: 10.1523/JNEUROSCI.15-02-01567.1995. [DOI] [PMC free article] [PubMed] [Google Scholar]
- Holtzman DM, Li Y, Parada LF, Kinsman S, Chen CK, Valletta JS, Zhou J, Long JB, Mobley WC. p140trk mRNA marks NGF-responsive forebrain neurons: evidence that trk gene expression is induced by NGF. Neuron. 1992;9:465–478. doi: 10.1016/0896-6273(92)90184-f. [DOI] [PubMed] [Google Scholar]
- Hughes PE, Alexi T, Walton M, Williams CE, Dragunow M, Clark RG, Gluckman PD. Activity and injury-dependent expression of inducible transcription factors, growth factors and apoptosis-related genes within the central nervous system. Prog. Neurobiol. 1999;57:421–450. doi: 10.1016/s0301-0082(98)00057-4. [DOI] [PubMed] [Google Scholar]
- Jankowsky JL, Patterson PH. The role of cytokines and growth factors in seizures and their sequelae. Prog. Neurobiol. 2001;63:125–149. doi: 10.1016/s0301-0082(00)00022-8. [DOI] [PubMed] [Google Scholar]
- Kondratyev A, Sahibzada N, Gale K. Electroconvulsive shock exposure prevents neuronal apoptosis after kainic acid-evoked status epilepticus. Brain Res. Mol. Brain Res. 2001;91:1–13. doi: 10.1016/s0169-328x(01)00099-7. [DOI] [PubMed] [Google Scholar]
- Kondratyev A, Ved R, Gale K. The effects of repeated minimal electroconvulsive shock exposure on levels of mRNA encoding fibroblast growth factor-2 and nerve growth factor in limbic regions. Neuroscience. 2002;114:411. doi: 10.1016/s0306-4522(02)00266-x. [DOI] [PubMed] [Google Scholar]
- Kragh J, Bolwig TG, Woldbye DP, Jorgensen OS. Electroconvulsive shock and lidocaine-induced seizures in the rat activate astrocytes as measured by glial fibrillary acidic protein. Biol. Psychiatry. 1993;33:794–800. doi: 10.1016/0006-3223(93)90020-e. [DOI] [PubMed] [Google Scholar]
- Lauterborn JC, Isackson PJ, Gall CM. Seizure-induced increases in NGF mRNA exhibit different time courses across forebrain regions and are biphasic in hippocampus. Exp. Neurol. 1994;125:22–40. doi: 10.1006/exnr.1994.1003. [DOI] [PubMed] [Google Scholar]
- Lee TH, Kato H, Chen ST, Kogure K, Itoyama Y. Expression of nerve growth factor and trkA after transient focal cerebral ischemia in rats. Stroke. 1998;29:1687–1696. doi: 10.1161/01.str.29.8.1687. [DOI] [PubMed] [Google Scholar]
- Levi-Montalcini R, Skaper SD, Dal Toso R, Petrelli L, Leon A. Nerve growth factor: from neurotrophin to neurokine. Trends Neurosci. 1996;19:514–520. doi: 10.1016/S0166-2236(96)10058-8. [DOI] [PubMed] [Google Scholar]
- Liu Z, D'Amore PA, Mikati M, Gatt A, Holmes GL. Neuroprotective effect of chronic infusion of basic fibroblast growth factor on seizure-associated hippocampal damage. Brain Res. 1993;626:335–338. doi: 10.1016/0006-8993(93)90598-h. [DOI] [PubMed] [Google Scholar]
- Maruta H, Burgess AW. Regulation of the Ras signalling network. Bioessays. 1994;16:489–496. doi: 10.1002/bies.950160708. [DOI] [PubMed] [Google Scholar]
- Masco D, Sahibzada N, Switzer R, Gale K. Electroshock seizures protect against apoptotic hippocampal cell death induced by adrenalectomy. Neuroscience. 1999;91:1315–1319. doi: 10.1016/s0306-4522(98)00636-8. [DOI] [PubMed] [Google Scholar]
- Mattson MP, Lovell MA, Furukawa K, Markesbery WR. Neurotrophic factors attenuate glutamate-induced accumulation of peroxides, elevation of intracellular Ca2+ concentration, and neurotoxicity and increase antioxidant enzyme activities in hippocampal neurons. J. Neurochem. 1995;65:1740–1751. doi: 10.1046/j.1471-4159.1995.65041740.x. [DOI] [PubMed] [Google Scholar]
- Merlio JP, Ernfors P, Jaber M, Persson H. Molecular cloning of rat trkC and distribution of cells expressing messenger RNAs for members of the trk family in the rat central nervous system. Neuroscience. 1992;51:513–532. doi: 10.1016/0306-4522(92)90292-a. [DOI] [PubMed] [Google Scholar]
- Montero CN, Hefti F. Intraventricular nerve growth factor administration prevents lesion- induced loss of septal cholinergic neurons in aging rats. Neurobiol. Aging. 1989;10:739–743. doi: 10.1016/0197-4580(89)90011-0. [DOI] [PubMed] [Google Scholar]
- Morimoto K, Sato K, Sato S, Yamada N, Hayabara T. Time-dependent changes in neurotrophic factor mRNA expression after kindling and long-term potentiation in rats. Brain Res. Bull. 1998;45:599–605. doi: 10.1016/s0361-9230(97)00459-0. [DOI] [PubMed] [Google Scholar]
- Newton SS, Collier EF, Hunsberger J, Adams D, Terwilliger R, Selvanayagam E, Duman RS. Gene profile of electroconvulsive seizures: induction of neurotrophic and angiogenic factors. J. Neurosci. 2003;23:10841–10851. doi: 10.1523/JNEUROSCI.23-34-10841.2003. [DOI] [PMC free article] [PubMed] [Google Scholar]
- Nibuya M, Morinobu S, Duman RS. Regulation of BDNF and trkB mRNA in rat brain by chronic electroconvulsive seizure and antidepressant drug treatments. J. Neurosci. 1995;15:7539–7547. doi: 10.1523/JNEUROSCI.15-11-07539.1995. [DOI] [PMC free article] [PubMed] [Google Scholar]
- Oderfeld-Nowak B, Orzylowska-Sliwinska O, Soltys Z, Zaremba M, Januszewski S, Janeczko K, Mossakowski M. Concomitant up-regulation of astroglial high and low affinity nerve growth factor receptors in the CA1 hippocampal area following global transient cerebral ischemia in rat. Neuroscience. 2003a;120:31–40. doi: 10.1016/s0306-4522(03)00289-6. [DOI] [PubMed] [Google Scholar]
- Oderfeld-Nowak B, Zaremba M, Lipkowski AW, Kwiatkowska-Patzer B, Triaca V, Aloe L. High-affinity NGF receptor in the rat spinal cord during acute and chronic phases of experimental autoimmune encephalomyelitis: a possible functional significance. Arch. Ital. Biol. 2003b;141:103–116. [PubMed] [Google Scholar]
- Oderfeld-Nowak B, Zaremba M, Micera A, Aloe L. The upregulation of nerve growth factor receptors in reactive astrocytes of rat spinal cord during experimental autoimmune encephalomyelitis. Neurosci. Lett. 2001;308:165–168. doi: 10.1016/s0304-3940(01)02001-8. [DOI] [PubMed] [Google Scholar]
- Orzi F, Zoli M, Passarelli F, Ferraguti F, Fieschi C, Agnati LF. Repeated electroconvulsive shock increases glial fibrillary acidic protein, ornithine decarboxylase, somatostatin and cholecystokinin immunoreactivities in the hippocampal formation of the rat. Brain Res. 1990;533:223–231. doi: 10.1016/0006-8993(90)91343-f. [DOI] [PubMed] [Google Scholar]
- Perez-Navarro E, Alberch J, Arenas E, Calvo N, Marsal J. Nerve growth factor and basic fibroblast growth factor protect cholinergic neurons against quinolinic acid excitotoxicity in rat neostriatum. Eur. J. Neurosci. 1994;6:706–711. doi: 10.1111/j.1460-9568.1994.tb00982.x. [DOI] [PubMed] [Google Scholar]
- Piredda S, Gale K. A crucial epileptogenic site in the deep prepiriform cortex. Nature. 1985;317:623–625. doi: 10.1038/317623a0. [DOI] [PubMed] [Google Scholar]
- Piredda S, Gale K. Role of excitatory amino acid transmission in the genesis of seizures elicited from the deep prepiriform cortex. Brain Res. 1986;377:205–210. doi: 10.1016/0006-8993(86)90859-0. [DOI] [PubMed] [Google Scholar]
- Poulsen FR, Lauterborn J, Zimmer J, Gall CM. Differential expression of brain-derived neurotrophic factor transcripts after pilocarpine-induced seizure-like activity is related to mode of Ca2+ entry. Neuroscience. 2004;126:665–676. doi: 10.1016/j.neuroscience.2004.04.008. [DOI] [PubMed] [Google Scholar]
- Rajkowska G, Halaris A, Selemon LD. Reductions in neuronal and glial density characterize the dorsolateral prefrontal cortex in bipolar disorder. Biol. Psychiatry. 2001;49:741–752. doi: 10.1016/s0006-3223(01)01080-0. [DOI] [PubMed] [Google Scholar]
- Rocamora N, Palacios JM, Mengod G. Limbic seizures induce a differential regulation of the expression of nerve growth factor, brain-derived neurotrophic factor and neurotrophin- 3, in the rat hippocampus. Brain Res. Mol. Brain Res. 1992;13:27–33. doi: 10.1016/0169-328x(92)90041-9. [DOI] [PubMed] [Google Scholar]
- Sato K, Kashihara K, Morimoto K, Hayabara T. Regional increases in brain-derived neurotrophic factor and nerve growth factor mRNAs during amygdaloid kindling, but not in acidic and basist growth factor mRNAs. Epilepsia. 1996;37:6–14. doi: 10.1111/j.1528-1157.1996.tb00504.x. [DOI] [PubMed] [Google Scholar]
- Schlessinger J. SH2/SH3 signaling proteins. Curr. Opin. Genet. Dev. 1994;4:25–30. doi: 10.1016/0959-437x(94)90087-6. [DOI] [PubMed] [Google Scholar]
- Schlessinger J, Ullrich A. Growth factor signaling by receptor tyrosine kinases. Neuron. 1992;9:383–391. doi: 10.1016/0896-6273(92)90177-f. [DOI] [PubMed] [Google Scholar]
- Sofroniew MV, Howe CL, Mobley WC. Nerve growth factor signaling, neuroprotection, and neural repair. Annu. Rev. Neurosci. 2001;24:1217–1281. doi: 10.1146/annurev.neuro.24.1.1217. [DOI] [PubMed] [Google Scholar]
- Soltys Z, Janeczko K, Orzylowska-Sliwinska O, Zaremba M, Januszewski S, Oderfeld-Nowak B. Morphological transformations of cells immunopositive for GFAP, TrkA or p75 in the CA1 hippocampal area following transient global ischemia in the rat. A quantitative study. Brain Res. 2003;987:186–193. doi: 10.1016/s0006-8993(03)03327-4. [DOI] [PubMed] [Google Scholar]
- Steininger TL, Wainer BH, Klein R, Barbacid M, Palfrey HC. High-affinity nerve growth factor receptor (Trk) immunoreactivity is localized in cholinergic neurons of the basal forebrain and striatum in the adult rat brain. Brain Res. 1993;612:330–335. doi: 10.1016/0006-8993(93)91681-h. [DOI] [PubMed] [Google Scholar]
- Vazquez ME, Ebendal T. Messenger RNAs for trk and the low-affinity NGF receptor in rat basal forebrain. Neuroreport. 1991;2:593–596. doi: 10.1097/00001756-199110000-00010. [DOI] [PubMed] [Google Scholar]
- Venero JL, Hefti F. TrkA NGF receptor expression by non-cholinergic thalamic neurons. Neuroreport. 1993;4:959–962. doi: 10.1097/00001756-199307000-00031. [DOI] [PubMed] [Google Scholar]
- Woolf NJ, Milov AM, Schweitzer ES, Roghani A. Elevation of nerve growth factor and antisense knockdown of TrkA receptor during contextual memory consolidation. J. Neurosci. 2001;21:1047–1055. doi: 10.1523/JNEUROSCI.21-03-01047.2001. [DOI] [PMC free article] [PubMed] [Google Scholar]
- Zafra F, Lindholm D, Castren E, Hartikka J, Thoenen H. Regulation of brain-derived neurotrophic factor and nerve growth factor mRNA in primary cultures of hippocampal neurons and astrocytes. J. Neurosci. 1992;12:4793–4799. doi: 10.1523/JNEUROSCI.12-12-04793.1992. [DOI] [PMC free article] [PubMed] [Google Scholar]
Associated Data
This section collects any data citations, data availability statements, or supplementary materials included in this article.
Supplementary Materials
Fig. 1S. Western blotting confirmation of antibody specificity. Panel A: Representative Western blot with anti-TrkA antibodies (UBI, 1:500) of the rat brain homogenates obtained from the rhinal cortices of rats treated with chronic ECS. Panel B: Western blotting of the same samples shown in Panel A but probed with anti-phosphotyrosine antibodies (Clone 4G10, UBI, Inc., 0.5 µg/ml). Lanes 1 and 2: Control homogenates; Lanes 3 and 4: NGF (50 ng/ml) was added to each sample and incubated for 10 min at 37°C prior to processing for Western analysis. Panel C: Representative Western blot of the mouse 2.5S NGF (Lane 1, control) and NGF from the rat brain homogenate (Lane 2) using antibodies against NGF (AB927; 1:500; Chemicon International, Temecula, CA).
Fig 2S. Effect of chronic ECS on NGF and TrkA and phosphotyrosine immunoreactivity in the perirhinal cortex. A: Representative photograph from sham treated control animal; B: Representative photograph 24 hr after chronic ECS treatment. The sections were double stained with the anti-TrkA antibodies (as described in Methods) and anti-phosphotyrosine antibodies (Clone 4G10, UBI, Inc., 0.5 mg/ml). Immunoreactivity corresponding to TrkA and anti-phosphotyrosine is seen in black and brown colors, respectively. Photographs were acquired at 40x magnification. Chronic ECS treatment resulted in the overall increase in anti-phosphotyrosine immunoreactivity as evidenced by the higher intensity of brown staining.


