Abstract
Object recognition is a fundamental function of the auditory system, but the underlying mechanisms are not well understood. Acoustic communication in the Tettigoniid genus Neoconocephalus provides a useful system for studying these mechanisms. We examined the ascending interneuron pathway in three Neoconocephalus species with diverse calls and recognition mechanisms. This pathway processes spectral information and transmits call temporal patterns to the supraesophageal ganglion where the recognition circuits reside. For each species, we describe one local auditory interneuron (ON) and three with ascending projections (AN-1, AN-2, TN-1), which were physiologically and morphologically similar to those described in other Tettigoniids. TN-1 responded only to the beginning of call models. For AN-1, each call model pulse elicited a single action potential in N. robustus and N. bivocatus, whereas every other pulse elicited an action potential in N. triops. Individual pulses did not reliably evoke AN-2 responses in all three species. AN-1 responses were limited to frequencies <20 kHz. AN-1 tuning differed among the three species, reflecting their differences in the dominant frequency of the calls. AN-2 was broadly tuned, and responses increased with intensity in all three species. In behavioral experiments, N. robustus showed greater spectral selectivity than the other two species. Adding the second harmonic to the spectrum of call models suppressed phonotaxis in N. robustus, but not N. triops or N. bivocatus. Adding the second harmonic reduced AN-1 responses in N. robustus but not in the other two species. We discuss the potential function of the ascending neurons for call recognition.
INTRODUCTION
Object recognition is a fundamental function of the auditory system important for generating appropriate responses to the environment. Recognition relies on the spectral and temporal parameters of the perceived signal. The receptor organ and the sensory pathway encode these parameters as the first step in this process.
In vertebrate hearing systems, dedicated neural networks must recognize a multitude of objects within the environment, and these objects can vary greatly in the acoustic features that characterize them (Feng and Ratnam 2000; Gentner 2004; Kaas et al. 1999; Kanwal and Rauschecker 2007). In contrast, in the acoustic communication system of Tettigoniids, females typically recognize and perform positive phonotaxis to only one category of signals, the calls of conspecific males (Gerhardt and Huber 2002). Thus only one (or a few) neural recognition network seems to be present in each species. In the katydid genus Neoconocephalus, the acoustic features of the conspecific calls and the neural mechanisms underlying recognition differ significantly among species (Beckers and Schul 2008; Bush et al. 2009; Deily and Schul 2004, 2006, 2009). Comparative studies may provide valuable insights in the neural processes involved in acoustic object recognition. In addition, Neoconocephalus possess a simple auditory system, and their behavioral selectivity has been well studied, making this a promising model system for studying the neural correlates of auditory object recognition.
Neoconocephalus possess ∼35 auditory receptor neurons (Höbel and Schul 2007) within each hearing organ (located in the forelegs; Lakes and Schikorsky 1990), which project into the prothoracic ganglion. In other Tettigoniids, these receptor neurons converge onto a small number of thoracic auditory interneurons (≥3–6 on each side of the animal, variable among species; Hardt 1988; Römer et al. 1988; Schul 1997; Stumpner and Molina 2006) that transmit acoustic information to the insect's “brain,” the supraesophageal ganglion (SOG), where conspecific call recognition likely takes place (Stumpner and Helversen 2001). Across a wide range of katydid and cricket species, the ascending auditory pathway contains many similar, and potentially homologous, neurons. However, differences in response properties that reflect behavioral selectivity differences occur among species (Schul 1997; Stumpner 1997, 2002; Stumpner and Molina 2006).
In this study, we identified and characterized auditory neurons with ascending axons in three closely related species (genus Neoconocephalus) with diverse calls and call recognition mechanisms. The calls of N. robustus have a single pulse rate of 200 Hz (at 25°C) that females recognize by the absence of silent intervals >3 ms (Deily and Schul 2004). The pulses in calls of N. bivocatus and N. triops are grouped into pulse pairs or double pulses (double pulse rates of 90 and 110 Hz, respectively). Behavioral experiments have shown that females of these species recognize conspecifics based on the double pulse rate (Beckers and Schul 2008; Deily and Schul 2004). Conspecific calls with the correct double pulse rate are attractive, whereas call attractiveness decreases toward higher and lower rates.
Spectral selectivity also differs among the three species. In N. robustus, behavioral responses are limited to call models containing dominant frequencies <10 kHz, whereas the two other species respond to call models with dominant frequencies ≤20 kHz (Deily and Schul 2006; J. Schul, unpublished observations). In addition, adding frequencies >10 kHz has a strong inhibitory effect in N. robustus, but little if any in N. bivocatus (Deily and Schul 2006). Since previous studies (Schul 1997; Stumpner 1997, 2002; Stumpner and Molina 2006) suggested that spectral selectivity is generated at the level of the ascending auditory interneurons, we focused on spectral processing within these interneurons.
METHODS
Animals
Neoconocephalus robustus and N. bivocatus were collected as adults or last-instar nymphs from grasslands surrounding Columbia, MO. N. triops were collected in Puerto Rico as nymphs or adults. Phonotaxis experiments were conducted with N. triops collected as adults, whereas physiology experiments tested laboratory-reared F1 generation animals raised under summer conditions (Beckers and Schul 2008). Insects were kept for at least 1–2 wk after collection or their final molt before being used in experiments. Only females were tested in the behavioral experiments, whereas both males and females were used in the physiology experiments. We could not detect differences between males and females.
Electrophysiology
Animals were anesthetized using CO2 and mounted ventral side up on a freestanding metal holder with a wax/resin mixture or yellow sticky wax (Kerr's). The prothoracic legs (containing the tympanal organs) were fixed on a wire holder perpendicular to the body axis, whereas the meso- and metathoracic legs were fixed along the body wall. The prothoracic ganglion was exposed by removing a small piece of cuticle and covered with saline (modified after Fielden 1960). A wax well was built around the opening to hold the saline. The ganglion was stabilized using an NiCr spoon, which also served as the indifferent electrode.
Experiments were conducted in an anechoic Faraday cage (1.2 × 1.2 × 0.7 m) at 24–26°C. Intracellular or quasi-intracellular recordings were made using thick-walled borosilicate glass microelectrodes (WPI) filled with 3–5% Lucifer yellow (Sigma) dissolved in 0.5 M LiCl, whereas the rest of the electrode shaft was filled with 1 M LiCl (resistance 80–120 MΩ). The recordings of the auditory interneurons were made from the dendrites within the prothoracic ganglion. The recorded signals were amplified (IE-210, Warner Instruments), low-pass filtered at 4 kHz (3384, Krohn-Hite), digitized (InstruNet 100B, Omega Engineering), and stored using SuperScope II (GW Instruments).
We obtained recordings from the three ascending auditory neurons (AN-1, AN-2, and TN-1) and from the local omega neuron (ON). Penetration of the cells typically increased the spontaneous activity. We compensated for this artifact by slightly hyperpolarizing (<1 nA) the neurons to reduce the spontaneous activity to approximately the prepenetration level. Hyperpolarization drives Lucifer yellow and Cl− into the neuron, which has the potential to affect its response properties over time. We are confident that this did not significantly influence our results for the several reasons. First, data collection began immediately after hyperpolarization began and lasted <3 min. This short duration, together with the low current level (<1 nA), minimized the potential effects of the hyperpolarization. Furthermore, the collected data were very consistent, both within one recording (i.e., no consistent change between the beginning and end of each series) and within each species. Finally, we followed the same recording and stimulation protocol for each species, so that the interspecific differences reported here cannot be attributed to recording artifacts.
After data collection, the hyperpolarizing current was increased to 2–5 nA to fill the neuron with Lucifer yellow for morphological identification. The prothoracic ganglion was fixed in 4% paraformaldehyde, dehydrated, and cleared in methyl salicylate. Stained cells were digitally photographed in stacks using a fluorescent microscope (Olympus IX70 inverted microscope with Orca digital camera) and drawn as whole mounts from the digital images. The physiological data came only from auditory neurons identified morphologically.
Stimulation
We generated synthetic signals using a custom developed DA-converter amplifier system (16-bit resolution, 250-kHz sampling rate) and attenuated using a computer-controlled attenuator. Stimuli were delivered via a loudspeaker (10TH400C, Technic) mounted 50 cm from the preparation, perpendicular to the insect's body axis and ipsilateral to the side eliciting the stronger response from the neuron (soma-contralateral side for AN-1, AN-2, and TN-1 and soma-ipsilateral side for ON). Signal amplitudes were calibrated at the position of the insect using a 0.25-in condenser microphone (G.R.A.S. 40BF, VedBaek, Denmark) and a Ban dK 2231 sound level meter (Brüel and Kjaer, Naerum, Denmark). All sound pressure levels are given as dB peak sound pressure level (SPL; re 20 μPa).
Neural responses to calls were tested in N. robustus and N. bivocatus using the temporal parameters of call models based on those used in Deily and Schul (2004, 2006). The N. robustus call consisted of a continuous train of single pulses of 3.0-ms duration, separated by silent intervals of 2.0-ms duration (i.e., a single pulse pattern). The temporal pattern for N. bivocatus consisted of a continuous train of paired pulses: the duration of these pulses was 2.2 and 3.0 ms, with an interval of 2.3 ms between. These paired pulses were repeated after an interval of 4.0 ms. The temporal pattern for N. triops also consisted of a continuous train of paired pulses based on the summer call pattern: the duration of these pulses was 1.8 and 2.7 ms, with an interval of 2 ms between. These paired pulses were repeated after an interval of 2.9 ms. All pulses had a 0.5-ms rise/fall time (same as behavioral experiments; Beckers and Schul 2008; Deily and Schul 2004). The frequency content of the calls consisted of each species' call carrier frequency (7 kHz for N. robustus, 10 kHz for N. bivocatus, and 11 kHz for N. triops). Calls were presented at 60 dB SPL, an amplitude that is 10–20 dB above behavioral threshold (Deily and Schul 2006). These call models were highly attractive for females during phonotaxis experiments (Beckers and Schul 2008; Deily and Schul 2004).
Intensity–response functions were generated for sinusoidal stimuli (22-ms duration, including 1-ms rise/fall time) at 5, 7, 10, 14, 20, 28, 40, and 60 kHz presented at a rate of 2/s. Each frequency was presented in increasing amplitudes from 20 to 80 dB SPL using 12-dB steps; frequencies were presented in ascending order. The sequence of frequency/amplitude combinations was presented three times (3-s interval between sequence presentations), and the responses were averaged. If the recording was lost before completing all three stimulus presentations, the data collected before that event were averaged.
To measure the strength of high-frequency inhibition on AN-1 and AN-2, we used sinusoidal stimuli (22-ms duration, including 1-ms rise/fall time, presented at 2/s) that contained both call dominant frequency and the second harmonic (7 and 14 kHz for N. robustus; 10 and 20 kHz for N. bivocatus; 11 and 22 kHz for N. triops). Stimulus presentations began with the low frequency alone, followed by the two-tone stimuli with the second harmonic at amplitudes of 0, +6, +12, and +18 dB relative to the dominant frequency. The sequence ended with repeating the dominant frequency component alone. The sequence was presented three times, and we measured the number of action potentials (APs) each stimulus elicited. Responses were normalized to the response elicited by the first low frequency stimulus. We included only stimuli sequences in the analysis if the response elicited by the last low-frequency stimulus in the series did not differ from the first by more than one AP.
Phonotaxis experiments
We tested behavioral responses of females to two-tone stimuli using the procedures described in Deily and Schul (2006). Briefly, behavioral tests were conducted on a walking compensator (Kramer treadmill) (Weber et al. 1981). Call models (same parameters as for physiology experiments) were generated and presented using the same system described for the physiology experiments. We calculated the relative response strength during a test situation by multiplying the relative walking speed (speed during test/speed during control) with the relative vector length (Schul 1998) of the response. Relative response strength was normalized to the response strength during stimulation with the dominant frequency only. N. robustus and N. bivocatus were collected by Deily and Schul (2006) and reanalyzed for this study. Each animal was tested once using each stimulus.
All statistical tests were conducted using Minitab (Release 14.12.0).
RESULTS
Morphology of auditory interneurons with ascending axons
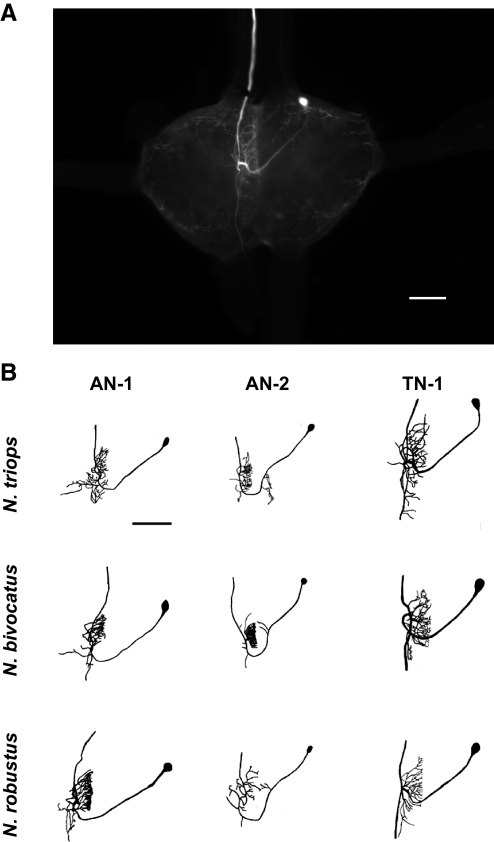
We identified three auditory neurons in the prothoracic ganglion with ascending projections in all three Neoconocephalus species (Fig. 1). We refer to these three neurons as AN-1, AN-2, and TN-1 based on their morphological and physiological similarities to auditory neurons found in other Tettigoniid species (see discussion). These three neurons shared several morphological features: 1) a soma in the anterior portion of the prothoracic ganglion; 2) an axon ascending in the connective contralateral to the soma; 3) the majority of the dendritic field located in the hemiganglion contralateral to the soma; and 4) the greater portion of this dendritic field was found anterior of the crossing projection, with a smaller dendritic field typically found posterior of the crossing projection as well.
FIG. 1.
A: photo of TN-1 filled with Lucifer yellow in Neoconocephalus triops to show the location of the auditory interneurons within the prothoracic ganglion. The cell bodies of all 3 auditory neurons with ascending axons are found within the same region as the TN-1 cell body in the photo for all 3 species. The dendritic field for the TN-1 shown also represents the area where auditory receptor cells terminate and form the auditory neuropile. The axon ascends to the supraesophageal ganglion (SOG) in the soma–contralateral connective. B: morphology of the 3 primary auditory interneurons that have ascending axons (AN-1, AN-2, and TN-1) for the 3 Neoconocephalus species tested. Auditory neurons were drawn from digital stacked images to show the similarity in morphology of the 3 interneurons across the 3 species. The TN-1 neuron for N. triops is the same as in A. Scale bars: 150 μm.
AN-2 could be distinguished from AN-1 based on two morphological features. First, in addition to the main dendritic region in the soma-contralateral hemiganglion, AN-2 possessed a smaller, soma-ipsilateral dendritic field extending from the crossing projection just before crossing the midline that was absent in AN-1. Second, the crossing projection in AN-2 turned in the posterior direction before crossing the midline compared with AN-1's crossing projection. This gave AN-2's crossing projection a “U-shaped” appearance that differentiated it from AN-1. TN-1 was easily distinguishable from the other two auditory neurons because of its descending axon (also in the soma-contralateral connective) in addition to the ascending axon. TN-1 also did not possess any dendritic fields in the soma-ipsilateral hemiganglion. Both the similarities and differences among these three neurons were consistent across species.
Responses to the temporal pattern of conspecific call models
We recorded AN-1, AN-2, and TN-1 responses to conspecific calls in all three species to determine which neurons transmit call information to the SOG.
TN-1.
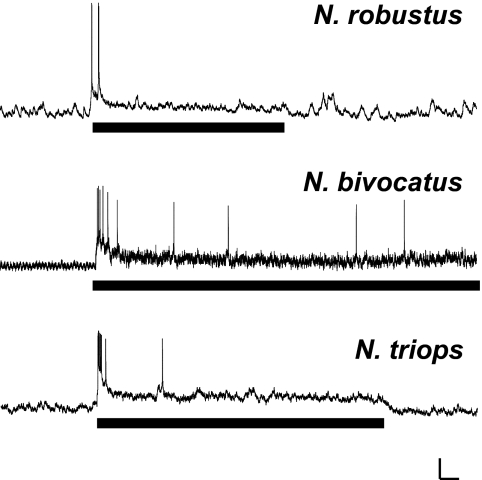
In each species, the call elicited an initial burst of action potentials (APs) in TN-1, followed by a prolonged depolarization that lasted for the duration of the call (Fig. 2). Because TN-1 only responded at the onset of the call, this neuron cannot contribute to the sustained phonotaxis of Neoconocephalus females in the three species tested. Therefore we did not consider TN-1 in any further temporal or spectral analysis.
FIG. 2.
TN-1 responses to conspecific calls presented at 60 dB SPL for the 3 Neoconocephalus species tested, which is 10–20 dB above behavioral threshold (Deily and Schul 2006). Scale bars: 100 ms, 10 mV.
AN-1.
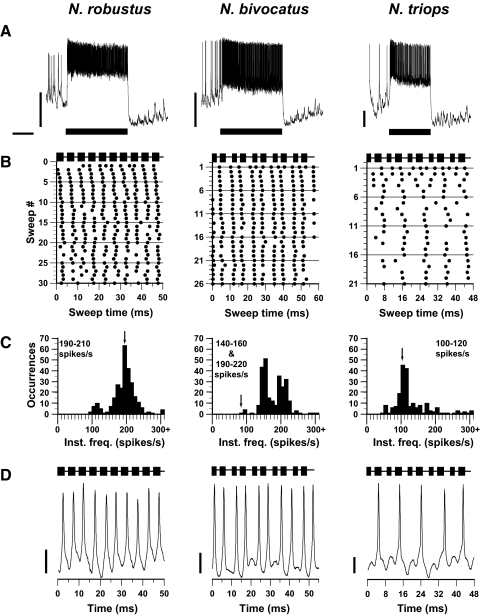
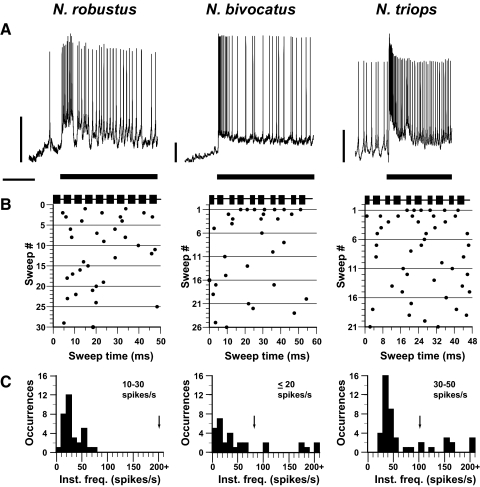
AN-1 responded strongly throughout the duration of the call in all three species (Fig. 3A). To analyze and compare the timing of AN-1 responses to the call across the three species, we divided the continuous call models into “sweeps” consisting of 10 pulses for analysis. In N. robustus, which produces a call with a single pulse rate, each pulse elicited a single action potential in AN-1 (Fig. 3, B and D, left). These responses were stimulus-locked to the pulse, evident by the AP alignment on the raster plot. The instantaneous frequency histogram (Fig. 3C, left) contains a single peak close to 200 spikes/s, indicating that AN-1 reliably transmitted the call temporal pattern in N. robustus (200 pulses/s; Fig. 3C, left, arrow).
FIG. 3.
AN-1 responses to conspecific calls presented at 60 dB SPL for the 3 Neoconocephalus species tested. A: neural responses to conspecific calls taken from intracellular or quasi-intracellular dendritic recordings. Note the different voltage scales each trace across species. Bar represents the call stimulus; scale bars: 500 ms; 10 mV. B: raster plots of responses to conspecific calls shown in A. Each call was divided into sweeps containing 10 pulses, with each sweep beginning at the onset of a pulse. The stimulus marker above each raster plot indicates the timing of the single pulse rates for N. robustus and the double pulse rates for N. bivocatus and N. triops. Sweep lengths were as follows: 50 ms for N. robustus, 57.5 ms for N. bivocatus, and 47.08 ms for N. triops. Number of sweeps varied because of call parameters and duration of the call stimulus tested. C: instantaneous frequency histograms for neural responses shown in B. N. robustus single pulse call rate = 200 pulses/s; N. triops double pulse rate = 106 pulses/s; N. bivocatus double pulse = 87 pulses/s (arrows). D: intracellular or quasi-intracellular neural responses for 1 sweep for each of the 3 Neoconocephalus species. Note the different voltage scales each trace across species. Scale bars: 5 mV.
The calls of N. bivocatus and N. triops consist of a double pulse pattern (i.e., contained 2 alternating pulse periods). For N. bivocatus, AN-1 responded to each pulse of the double pulse pattern with one AP (Fig. 3, B and D, middle). Accordingly, the instantaneous frequency histogram contained two peaks (Fig. 3C, middle) at 140–160 and 190–220 spikes/s, which corresponds to the two alternating pulse periods of the double pulse call. However, no peak occurred at the double pulse rate of the N. bivocatus call model (87 pulses/s; Fig. 3C, middle, arrow).
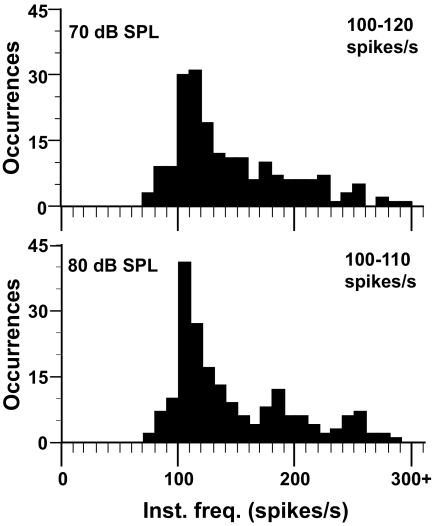
In N. triops, AN-1 only responded once per double pulse pair (Fig. 3B, right) and not to each pulse as in N. bivocatus and N. robustus. The instantaneous frequency histogram (Fig. 3C, right) contained a peak at 100–120 spikes/s, corresponding to the double pulse rate of the N. triops call model (106 pulses/s; Fig. 3C, right, arrow). Even when the call model was presented at 70 and 80 dB SPL (Fig. 4), AN-1 responded with one AP per double pulse, showing that the AN-1 response pattern in N. triops was not caused by the level of excitation.
FIG. 4.
N. triops AN-1 responses to conspecific call stimuli presented at 70 and 80 dB SPL. The instantaneous frequency of neural responses is still mostly between 100 and 120 spikes/s as AN-1 continues to produce a single action potential (AP) for each double pulse.
AN-2.
In all three species, AN-2 responded to their own species call throughout the duration of the stimulus, but call models elicited fewer APs than in AN-1 (cf. Figs. 3A and 5A). Furthermore, AN-2 responses did not convey the pulse pattern of the conspecific call model in any species (instantaneous frequencies ≤50 spikes/s; Fig. 5, B and C).
FIG. 5.
AN-2 responses to conspecific calls presented at 60 dB SPL for the 3 Neoconocephalus species tested. A: neural responses to conspecific calls taken from intracellular or quasi-intracellular dendritic recordings. Note the different voltage scales each trace across species. Response for N. bivocatus is truncated. Bar represents the call stimulus; scale = 500 ms; 10 mV. B: raster plots of responses to conspecific calls shown in A. Sweep lengths and number were the same as for AN-1 (Fig. 3B). C: instantaneous frequency histograms for neural responses shown in B. Arrows indicate each conspecific call rate (same as listed in Fig. 3C).
Spectral selectivity: intensity–response curves
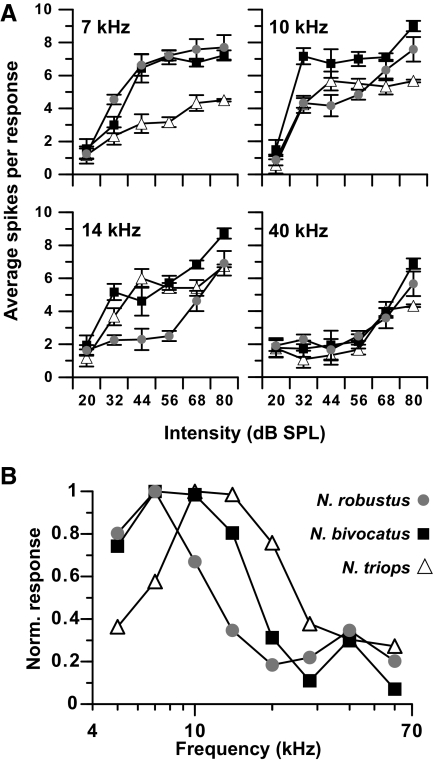
In all three species, AN-1 (Fig. 6A) was a low-frequency neuron tuned to frequencies <20 kHz. Frequencies of 20 kHz and higher (N. triops: 28 kHz and higher) did not elicit responses except at high (≥68 dB SPL) amplitudes (Fig. 6A). Intensity–response functions at low frequencies (7–14 kHz) rose sharply and leveled off 12–24 dB above threshold. AN-1 tuning differed across the three species (Fig. 6B). In N. robustus, AN-1 was tuned to 7 kHz, whereas AN-1 tuning was broader in N. bivocatus, with best responses occurring at 7 and 10 kHz. In N. triops, AN-1 tuning was shifted to higher frequencies (10–14 kHz), and responses to 7 kHz were weaker than in the other two species. These differences reflect the dominant spectral component in male calls of the three species (see discussion).
FIG. 6.
A: intensity–response curves for AN-1 for all 3 Neoconocephalus species. Each response is the average response from 1 to 3 stimulus presentations (±SE): N. robustus (n = 8), N. bivocatus (n = 4), N. triops (n = 4). B: AN-1 responses to 56 dB SPL stimuli for the frequencies tested to compare AN-1 tuning across species. For each species, responses were normalized to the strongest response evoked by 56 dB SPL at any frequency.
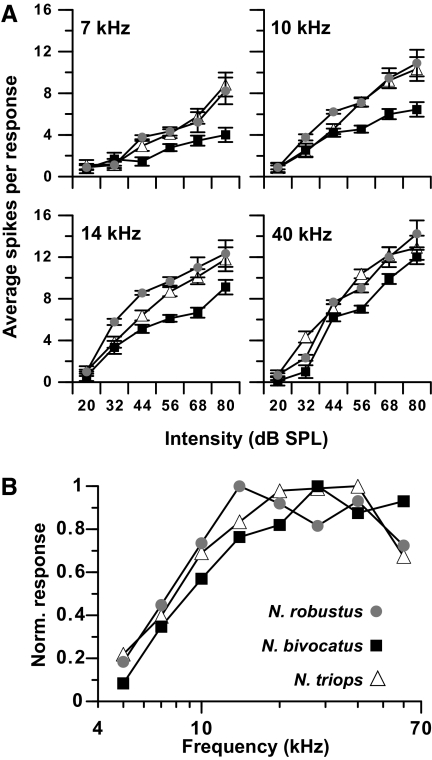
In all three species, AN-2 was broadly tuned and responded well over a wide range of frequencies, with strongest responses occurring between 14 and 40 kHz (Fig. 7). Within each frequency, responses increased in a linear fashion over a wide range of amplitudes in all three species. The relative sensitivity and tuning of AN-2 is similar across species (Fig. 7B).
FIG. 7.
A: intensity–response curves for AN-2 for all 3 Neoconocephlus species. Each response is the average response from 1 to 3 stimulus presentations (±SE): N. robustus (n = 3), N. bivocatus (n = 3), N. triops (n = 6). B: AN-2 responses to 56 dB SPL stimuli for the frequencies tested to compare AN-2 tuning across species. For each species, responses were normalized to the strongest response evoked by 56 dB SPL at any frequency.
Spectral selectivity: two-tone stimulation
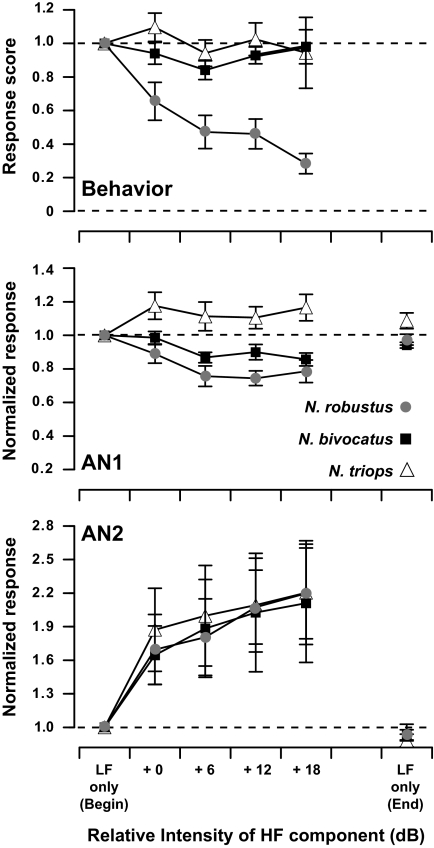
In phonotaxis experiments, adding the second harmonic to the call model led to a strong reduction of the relative response strength in N. robustus (Fig. 8, top). When the relative amplitude of the second harmonic was 6 dB above the dominant frequency amplitude, normalized behavioral responses were reduced to 0.47 ± 0.10 and 0.28 ± 0.06 when the relative amplitude of the second harmonic was 18 dB above the dominant frequency amplitude (mean ± SE; n = 8). Adding the second harmonic did not reduce the normalized behavioral response scores in N. triops or N. bivocatus (Fig. 8, top). A repeated-measures two-way ANOVA confirmed that the difference between N. robustus and the other two species was significant (F2,82 = 45.31, P < 0.001). Tukey post hoc tests confirmed that the addition of the second harmonic reduced N. robustus response scores when the relative amplitude was 6 dB or above the dominant frequency amplitude (all tests, P < 0.05).
FIG. 8.
Top: results from phonotaxis behavior experiments using two-tone call stimuli for all 3 Neoconocephalus species. Two-tone stimuli consisted of the dominant frequency of the conspecific call as the low-frequency component (LF) and the 2nd harmonic as the high-frequency (HF) component. Call models consisting of the LF component only were presented at behavioral threshold and the HF component in the two-tone stimuli was presented at equal or higher amplitudes relative to the LF amplitude. Dashed lines indicate the normalized control response score (1.0) and nondirected response score (0). Mean ± SE. N. robustus (n = 8), N. bivocatus (n = 8), N. triops (n = 8). Middle: AN-1 responses to 20-ms two-tone stimuli. Each sequence began and ended with the LF component alone, whereas the two-tone stimuli were presented in order of increasing relative HF amplitude in between. Data were eliminated if the responses to the beginning and end LF stimuli differed by >1. Dashed line indicates the normalized score (1.0) for the response to the 1st presentation of the LF component alone. Mean ± SE. N. robustus (n = 9), N. bivocatus (n = 3), N. triops (n = 3). Bottom: AN-2 responses to two-tone stimuli collected in the same manner as B. Dashed line indicates the normalized score (1.0) for the response to the 1st presentation of the LF component alone. Mean ± SE. N. robustus (n = 3), N. bivocatus (n = 3), N. triops (n = 6).
Next we tested two-tone inhibition at the level AN-1 and AN-2. The results for AN-1 differed among the three species. In N. robustus, the addition of the second harmonic reduced the number of APs elicited in AN-1 by ≤25% (Fig. 8, middle); this reduction was statistically significant (Kruskal-Wallis, P = 0.006). In N. bivocatus, adding the second harmonic led to a weak, statistically nonsignificant reduction (Kruskal-Wallis: N. bivocatus, P = 0.26, n = 3), but note the small sample size. In N. triops, there was a slight increase of response strength, which again was not statistically significant (Kruskal-Wallis: P = 0.89, n = 3). For AN-2, responses increased progressively with the amplitude of the second harmonic in all three species (Fig. 8, bottom). This is in agreement with the shape of the intensity response functions presented in Fig. 7.
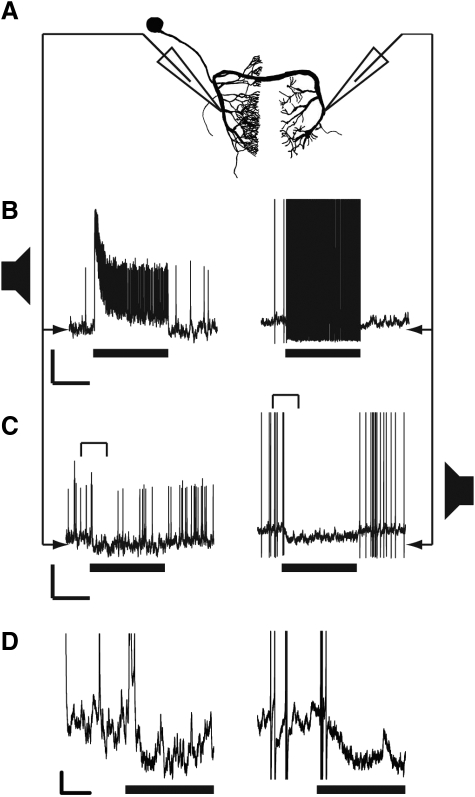
ON
The three species also possessed the ON, a local auditory interneuron that has been well described in other Tettigoniid species (Molina and Stumpner 2005; Römer et al. 1988; Schul 1997; Stumpner 2002). The morphology of the ON (shown for N. triops; Fig. 9A) was similar for all three species with an anterior soma and dendrites in the soma-ipsilateral side that do not cross the midline. The axon crosses the midline and the terminals are located on the soma-contralateral side.
FIG. 9.
A: morphology of the local omega neuron in N. triops. Omega morphology was similar in the other 2 species. The dendritic processes are located on the soma-ipsilateral, whereas the axonal processes are on the soma-contralateral side. B: dendritic (left) and axonal (right) responses to conspecific call stimuli presented from the soma-ipsilateral (preferred) side. Axonal responses were 60 mV, but truncated at 40 mV in the figure. Scale bars: 500 ms, 10 mV. C: dendritic and axonal responses to the same stimulus presented from the soma-contralateral side. Axonal responses truncated at 40 mV. Brackets indicated portions of traces expanded in D. Scale bars: 500 ms, 10 mV. D: traces in C expanded to better show the hyperpolarization in both axonal and dendritic recordings. AP amplitudes are truncated. Black bar represents the stimulus. Scale bars: 100 ms, 2 mV.
Using call models, soma-ipsilateral stimulation elicited a barrage of APs that continued for the duration of the stimulus (Fig. 9B). In soma-ipsilateral (dendritic) recordings, these APs were riding on top of excitatory postsynaptic potential (EPSP) and had smaller amplitudes than in soma-contralateral (axonal) recordings. Soma-contralateral stimulation evoked only few APs. In dendritic recordings, a strong hyperpolarizing inhibitory postsynaptic potential (IPSP) occurred, with transient EPSPs riding on top of the hyperpolarization (Fig. 9, C and D, left). In soma-contralateral (axonal) recordings, we detected a strong hyperpolarization during soma-contralateral stimulation (Fig. 9, C and D, right). Recording sites were confirmed morphologically by the dye injection site.
DISCUSSION
We identified four auditory interneurons in each of the three species: one local interneuron and three neurons with ascending axons to the SOG. Of these three neurons, two (AN-1 and AN-2) responded tonically to call models, whereas the third (TN-1) did not. Therefore AN-1 and AN-2 could provide call information to the SOG. Spectral processing by AN-1 differed significantly among the three species, whereas spectral processing did not differ for AN-2.
We assigned the names of these four neurons based on their morphological and physiological similarities to auditory interneurons found in other Tettigoniid species (Hardt 1988; Römer et al. 1988; Schul 1997; Stumpner 1997, 1999; Stumpner and Molina 2006). Especially TN-1 and AN-1 are strikingly similar among all studied Tettigoniids. In the Tettigoniid subfamily Phaneropterinae, two neurons (AN-2 and AN-3) with similar characteristics as the Neoconocephalus AN-2 have been described (Stumpner and Molina 2006), and the homology among these neurons is not obvious. Although proving homology of these neurons among different katydid and cricket species is difficult, the striking similarities nevertheless suggest common developmental and evolutionary origins.
The three neurons with ascending axons (AN-1, AN-2, and TN-1) seem to be the standard set of neurons transmitting auditory information to the SOG in katydids (Hardt 1988; Römer et al. 1988; Schul 1997; Stumpner and Molina 2006). However, some species (e.g., Tettigonia viridissima; Schul 1997) or subfamilies (e.g., Phaneropterinae; Stumpner 1997, 1999; Stumpner and Molina 2006) have additional auditory neurons ascending to the SOG. Phaneropterines have notably more auditory neurons with axons ascending to the SOG, which seems to be correlated to the elaborate communication system involving duetting male and female calls (Stumpner 1997, 1999).
We recorded extensively from the auditory neuropile in the three Neoconocephalus species. We never encountered stainings of auditory neurons ascending toward the SOG that did not morphologically and physiologically match AN-1, AN-2, or TN-1. This strongly suggests that these three cells represent the complete set of neurons transmitting auditory information to the SOG in these three Neoconocephalus species. Similarily small sets have been described in other katydids (Tettigonia cantans; Hardt 1988) and crickets (Hennig 1988). We acknowledge that additional auditory neurons ascending to the SOG that eluded our recordings might be present in Neoconocephalus (e.g., because of being too small). However, because we do not have not evidence that additional neurons exist, we base the following discussion on the assumption that we recorded from the complete ascending auditory pathway.
In Tettigoniids, the auditory receptor cells (35 in N. bivocatus, Höbel and Schul 2007) converge onto this small number of neurons comprising the ascending pathway. The reduction of information occurring during this convergence, particularly in the spectral domain, determines which information is available to the SOG and therefore significantly affects object recognition processing in these insects. This “preprocessing” varied across the three species and may contribute to both temporal and spectral call recognition.
Temporal processing
The temporal selectivity of females during phonotaxis differs qualitatively among the three species, as shown by behavioral experiments (Beckers and Schul 2008; Deily and Schul 2004). Female N. robustus respond to signals without gaps <3–4 ms. In contrast, N. bivocatus and N. triops respond to signals with AM rates close to the double pulse rate of the male calls. The double pulse structure of the male calls is not necessary, and females respond to single pulse stimuli as long as the pulse rate is close to the preferred rate.
In all three species, AN-1 transmitted detailed information about the pulse pattern, required for temporal call recognition, to the SOG (Fig. 3). AN-2 is unlikely to contribute much to the recognition of the pulse pattern, because its responses did not reliable encode the pulse pattern. AN-2 may contribute to other aspects of call processing.
In N. robustus, AN-1 responded with one AP per pulse and did not encode pulse duration. The call recognition mechanism seems to evaluate the interspike interval because gaps that are too long render the call unattractive (Deily and Schul 2004). This mechanism would predict that for very short pulses (<3 ms), longer gaps are tolerated, as long as the pulses reliably elicit APs with the same interspike interval. Indeed, although 3-ms pulse duration and 2-ms gap call models are attractive (5-ms interspike interval), so are models with a 1-ms pulse duration and 4-ms gaps (5-ms interspike interval; Deily and Schul 2004).
In N. bivocatus, AN-1 also responded to each pulse with one AP (i.e., each double pulse elicits a pair of APs; Fig. 3, A and B). The behaviorally relevant temporal parameter, the double pulse rate, is not directly represented in the spike train: the instantaneous frequency histogram does not have a peak at the double pulse rate (90 Hz; Fig. 3B). Given that AN-1 is the only described neuron that transmits the pulse pattern to the SOG, it seems likely that the double pulse rate is extracted from AN-1 responses in the SOG.
In N. triops, AN-1 responses differed from those in the other two species in that it responded with only one AP per double pulse. The responses encode the double pulse rate of the call and thus provide the parameter used in female call recognition directly to the call recognition networks in the SOG. Thus feature extraction of the double pulse rate seems to occur at different neural levels in N. triops (AN-1) and N. bivocatus (SOG). Therefore even though these two species exhibit comparable temporal selectivity, the temporal call recognition networks differ in structure. Finding such differences is not surprising because both the double pulse call and the conspecific recognition mechanisms evolved convergently in N. triops and N. bivocatus (Snyder 2009).
At this point, it is not clear whether the different AN-1 response patterns to call models between N. triops and N. bivocatus were caused by properties of the neurons or whether they merely reflect differences of the stimuli. Further experiments are needed to examine this issue.
Spectral processing
Female responses in all three species are limited to stimuli with sonic carrier frequencies. In N. robustus, responses were limited to frequencies between 5 and 10 kHz, whereas the two other species responded ≤20 kHz (Deily and Schul 2006; J. S., unpublished data). Also, higher frequencies have a strong inhibitory effect in N. robustus, but only a weak, if any, effect in the other two species (Fig. 8, top).
The receptor neurons of Tettigoniids have a remarkable spectral resolution, with best frequencies of individual receptor cells ranging from ∼6 to 60 kHz (Höbel and Schul 2007). At the level of the ascending pathway, this spectral information is strongly reduced. Only AN-1 has noteworthy spectral selectivity where the tuning of AN-2 and TN-1 reflect the tuning of the receptor organ (Fig. 7A) (Schul and Sheridan 2006). The spectral properties of the ascending neurons strongly suggest that phonotactic behavior is mainly driven by AN-1 in the three Neoconocephalus species tested here.
AN-1 receives excitatory input predominantly from low-frequency receptors (Römer 1987; Stumpner 1998). The flattening of the intensity response function at intermediate stimulus amplitudes (Fig. 6A) and the reduced responses in the two-tone experiments (Fig. 8, middle) indicate an inhibitory input activated by receptors tuned to higher frequencies, likely mediated by a local interneuron (Stumpner 1998).
The strong reduction of spectral information between receptor cells and ascending interneurons suggests that species-specific differences in spectral selectivity could be generated at this level. Differences in AN-1 tuning (Fig. 6B) and the increased inhibition of AN-1 by high frequencies in N. robustus parallel the behavioral differences described above. However, the spectral properties of the N. robustus AN-1 apparently do not alone explain the behavioral selectivity. Foremost, the inhibition of higher frequencies reduces AN-1 responses only by ∼25%, whereas it completely suppresses phonotactic behavior (Fig. 8, top and middle). This would suggest that spectral processing also takes place at the level of the SOG of N. robustus.
An alternative explanation would be that the high-frequency inhibition changes AN-1 temporal responses to call models. High-frequency inhibition might reduce responses to a degree that AN-1 activity no longer sufficiently represents the temporal pattern. Recall that AN-1 is the only interneuron transmitting the pulse pattern to the SOG and that female N. robustus do not respond if silent intervals longer that a few milliseconds are present in the call. Thus a slight reduction of AN-1 responses caused by high-frequency inhibition might lead to a strong reduction in phonotaxis.
Function of AN-2
AN-2 did not encode the temporal call pattern with any precision (Fig. 5), nor was it spectrally selective. A possible role of AN-2 in call processing is encoding sound amplitude. Because of its temporal response properties (1 AP per pulse or double pulse), AN-1 has only limited potential to encode amplitude. In contrast, AN-2 responses increase with call amplitude, as suggested by its intensity–response functions. Encoding of call amplitude is critical for call localization (Michelsen 1998).
ON
The local ON contributes to call localization by inhibiting the contralateral AN-1, AN-2, and TN-1 (Horseman and Huber 1994; Selverston et al. 1985). ON itself receives, as in other Tettigoniid species, lateral inhibition dendritically (most likely mediated by its lateral homologue), and axonally from an unknown source (Molina and Stumpner 2005; Schul 1997). This seemingly differs from the ON-1 in crickets, where axonal contralateral inhibition has not been described (Stiedl et al. 1997; A. Stumpner, personal communication).
TN-1
During stimulation with call models, TN-1 responded only to the call beginning, making it an unlikely contributor to call processing in Neoconocephalus (Fig. 2). Instead, TN-1 likely has a role in bat avoidance behaviors (Faure and Hoy 2000; Libersat and Hoy 1991; Schul and Schulze 2001; ter Hofstede and Fullard 2008) and in detecting new auditory events (Schul and Sheridan 2006).
Methodological considerations
Intracellular recordings from dendrites are a powerful method because they allow morphological identification and show the synaptic processing underlying the neuron's responses. However, penetration of the dendrite often leads to recording artifacts, such as increased spontaneous activity and firing rates (Horseman and Huber 1994; Stumpner et al. 1995). These artifacts may interfere with the quantitative analysis of the neuron's response properties. The fine scale encoding of the temporal pattern by AN-1 and AN-2 seems especially susceptible. However, our study provides criteria to identify AN-1, AN-2, and TN-1 physiologically, which allow their quantitative response properties to be studied using extracellular recordings (e.g., hook recordings from connectives) or axonal recordings, without the need of staining the morphology.
GRANTS
This work was supported by National Science Foundation Grants IBN-0324290 and IOS-0722109 to J. Schul and Ruth L. Kirschstein National Research Service Award F32 DC008925 awarded by the National Institute on Deafness and Other Communication Disorders to J. D. Triblehorn.
Acknowledgments
We thank K. Frederick-Hudson, K. Brueggen, S. Bush, and O. Beckers for help in collecting animals and two anonymous reviewers whose comments improved the manuscript.
REFERENCES
- Beckers 2008.Beckers OM, Schul J. Developmental plasticity of mating calls enables acoustic communication in diverse environments. Proc R Soc Ser B Biol 275: 1243–1248, 2008. [DOI] [PMC free article] [PubMed] [Google Scholar]
- Bush 2009.Bush SL, Beckers OM, Schul J. A complex mechanism of call recognition in the katydid Neoconocephalus affinis (Orthoptera: Tettigoniidae). J Exp Biol 212: 648–655, 2009. [DOI] [PubMed] [Google Scholar]
- Deily 2004.Deily JA, Schul J. Recognition of calls with exceptionally fast pulse rates: female phonotaxis in the genus Neoconocephalus (Orthoptera:Tettigoniidae). J Exp Biol 207: 3523–3529, 2004. [DOI] [PubMed] [Google Scholar]
- Deily 2006.Deily JA, Schul J. Spectral selectivity during phonotaxis: a comparative study in Neoconocephalus (Orthoptera:Tettigoniidae). J Exp Biol 209: 1757–1764, 2006. [DOI] [PubMed] [Google Scholar]
- Deily 2009.Deily JA, Schul J. Selective phonotaxis in Neoconocephalus nebrascensis (Orthoptera:Tettigoniidae): call recognition at two temporal scales. J Comp Physiol [A] 195: 31–37, 2009. [DOI] [PubMed] [Google Scholar]
- Faure 2000.Faure PA, Hoy RR. Neuroethology of the T-call I. Responses to acoustic playback of conspecific and predatory signals. J Exp Biol 203: 3243–3254, 2000. [DOI] [PubMed] [Google Scholar]
- Feng 2000.Feng AS, Ratnam R. Neural basis of hearing in real-world situations. Annu Rev Psychol 51: 699–725, 2000. [DOI] [PubMed] [Google Scholar]
- Fielden 1960.Fielden A. Transmission through the last abdominal ganglion of the dragonfly nymph, Anax imperator. J Exp Biol 37: 832–844, 1960. [Google Scholar]
- Gentner 2004.Gentner TQ. Neural systems for individual song recognition in adult birds. Ann NY Acad Sci 1016: 282–302, 2004. [DOI] [PubMed] [Google Scholar]
- Gerhardt 2002.Gerhardt HC, Huber F. Acoustic Communication in Insects and Anurans: Common Problems and Diverse Solutions. Chicago, IL: University of Chicago Press, 2002.
- Hardt 1988.Hardt M. Zur Phonotaxis von Laubheuschrecken: eine vergleichende verhaltensphysiologische und neurophysiologisch/neuroanatomische Untersuchung (PhD thesis). Ruhr Univ, Bochum, 1988.
- Hennig 1988.Hennig RM. Ascending auditory interneurons in the cricket Teleogryllus commodus (Walker): comparative physiology and direct connections with afferents. J Comp Physiol [A] 163: 135–143, 1988. [DOI] [PubMed] [Google Scholar]
- Höbel 2007.Höbel G, Schul J. Listening for males and bats: spectral processing in the hearing organ of Neoconocephalus bivocatus (Orthoptera: Tettigoniidae). J Comp Physiol [A] 193: 917–925, 2007. [DOI] [PubMed]
- Horseman 1994.Horseman G, Huber F. Sound localization in crickets. I. Contralateral inhibition of an ascending auditory interneuron (AN-1) in the cricket Gryllus bimaculatus. J Comp Physiol [A] 175: 389–398, 1994. [Google Scholar]
- Kaas 1999.Kaas JH, Hackett TA, Tramo MJ. Auditory processing in primate cerebral cortex. Curr Opin Neurobiol 9: 164–170, 1999. [DOI] [PubMed] [Google Scholar]
- Kanwal 2007.Kanwal JS, Rauschecker JP. Auditory cortex of bats and primates: managing species specific calls for social communication. Front Biosci 12: 4621–4640, 2007. [DOI] [PMC free article] [PubMed] [Google Scholar]
- Lakes 1990.Lakes R, Schikorsky T. Neuroanatomy of tettigoniids. In: The Tettigoniidae: Biology, Systematic and Evolution, edited by Bailey WJ, Rentz DCF. Berlin: Springer, 1990, p. 166–189.
- Libersat 1991.Libersat F, Hoy RR. Ultrasonic startle behaviour in bushcrickets (Orthoptera:Tettigoniidae). J Comp Physiol [A] 169: 507–514, 1991. [DOI] [PubMed] [Google Scholar]
- Michelsen 1998.Michelsen A. Biophysics of sound localization in insects. In: Comparative Hearing: Insects, edited by Hoy RR, Popper AN, Fay RR. New York: Springer, 1998, p. 18–62.
- Molina 2005.Molina J, Stumpner A. Effects of pharmacological treatment and photoinactivation on the directional responses of an insect interneuron. J Exp Zool 303A: 1085–1103, 2005. [DOI] [PubMed] [Google Scholar]
- Römer 1987.Römer H. Representation of auditory distance within a central neuropile of the bushcricket Mygalopsis marki. J Comp Physiol [A] 161: 33–42, 1987. [Google Scholar]
- Römer 1988.Römer H, Marquardt V, Hardt M. Organization of a sensory neuropile in the auditory pathway of two groups of Orthoptera. J Comp Neurol 275: 201–215, 1988. [DOI] [PubMed] [Google Scholar]
- Schul 1997.Schul J. Neuronal basis of phonotactic behaviour in Tettigonia viridissima: processing of behaviourally relevant signals by auditory afferents and thoracic interneurons. J Comp Physiol [A] 180: 573–583, 1997. [Google Scholar]
- Schul 1998.Schul J. Song recognition by temporal cues in a group of closely related bushcricket species (Genus Tettigonia). J Comp Physiol [A] 183: 401–410, 1998. [Google Scholar]
- Schul 2001.Schul J, Schulze W. Phonotaxis during walking and flight: are differences in selectivity due to predation pressure? Naturwissenschaften 88: 438–442, 2001. [DOI] [PubMed] [Google Scholar]
- Schul 2006.Schul J, Sheridan RA. Auditory stream segregation in an insect. Neuroscience 138: 1–4, 2006. [DOI] [PubMed] [Google Scholar]
- Selverston 1985.Selverston AI, Kleindienst H-U, Huber F. Synaptic connectivity between cricket auditory interneurons as studied by selective photoinactivation. J Neurosci 5: 1283–1292, 1985. [DOI] [PMC free article] [PubMed] [Google Scholar]
- Snyder 2009.Snyder RL. Phylogenetic Patterns in the Communication Signals of Treehoppers (Enchenopa binotata sps complex) and Katydids (Neoconocephalus sps) (PhD thesis). Columbia, MO: Univ. of Missouri, 2009.
- Stiedl 1997.Stiedl O, Stumpner A, Mbungu D, Atkins G, Stout J. Morphology and physiology of local auditory interneurons in the prothoracic ganglion of the cricket Acheta domesticus. J Exp Zool 2: 43–53, 1997. [Google Scholar]
- Stumpner 1997.Stumpner A. An auditory interneurone tuned to the male song frequency in the duetting bushcricket Ancistrura nigrovittata (Orthoptera: Phaneropteridae). J Exp Biol 200: 1089–1101, 1997. [DOI] [PubMed] [Google Scholar]
- Stumpner 1998.Stumpner A. Picrotoxin eliminates frequency selectivity of an auditory interneuron in a bushcricket. J Neurophysiol 79: 2408–2415, 1998. [DOI] [PubMed] [Google Scholar]
- Stumpner 1999.Stumpner A. An interneurone of unusual morphology is tuned to the female song frequency in the bushcricket Ancistrura nigrovittata. J Exp Biol 202: 2071–2081, 1999. [DOI] [PubMed] [Google Scholar]
- Stumpner 2002.Stumpner A. A species-specific frequency filter through specific inhibition, not specific excitation. J Comp Physiol [A] 188: 239–248, 2002. [DOI] [PubMed] [Google Scholar]
- Stumpner 1995.Stumpner A, Atkins G, Stout JF. Processing of unilateral and bilateral auditory inputs by the ON1 and L1 interneurons of the cricket Acheta domesticus and comparison to other cricket species. J Comp Physiol [A] 177: 379–388, 1995. [Google Scholar]
- Stumpner 2006.Stumpner A, Molina J. Diversity of intersegmental auditory neurons in a bush cricket. J Comp Physiol [A] 192: 1359–1376, 2006. [DOI] [PubMed] [Google Scholar]
- Stumpner 2001.Stumpner A, von Helversen D. Evolution and function of auditory systems in insects. Naturwissenschaften 88: 159–170, 2001. [DOI] [PubMed] [Google Scholar]
- ter Hofstede 2008.ter Hofstede HM, Fullard JH. The neuroethology of song cessation in response to gleaning bat calls in two species of katydids, Neoconocephalus ensiger and Ampblycorypha oblongifolia. J Exp Biol 211: 2431–2441, 2008. [DOI] [PubMed] [Google Scholar]
- Weber 1981.Weber T, Thorson J, Huber F. Auditory behaviour of the cricket. I. Dynamics of compensated walking and discrimination paradigms on the Kramer treadmill. J Comp Physiol [A] 141: 215–232, 1981. [Google Scholar]


