

Abstract
Background
Von Willebrand factor (vWF) is inconsistently associated with cardiovascular disease (CVD). This might be explained by associations of vWF with type 2 diabetes and insulin resistance.
Methods and Results
We tested whether vWF predicted incident CVD in 3,799 Framingham Offspring Study participants, and in particular, among those with type 2 diabetes or insulin resistance. During 11 years of follow-up, 351 participants developed CVD. In proportional hazards models (adjusting for age, sex, blood pressure, smoking, body mass index, total and HDL cholesterol, treatment with aspirin, insulin, antihypertensive and lipid lowering medication) using the lowest quartile of the vWF distribution as the referent, the hazard ratio (HR) for CVD was 0.94 in the second quartile, 0.98 in the third, and 1.32 in the highest (P= 0.04 for trend). Additional adjustment for type 2 diabetes or insulin resistance (homeostasis model, HOMA-IR) partially attenuated the association (multivariable HRs for top quartile 1.28 and 1.21, respectively). We then stratified the models by diabetes status or HOMA-IR distribution (top quartile versus lower three). vWF was associated with CVD among participants with diabetes (HR, top quartile relative to bottom 1.47, P = 0.04 for trend) but not among non-diabetics (HR 1.15, P = 0.5) and similarly among insulin resistant (HR 1.50, P = 0.01) but not insulin sensitive participants (HR 1.02, P = 0.9).
Conclusions
Higher levels of vWF were associated with risk of CVD in people with type 2 diabetes or insulin resistance, suggesting that vWF may be a risk factor unique to these populations.
Keywords: von Willebrand factor, type 2 diabetes, insulin resistance, cardiovascular disease, epidemiology
Background
Cardiovascular disease (CVD) accounts for approximately 35 percent of the deaths in the United States.1 Major established CVD risk factors, including diabetes, hypertension, hyperlipidemia and cigarette smoking are found in most but not all who develop CVD.2–4 Endothelial dysfunction is also thought to contribute to development of CVD, via dysregulation of vascular tone, growth, thrombogenicity and inflammation.5 Several inflammatory and hemostatic biomarkers of endothelial dysfunction have been associated with CVD, including C-reactive protein (CRP)6–8 and interleukin-6,9 and fibrinogen,10,11 fibrin D-dimer,12 plasminogen activator inhibitor-113 and cellular adhesion molecules.14,15
Von Willebrand factor (vWF) is a large glycoprotein produced by vascular endothelial cells, which mediates platelet adhesion to injured endothelium, the first step in thrombus formation. vWF also serves as the carrier protein for coagulation factor VIII.16 Given its essential role in thrombosis, as well as the possibility that vWF could serve as a biomarker of endothelial damage, the role of vWF in prediction of CVD has been studied extensively. Results have been mixed, with some finding significant associations between vWF and CVD,17–24 and others not.25–30
vWF has recently been associated with insulin resistance and type 2 diabetes,31–33 raising the question of whether the association between vWF and CVD is confounded by these intermediaries. Further, persons with type 2 diabetes are known to have increased risk for CVD that exceeds the expected effect of associated traditional CVD risk factors.34 Among participants with type 2 diabetes, insulin resistance has been associated with worse endothelial function33 and treatment with thiazolidinediones (insulin sensitizers) has been shown to improve endothelial function.35 These observations suggest that vWF may be a risk factor for CVD unique to patients with type 2 diabetes or insulin resistance. Inconsistent observations about the relationship between vWF and CVD to date may be the result of studying patient populations with varying prevalence of diabetes and insulin resistance.
With this background in mind, we used the experience of the Framingham Offspring Study to test the hypothesis that elevated levels of vWF confer risk for new CVD after accounting for possible confounding by traditional CVD risk factors, including type 2 diabetes and insulin resistance (using the surrogate homeostasis model insulin resistance HOMA-IR). We further sought to examine whether vWF is a particularly potent, independent risk factor for CVD in those with type 2 diabetes or insulin resistance.
Methods
Study Subjects
The Framingham Offspring Study is a community-based, prospective, observational study of cardiovascular disease and its risk factors. It was initiated in 1971 by enrolling children of the original Framingham Heart Study cohort and the children’s spouses. Members of the Offspring cohort are white and of mixed European ancestry.36 During the fifth exam cycle (1991–1995; the baseline exam for the present study) 3,799 participants underwent a standardized medical history, physical examination, 12-lead electrocardiogram and analysis of fasting blood samples.37 We measured vWF levels in 3,564 participants. Of these, we excluded 355 with CVD at baseline and 122 with missing risk factor covariate information, leaving 3,087 subjects for analysis. Subjects excluded for missing vWF levels or risk factor covariate information were similar to those included in the analysis (P>0.05 for all comparisons). The study protocol was approved by the institutional review board of the Boston University School of Medicine and all participants provided written informed consent.
Clinical Definitions and Laboratory Methods
We measured height and weight with the subject standing in light clothes. Body mass index was calculated as the weight in kilograms divided by the square of the height in meters (kg/m2). Blood pressure values were taken as the mean of two measurements after the subject had been seated for at least five minutes. We defined diabetes as a fasting plasma glucose >125 mg/dL or treatment with glucose lowering medication.38 Those who reported smoking cigarettes regularly during the year prior to the exam were considered current smokers.
Subjects fasted overnight to provide a blood specimen. Samples were frozen at −80°C until assay. Laboratory methods for glucose, insulin and lipid assays have been published previously.39,40 The Framingham laboratory participates in the Centers for Disease Control lipoprotein cholesterol laboratory standardization program. We measured insulin resistance with the homeostasis model using the following validated formula: HOMA-IR = (fasting glucose (mmol/l) x fasting insulin (µU/mL)) / 22.5.41,42 vWF antigen was measured with an ELISA assay, as previously described.43 Intra-assay coefficients of variation were <3% for glucose, <10% for insulin and 8.8% for vWF.
Ascertainment of CVD
We defined CVD as coronary heart disease (myocardial infarction or angina pectoris), heart failure, stroke or intermittent claudication, according to previously described Framingham criteria.44 All study participants were under continuous surveillance for CVD events from baseline examination through end of follow-up in December, 2006. Suspected CVD events were adjudicated by a panel of three experienced investigators, including a neurologist for suspected strokes, who reviewed hospital records, clinic notes and pathology reports.
Statistical Analyses
For the primary analysis we classified subjects into quartiles of the distribution of vWF. vWF level thresholds at the first, second and third quartile were 91.3, 120.6 and 156.6 (IU/dl), respectively. We used a series of Cox proportional-hazards regression models to test the hypothesis that there is a linear relationship between vWF levels and 11 year incidence of CVD (i.e., that higher levels of vWF are associated with increased risk of CVD) after adjustment for potentially confounding CVD risk factors. Cox models provided hazard ratios (HR) and 95% confidence intervals (CI) for incident CVD conditioned on baseline exposures. Models testing linear trend in incidence of CVD across vWF quartiles were adjusted for 1) age and sex; 2) age, sex, systolic blood pressure, smoking, body mass index, total and HDL cholesterol, treatment with aspirin, insulin, antihypertensive and lipid lowering medication; 3) the variables in model 2 and diabetes and HOMA-IR, individually and then combined. Given 351 CVD events, the study power at alpha = 0.05 to detect a HR of 1.4 across the trend of quartiles was 59.9%; HR 1.5, 75.8%; HR 1.6, 86.8%; and HR 1.7, 93.4%. We constructed Kaplan-Meier survival curves for survival free of CVD according to quartile of the vWF distribution. We used ANOVA or Mantel-Haenszel tests of linear trend to assess differences in risk factor means (continuous risk factors) or proportions (categorical risk factors) across vWF strata. For these tests, levels of HOMA-IR were log-transformed to reduce skewness; we present untransformed means in the results.
To answer the question of whether vWF is a risk factor for CVD unique to those with type 2 diabetes or insulin resistance, in the secondary analysis, we repeated the series of Cox proportional-hazards regression models stratifying subjects by the presence of diabetes versus no diabetes or by the highest quartile of the HOMA-IR distribution (which we refer to as ‘insulin resistant’) versus the lower three quartiles (‘insulin sensitive’). We performed tests for first-order interaction between vWF and diabetes and vWF and HOMA-IR level on risk for CVD. We next constructed Kaplan-Meier survival curves for survival free of CVD according to the following four categories: low vWF-no diabetes, low vWF-diabetes, high vWF-no diabetes and high vWF-diabetes. Low vWF was defined as the lower three quartiles of the vWF distribution. High vWf was defined as the top quartile. We constructed similar survival curves for vWF and the top quartile of HOMA-IR vs. the bottom three. Differences in survival in the categories were tested with the Wilcoxon rank sum test.
Analyses were performed using SAS software (version 8.1, SAS Institute, Cary, NC). P values less than 0.05 were considered to indicate statistical significance. We reduced the level of significance (<0.2) to increase power for tests of interaction, as recommended by Selvin.45 The authors had full access to and take full responsibility for the integrity of the data. All authors have read and agree to the manuscript as written.
Results
Baseline Characteristics
The mean age of participants was 54 years (SD 10) and 55% were female. Characteristics of the study subjects across strata of vWF are displayed in Table 1. The prevalence of common CVD risk factors rose with increasing levels of vWF. The mean level of vWF was higher in those with diabetes than those without diabetes (146 vs 126 IU/dl, p<0.0001) and in those with insulin resistance than those with normal insulin sensitivity (138 vs 122 IU/dl, p<0.0001).
Table 1.
Baseline characteristics of 3,087 study participants by quartiles of the von Willebrand factor distribution
| von Willebrand factor quartile |
|||||||||
|---|---|---|---|---|---|---|---|---|---|
| 1 | 2 | 3 | 4 | P value * | |||||
| N | 771 | 772 | 773 | 771 | |||||
| Women (%) | 54.6 | 56.9 | 53.3 | 54.5 | 0.6 | ||||
| Age (yr) | 51.0 | (9.1) | 53.6 | (9.6) | 54.9 | (9.8) | 57.5 | (9.7) | <.0001 |
| Systolic blood pressure (mm Hg) | 123 | (17.8) | 125 | (18.8) | 126 | (18.5) | 129 | (20.0) | <.0001 |
| Current cigarette smoking (%) | 19.8 | 18.5 | 18.4 | 20.0 | 0.9 | ||||
| Body mass index (kg/m2) | 26.7 | (4.5) | 27.2 | (4.9) | 27.6 | (5.2) | 28.0 | (5.4) | <.0001 |
| Serum total cholesterol (mg/dl) | 203 | (36.3) | 204 | (36.8) | 204 | (35.4) | 208 | (38.2) | 0.02 |
| Serum high-density lipoprotein cholesterol (mg/dl) | 51.3 | (15.0) | 50.9 | (15.2) | 49.8 | (14.6) | 49.7 | (15.6) | 0.02 |
| Treatment with aspirin (%) | 54.6 | 55.9 | 53.3 | 51.4 | 0.1 | ||||
| Treatment with insulin (%) | 0.1 | 0.5 | 0.6 | 1.7 | 0.001 | ||||
| Treatment with antihypertensive medication (%) | 14.0 | 16.3 | 16.9 | 20.2 | 0.002 | ||||
| Treatment with lipid lowering medication (%) | 3.9 | 5.7 | 6.2 | 6.5 | 0.03 | ||||
| Type 2 Diabetes (%) | 2.72 | 4.27 | 5.43 | 8.43 | <.0001 | ||||
| HOMA-IR† | 6.9 | (4.0) | 7.3 | (3.9) | 8.1 | (5.8) | 10.3 | (17.5) | <.0001 |
Data shown are means (and standard deviations) or proportions in each quartile. P values indicate significance for trend across quartiles of von Willebrand factor.
Untransformed data
vWF and CVD Risk
Three hundred fifty-one participants (146 women) developed new onset CVD over a mean of 11 years follow-up. The CVD event was myocardial infarction in 90 participants, angina pectoris in 100, heart failure in 50, stroke in 82 and intermittent claudication in 29; the cumulative incidence of CVD was 11.4%. The hazard ratio (HR) for CVD, adjusted for age and sex, increased across strata of vWF (Table 2). Increased risk associated with higher strata of vWF persisted after further adjustment for systolic blood pressure, smoking, body mass index, total and HDL cholesterol, treatment with aspirin, insulin, antihypertensive and lipid lowering medication (Table 2). For instance, in the latter model, using the lowest quartile as the referent, the HR for CVD was 0.94 in the second quartile, 0.98 in the third and 1.32 in the highest quartile (p=0.04 for trend across quartiles). With further adjustment for diabetes or HOMA-IR at baseline, the association of the top quartile of vWF with CVD was attenuated (HR 1.28 p=0.06 for trend; HR 1.21 p=0.2, respectively). Survival free of CVD decreased with increasing quartiles of the vWF distribution (Figure 1, p <0.0001).
Table 2.
Nested Cox proportional hazard models testing the incidence of cardiovascular disease across quartiles of plasma von Willebrand factor*
| von Willebrand factor quartile | |||||||||||
|---|---|---|---|---|---|---|---|---|---|---|---|
| 1 | 2 | 3 | 4 | P value* | |||||||
| Number of CVD events | 66 | 76 | 84 | 125 | |||||||
| Incidence density (CVD events/100 person year) | 0.76 | 0.89 | 0.98 | 1.59 | |||||||
| Model 1† | 1.00 | 0.99 | 0.97 | 1.42 | 0.02 | ||||||
| 0.71 | - | 1.38 | 0.70 | - | 1.35 | 1.05 | - | 1.93 | |||
| Model 2‡ | 1.00 | 0.94 | 0.98 | 1.32 | 0.04 | ||||||
| 0.68 | - | 1.31 | 0.70 | - | 1.35 | 0.97 | - | 1.80 | |||
| Model 3A: Model 2 + DM | 1.00 | 0.92 | 0.99 | 1.28 | 0.06 | ||||||
| 0.66 | - | 1.29 | 0.71 | - | 1.37 | 0.94 | - | 1.74 | |||
| Model 3B: Model 2 + HOMA-IR | 1.00 | 0.93 | 0.94 | 1.21 | 0.2 | ||||||
| 0.67 | - | 1.29 | 0.68 | - | 1.31 | 0.89 | - | 1.65 | |||
| Model 3C: Model 2 + DM + HOMA-IR | 1.00 | 0.92 | 0.96 | 1.22 | 0.1 | ||||||
| 0.66 | - | 1.28 | 0.69 | - | 1.33 | 0.89 | - | 1.66 | |||
P values indicate significance of trend across strata of von Willebrand Factor.
Hazard ratios with 95% confidence intervals adjusted for age and sex
Hazard ratios adjusted for age, sex, systolic blood pressure, smoking, body mass index, total and HDL cholesterol, treatment with aspirin, insulin, antihypertensive and lipid lowering medication
CVD= cardiovascular disease, DM = type 2 diabetes mellitus, HOMA-IR = insulin resistance measured with the homeostasis model
Figure 1.
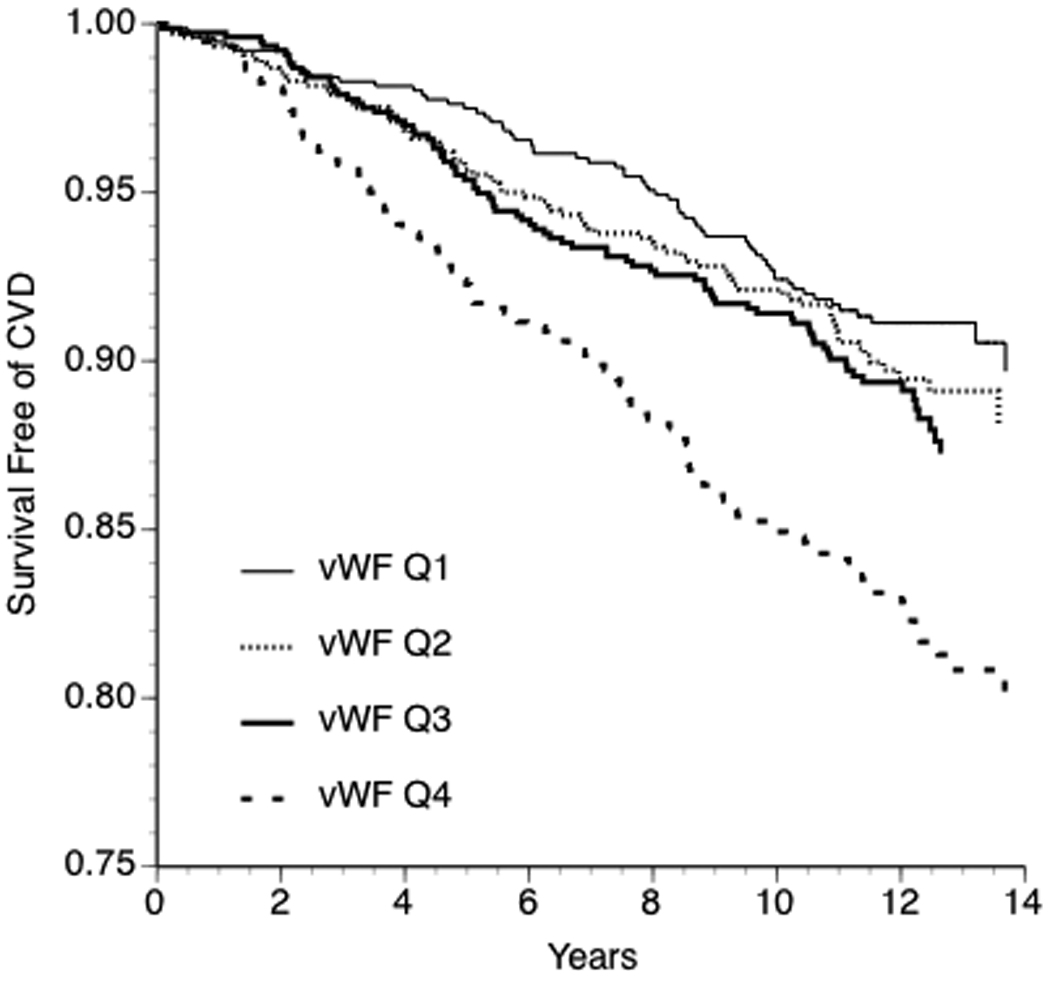
Kaplan-Meier curves for survival free of cardiovascular disease stratified by quartile of vWF antigen (Wilcoxon rank sum P <0.0001).
We next repeated the analysis, stratifying subjects by the presence versus absence of diabetes or by the highest quartile of HOMA-IR (‘insulin resistant’) versus the lower three quartiles combined (Table 3). vWF was associated with CVD among participants with diabetes (risk factor- and HOMA-IR-adjusted HR for top quartile relative to bottom quartile 1.47, P = 0.04 for trend across quartiles) but not among participants without diabetes (HR 1.15, P = 0.5). Similarly, vWF was associated with CVD among those with ‘insulin resistance’ (risk factor- and diabetes-adjusted HR 1.50, P = 0.01) but not among those with normal insulin sensitivity (HR 1.02, P = 0.9). Formal testing indicated a significant interaction between diabetes and vWF on CVD risk (p=0.2) and between insulin resistance and vWF on CVD risk (p=0.08).
Table 3.
Nested Cox proportional hazard models testing the incidence of cardiovascular disease across quartiles of plasma von Willebrand factor, stratified by the presence or absence of type 2 diabetes or insulin resistance
| von Willebrand factor quartile |
||||||||||||||||||||||
|---|---|---|---|---|---|---|---|---|---|---|---|---|---|---|---|---|---|---|---|---|---|---|
| 1 | 2 | 3 | 4 | P value * | 1 | 2 | 3 | 4 | P value * | |||||||||||||
| Type 2 Diabetes |
No diabetes |
|||||||||||||||||||||
| Number of CVD events | 7 | 8 | 11 | 32 | 59 | 68 | 73 | 93 | ||||||||||||||
| Incidence density (CVD events/100 person year) | 3.55 | 2.32 | 2.85 | 6.33 | 0.69 | 0.83 | 0.89 | 1.26 | ||||||||||||||
| Model 1† | 1.00 | 0.53 | 0.82 | 1.58 | 0.02 | 1.00 | 1.03 | 0.97 | 1.24 | 0.2 | ||||||||||||
| 0.19 | - | 1.48 | 0.31 | - | 2.11 | 0.69 | - | 3.66 | 0.72 | - | 1.46 | 0.68 | - | 1.37 | 0.89 | - | 1.73 | |||||
| Model 2‡ | 1.00 | 0.51 | 0.88 | 1.56 | 0.02 | 1.00 | 1.01 | 0.95 | 1.19 | 0.4 | ||||||||||||
| 0.18 | - | 1.49 | 0.32 | - | 2.37 | 0.64 | - | 3.78 | 0.71 | - | 1.44 | 0.67 | - | 1.34 | 0.85 | - | 1.66 | |||||
| Model 3: Model 2 + HOMA-IR | 1.00 | 0.52 | 0.86 | 1.47 | 0.04 | 1.00 | 1.00 | 0.93 | 1.15 | 0.5 | ||||||||||||
| 0.18 | - | 1.52 | 0.32 | - | 2.33 | 0.60 | - | 3.61 | 0.70 | - | 1.42 | 0.66 | - | 1.32 | 0.82 | - | 1.61 | |||||
|
HOMA-IR Top Quartile |
HOMA-IR Quartiles 1–3 |
|||||||||||||||||||||
| Number of CVD events | 24 | 25 | 34 | 74 | 42 | 51 | 50 | 51 | ||||||||||||||
| Incidence density (CVD events/100 person year) | 1.66 | 1.53 | 1.57 | 2.93 | 0.58 | 0.74 | 0.78 | 0.95 | ||||||||||||||
| Model 1† | 1.00 | 0.81 | 0.85 | 1.50 | 0.02 | 1.00 | 1.08 | 0.97 | 1.05 | 0.9 | ||||||||||||
| 0.46 | - | 1.42 | 0.50 | - | 1.44 | 0.94 | - | 2.39 | 0.71 | - | 1.62 | 0.64 | - | 1.47 | 0.69 | - | 1.60 | |||||
| Model 2‡ | 1.00 | 0.77 | 0.93 | 1.50 | 0.01 | 1.00 | 1.06 | 0.97 | 1.03 | 0.9 | ||||||||||||
| 0.44 | - | 1.36 | 0.55 | - | 1.57 | 0.94 | - | 2.39 | 0.70 | - | 1.60 | 0.64 | - | 1.47 | 0.67 | - | 1.58 | |||||
| Model 3: Model 2 + DM | 1.00 | 0.76 | 0.93 | 1.50 | 0.01 | 1.00 | 1.06 | 0.97 | 1.02 | 0.9 | ||||||||||||
| 0.43 | - | 1.34 | 0.55 | - | 1.58 | 0.94 | - | 2.40 | 0.70 | - | 1.59 | 0.64 | - | 1.47 | 0.66 | - | 1.56 | |||||
P values indicate significance of trend across strata of von Willebrand Factor.
Hazard ratios with 95% confidence intervals adjusted for age and sex
Hazard ratios adjusted for age, sex, systolic blood pressure, smoking, body mass index, total and HDL cholesterol, treatment with aspirin, insulin, antihypertensive and lipid lowering medication
CVD= cardiovascular disease, DM = type 2 diabetes mellitus, HOMA-IR = insulin resistance measured with the homeostasis model
In Kaplan Meier analyses, survival free of CVD was significantly decreased in participants with high vWF and diabetes compared with the low vWF and non-diabetes groups (Figure 2, panel A, p<0.0001). A similar pattern was apparent with high vWF and high HOMA-IR (Figure 2, panel B, p<0.0001). The data suggest that while vWF appeared to have an additive effect with diabetes and insulin resistance on CVD risk, elevated CVD risk associated with elevated vWF levels was essentially confined to those with type 2 diabetes or insulin resistance.
Figure 2.

Kaplan-Meier curves for survival free of cardiovascular disease according to the following strata (Panel A): No diabetes-low vWF; no diabetes-high vWF; diabetes-low vWF; diabetes-high vWF (Wilcoxon rank sum P <0.0001). (Panel B): Insulin sensitive-low vWF; insulin sensitive-high vWF; insulin resistant-low vWF; insulin resistant-high vWF (P <0.0001). Low vWF is defined as the lower three quartiles of the vWF distribution. High vWF is the top quartile. Insulin sensitive is defined as the lower three quartiles of HOMA-IR. Insulin resistant is the top quartile.
Discussion
Principal Findings
We observed that higher levels of vWF were associated with increased risk of new-onset CVD over 11 years of follow-up of a community-based sample. This association persisted after adjustment for traditional CVD risk factors, but was weakened upon accounting for the presence of type 2 diabetes or insulin resistance. Further examination showed that elevated vWF was associated with CVD only in participants with diabetes or insulin resistance. This observation may explain past inconsistencies in the literature linking vWF to CVD, and suggests that vWF may be a CVD risk factor that is particularly prominent in type 2 diabetes and insulin resistance.
Possible Mechanisms
Under physiologic conditions, vWF is produced by vascular endothelium and plays an important role in hemostasis. Under pathologic conditions, vWF serves as a biomarker of endothelial damage and dysfunction.46,47 Endothelial dysfunction is a systemic disorder leading to atherosclerosis and CVD.48
We found that insulin resistance and diabetes attenuated the association between elevated vWF and increased risk of CVD, pointing to these as potential mediators. Elevated levels of vWF have been associated with increased risk of development of type 2 diabetes.31 Furthermore, vWF has been associated with insulin resistance in those with and those without diabetes.32,33 Thus, participants with elevated vWF tend to be insulin resistant and at elevated risk of developing diabetes, and on this basis could be at elevated risk for developing CVD.
Stratified analyses demonstrated that vWF is a risk factor for development of CVD only in participants with insulin resistance or diabetes, suggesting that these conditions exacerbate the endothelial dysfunction and pro-thrombotic state associated with risk for CVD events. Among people with diabetes, insulin resistance has been associated with worse endothelial function,33 and treatment with thiazolidinediones (insulin sensitizers) has been shown to improve endothelial function.35 A vicious cycle may exist whereby endothelial dysfunction promotes insulin resistance and diabetes, both of which in turn worsen endothelial function, accelerating atherosclerosis and the onset of clinical CVD. More severe endothelial dysfunction and hemostatic imbalance may be key atherogenic factors that account for the consistently observed, traditional risk factor-adjusted, as-yet unexplained 2–4 fold excess risk for CVD seen in type 2 diabetes.34
Strengths and Limitations
Unlike prior studies that found inconsistent relationships between vWF and CVD, we attempted to dissect the complex relationship between elevated vWF, insulin resistance and diabetes in promoting CVD. Additional strengths include studying a large, community-based sample assessed with standardized clinical measures and biomarker assays with good precision. Of interest, increased risk for CVD seemed to be confined to the top quartile of vWF; the HRs of the intermediate quartiles compared to the lowest quartile were all approximately 1. We only performed a test for linear trend across the quartiles since that was the a priori specified statistical analysis; however, future studies may search for a threshold effect of vWF on CVD incidence. Other limitations include those of biomarker interpretation. As a biomarker, elevated levels of vWF represent both endothelial dysfunction and hemostatic imbalance. It is not possible from this study to determine which has primacy in the actual mechanisms hypothesized to link vWF with new cases of CVD in people with diabetes or insulin resistance. In addition, we only have one baseline measure of vWF; evidence exists that levels of biomarkers may vary over time in response to disease progression and treatment.49 However, misclassification by vWF level is likely to be random and thus the effect is to produce an underestimate of the magnitude of the association of vWF levels with CVD risk. Generalizability of the study also is limited to white European-descent populations.
Conclusions
We found that elevated levels of vWF were associated with increased risk of cardiovascular disease in a community-based sample, even after accounting for traditional CVD risk factors. This association was attenuated by adjustment for type 2 diabetes or insulin resistance, and elevated levels of vWF were a particularly potent, independent risk factor in participants with diabetes or insulin resistance, supporting a role in the pathogenesis of atherosclerosis and CVD in these populations. If our findings can be confirmed in other populations, endothelial dysfunction/hemostatic dysfunction might represent a novel therapeutic target for prevention of CVD in people with type 2 diabetes or insulin resistance.
Acknowledgements
The authors thank Izabella Lipinska, PhD, Patrice A. Sutherland, BS, David M. Nathan, MD and Peter Shrader, MS for outstanding technical support.
Funding Sources
The study was supported by Grant-in-Aid from the American Heart Association (92011960) and by the National Heart, Lung and Blood Institute's Framingham Heart Study (Contract No. N01-HC-25195). JBM was supported by a Career Development Award from the American Diabetes Association and by NIDDK K24 DK080140.
Footnotes
Disclosures
None.
References
- 1.Minino AMHM, Smith BL. Preliminary Data for 2004 National Vital Statistics Reports. Hyattsville, MD: National Center for Health Statistics; 2006. [Google Scholar]
- 2.Magnus P, Beaglehole R. The real contribution of the major risk factors to the coronary epidemics: time to end the "only-50%" myth. Arch Intern Med. 2001;161:2657–2660. doi: 10.1001/archinte.161.22.2657. [DOI] [PubMed] [Google Scholar]
- 3.Greenland P, Knoll MD, Stamler J, Neaton JD, Dyer AR, Garside DB, Wilson PW. Major risk factors as antecedents of fatal and nonfatal coronary heart disease events. Jama. 2003;290:891–897. doi: 10.1001/jama.290.7.891. [DOI] [PubMed] [Google Scholar]
- 4.Khot UN, Khot MB, Bajzer CT, Sapp SK, Ohman EM, Brener SJ, Ellis SG, Lincoff AM, Topol EJ. Prevalence of conventional risk factors in patients with coronary heart disease. Jama. 2003;290:898–904. doi: 10.1001/jama.290.7.898. [DOI] [PubMed] [Google Scholar]
- 5.Lerman A, Zeiher AM. Endothelial function: cardiac events. Circulation. 2005;111:363–368. doi: 10.1161/01.CIR.0000153339.27064.14. [DOI] [PubMed] [Google Scholar]
- 6.Ridker PM, Cushman M, Stampfer MJ, Tracy RP, Hennekens CH. Inflammation, aspirin, and the risk of cardiovascular disease in apparently healthy men. N Engl J Med. 1997;336:973–979. doi: 10.1056/NEJM199704033361401. [DOI] [PubMed] [Google Scholar]
- 7.Ridker PM, Rifai N, Rose L, Buring JE, Cook NR. Comparison of C-reactive protein and low-density lipoprotein cholesterol levels in the prediction of first cardiovascular events. N Engl J Med. 2002;347:1557–1565. doi: 10.1056/NEJMoa021993. [DOI] [PubMed] [Google Scholar]
- 8.Danesh J, Collins R, Appleby P, Peto R. Association of fibrinogen, C-reactive protein, albumin, or leukocyte count with coronary heart disease: meta-analyses of prospective studies. Jama. 1998;279:1477–1482. doi: 10.1001/jama.279.18.1477. [DOI] [PubMed] [Google Scholar]
- 9.Ridker PM, Rifai N, Stampfer MJ, Hennekens CH. Plasma concentration of interleukin-6 and the risk of future myocardial infarction among apparently healthy men. Circulation. 2000;101:1767–1772. doi: 10.1161/01.cir.101.15.1767. [DOI] [PubMed] [Google Scholar]
- 10.Meade TW, Mellows S, Brozovic M, Miller GJ, Chakrabarti RR, North WR, Haines AP, Stirling Y, Imeson JD, Thompson SG. Haemostatic function and ischaemic heart disease: principal results of the Northwick Park Heart Study. Lancet. 1986;2:533–537. doi: 10.1016/s0140-6736(86)90111-x. [DOI] [PubMed] [Google Scholar]
- 11.Maresca G, Di BlasioA, Marchioli R, Di Minno G. Measuring plasma fibrinogen to predict stroke and myocardial infarction: an update. Arterioscler Thromb Vasc Biol. 1999;19:1368–1377. doi: 10.1161/01.atv.19.6.1368. [DOI] [PubMed] [Google Scholar]
- 12.Danesh J, Whincup P, Walker M, Lennon L, Thomson A, Appleby P, Rumley A, Lowe GD. Fibrin D-dimer and coronary heart disease: prospective study and meta-analysis. Circulation. 2001;103:2323–2327. doi: 10.1161/01.cir.103.19.2323. [DOI] [PubMed] [Google Scholar]
- 13.Eriksson P, Kallin B, van 't Hooft FM, Bavenholm P, Hamsten A. Allele-specific increase in basal transcription of the plasminogen-activator inhibitor 1 gene is associated with myocardial infarction. Proc Natl Acad Sci U S A. 1995;92:1851–1855. doi: 10.1073/pnas.92.6.1851. [DOI] [PMC free article] [PubMed] [Google Scholar]
- 14.Ridker PM, Hennekens CH, Roitman-Johnson B, Stampfer MJ, Allen J. Plasma concentration of soluble intercellular adhesion molecule 1 and risks of future myocardial infarction in apparently healthy men. Lancet. 1998;351:88–92. doi: 10.1016/S0140-6736(97)09032-6. [DOI] [PubMed] [Google Scholar]
- 15.Blankenberg S, Rupprecht HJ, Bickel C, Peetz D, Hafner G, Tiret L, Meyer J. Circulating cell adhesion molecules and death in patients with coronary artery disease. Circulation. 2001;104:1336–1342. doi: 10.1161/hc3701.095949. [DOI] [PubMed] [Google Scholar]
- 16.Sadler JE. von Willebrand factor. J Biol Chem. 1991;266:22777–22780. [PubMed] [Google Scholar]
- 17.Jager A, van Hinsbergh VW, Kostense PJ, Emeis JJ, Yudkin JS, Nijpels G, Dekker JM, Heine RJ, Bouter LM, Stehouwer CD. von Willebrand factor, C-reactive protein, and 5-year mortality in diabetic and nondiabetic subjects: the Hoorn Study. Arterioscler Thromb Vasc Biol. 1999;19:3071–3078. doi: 10.1161/01.atv.19.12.3071. [DOI] [PubMed] [Google Scholar]
- 18.Lip GY, Pearce LA, Chin BS, Conway DS, Hart RG. Effects of congestive heart failure on plasma von Willebrand factor and soluble P-selectin concentrations in patients with non-valvar atrial fibrillation. Heart. 2005;91:759–763. doi: 10.1136/hrt.2004.036160. [DOI] [PMC free article] [PubMed] [Google Scholar]
- 19.Saito I, Folsom AR, Brancati FL, Duncan BB, Chambless LE, McGovern PG. Nontraditional risk factors for coronary heart disease incidence among persons with diabetes: the Atherosclerosis Risk in Communities (ARIC) Study. Ann Intern Med. 2000;133:81–91. doi: 10.7326/0003-4819-133-2-200007180-00007. [DOI] [PubMed] [Google Scholar]
- 20.Whincup PH, Danesh J, Walker M, Lennon L, Thomson A, Appleby P, Rumley A, Lowe GD. von Willebrand factor and coronary heart disease: prospective study and meta-analysis. Eur Heart J. 2002;23:1764–1770. doi: 10.1053/euhj.2001.3237. [DOI] [PubMed] [Google Scholar]
- 21.Morange PE, Simon C, Alessi MC, Luc G, Arveiler D, Ferrieres J, Amouyel P, Evans A, Ducimetiere P, Juhan-Vague I. Endothelial cell markers and the risk of coronary heart disease: the Prospective Epidemiological Study of Myocardial Infarction (PRIME) study. Circulation. 2004;109:1343–1348. doi: 10.1161/01.CIR.0000120705.55512.EC. [DOI] [PubMed] [Google Scholar]
- 22.Bongers TN, de Maat MP, van Goor ML, Bhagwanbali V, van Vliet HH, Gomez Garcia EB, Dippel DW, Leebeek FW. High von Willebrand factor levels increase the risk of first ischemic stroke: influence of ADAMTS13, inflammation, and genetic variability. Stroke. 2006;37:2672–2677. doi: 10.1161/01.STR.0000244767.39962.f7. [DOI] [PubMed] [Google Scholar]
- 23.Tzoulaki I, Murray GD, Lee AJ, Rumley A, Lowe GD, Fowkes FG. Relative value of inflammatory, hemostatic, and rheological factors for incident myocardial infarction and stroke: the Edinburgh Artery Study. Circulation. 2007;115:2119–2127. doi: 10.1161/CIRCULATIONAHA.106.635029. [DOI] [PubMed] [Google Scholar]
- 24.Chion CK, Doggen CJ, Crawley JT, Lane DA, Rosendaal FR. ADAMTS13 and von Willebrand factor and the risk of myocardial infarction in men. Blood. 2007;109:1998–2000. doi: 10.1182/blood-2006-07-038166. [DOI] [PubMed] [Google Scholar]
- 25.Meade TW, Cooper JA, Stirling Y, Howarth DJ, Ruddock V, Miller GJ. Factor VIII, ABO blood group and the incidence of ischaemic heart disease. Br J Haematol. 1994;88:601–607. doi: 10.1111/j.1365-2141.1994.tb05079.x. [DOI] [PubMed] [Google Scholar]
- 26.Rumley A, Lowe GD, Sweetnam PM, Yarnell JW, Ford RP. Factor VIII, von Willebrand factor and the risk of major ischaemic heart disease in the Caerphilly Heart Study. Br J Haematol. 1999;105:110–116. [PubMed] [Google Scholar]
- 27.Smith FB, Lee AJ, Fowkes FG, Price JF, Rumley A, Lowe GD. Hemostatic factors as predictors of ischemic heart disease and stroke in the Edinburgh Artery Study. Arterioscler Thromb Vasc Biol. 1997;17:3321–3325. doi: 10.1161/01.atv.17.11.3321. [DOI] [PubMed] [Google Scholar]
- 28.Smith A, Patterson C, Yarnell J, Rumley A, Ben-Shlomo Y, Lowe G. Which hemostatic markers add to the predictive value of conventional risk factors for coronary heart disease and ischemic stroke? The Caerphilly Study. Circulation. 2005;112:3080–3087. doi: 10.1161/CIRCULATIONAHA.105.557132. [DOI] [PubMed] [Google Scholar]
- 29.Tzoulaki I, Murray GD, Price JF, Smith FB, Lee AJ, Rumley A, Lowe GD, Fowkes FG. Hemostatic factors, inflammatory markers, and progressive peripheral atherosclerosis: the Edinburgh Artery Study. Am J Epidemiol. 2006;163:334–341. doi: 10.1093/aje/kwj051. [DOI] [PubMed] [Google Scholar]
- 30.Tzoulaki I, Murray GD, Lee AJ, Rumley A, Lowe GD, Fowkes FG. Inflammatory, haemostatic, and rheological markers for incident peripheral arterial disease: Edinburgh Artery Study. Eur Heart J. 2007;28:354–362. doi: 10.1093/eurheartj/ehl441. [DOI] [PubMed] [Google Scholar]
- 31.Meigs JB, O'Donnell CJ, Tofler GH, Benjamin EJ, Fox CS, Lipinska I, Nathan DM, Sullivan LM, D'Agostino RB, Wilson PW. Hemostatic markers of endothelial dysfunction and risk of incident type 2 diabetes: the Framingham Offspring Study. Diabetes. 2006;55:530–537. doi: 10.2337/diabetes.55.02.06.db05-1041. [DOI] [PubMed] [Google Scholar]
- 32.Ostergard T, Nyholm B, Hansen TK, Rasmussen LM, Ingerslev J, Sorensen KE, Botker HE, Saltin B, Schmitz O. Endothelial function and biochemical vascular markers in first-degree relatives of type 2 diabetic patients: the effect of exercise training. Metabolism. 2006;55:1508–1515. doi: 10.1016/j.metabol.2006.06.024. [DOI] [PubMed] [Google Scholar]
- 33.Natali A, Toschi E, Baldeweg S, Ciociaro D, Favilla S, Sacca L, Ferrannini E. Clustering of insulin resistance with vascular dysfunction and low-grade inflammation in type 2 diabetes. Diabetes. 2006;55:1133–1140. doi: 10.2337/diabetes.55.04.06.db05-1076. [DOI] [PubMed] [Google Scholar]
- 34.Almdal T, Scharling H, Jensen JS, Vestergaard H. The independent effect of type 2 diabetes mellitus on ischemic heart disease, stroke, and death: a population-based study of 13,000 men and women with 20 years of follow-up. Arch Intern Med. 2004;164:1422–1426. doi: 10.1001/archinte.164.13.1422. [DOI] [PubMed] [Google Scholar]
- 35.Natali A, Baldeweg S, Toschi E, Capaldo B, Barbaro D, Gastaldelli A, Yudkin JS, Ferrannini E. Vascular effects of improving metabolic control with metformin or rosiglitazone in type 2 diabetes. Diabetes Care. 2004;27:1349–1357. doi: 10.2337/diacare.27.6.1349. [DOI] [PubMed] [Google Scholar]
- 36.Kannel WB, Feinleib M, McNamara PM, Garrison RJ, Castelli WP. An investigation of coronary heart disease in families. The Framingham offspring study. Am J Epidemiol. 1979;110:281–290. doi: 10.1093/oxfordjournals.aje.a112813. [DOI] [PubMed] [Google Scholar]
- 37.Meigs JB, Nathan DM, Wilson PW, Cupples LA, Singer DE. Metabolic risk factors worsen continuously across the spectrum of nondiabetic glucose tolerance. The Framingham Offspring Study. Ann Intern Med. 1998;128:524–533. doi: 10.7326/0003-4819-128-7-199804010-00002. [DOI] [PubMed] [Google Scholar]
- 38.Diagnosis and classification of diabetes mellitus. Diabetes Care. 2007;30 Suppl 1:S42–S47. doi: 10.2337/dc07-S042. [DOI] [PubMed] [Google Scholar]
- 39.Keaney JF, Jr, Larson MG, Vasan RS, Wilson PW, Lipinska I, Corey D, Massaro JM, Sutherland P, Vita JA, Benjamin EJ. Obesity and systemic oxidative stress: clinical correlates of oxidative stress in the Framingham Study. Arterioscler Thromb Vasc Biol. 2003;23:434–439. doi: 10.1161/01.ATV.0000058402.34138.11. [DOI] [PubMed] [Google Scholar]
- 40.Meigs JB, Mittleman MA, Nathan DM, Tofler GH, Singer DE, Murphy-Sheehy PM, Lipinska I, D'Agostino RB, Wilson PW. Hyperinsulinemia, hyperglycemia, and impaired hemostasis: the Framingham Offspring Study. Jama. 2000;283:221–228. doi: 10.1001/jama.283.2.221. [DOI] [PubMed] [Google Scholar]
- 41.Matthews DR, Hosker JP, Rudenski AS, Naylor BA, Treacher DF, Turner RC. Homeostasis model assessment: insulin resistance and beta-cell function from fasting plasma glucose and insulin concentrations in man. Diabetologia. 1985;28:412–419. doi: 10.1007/BF00280883. [DOI] [PubMed] [Google Scholar]
- 42.Balkau B, Charles MA. Comment on the provisional report from the WHO consultation. European Group for the Study of Insulin Resistance (EGIR) Diabet Med. 1999;16:442–443. doi: 10.1046/j.1464-5491.1999.00059.x. [DOI] [PubMed] [Google Scholar]
- 43.Penny WF, Weinstein M, Salzman EW, Ware JA. Correlation of circulating von Willebrand factor levels with cardiovascular hemodynamics. Circulation. 1991;83:1630–1636. doi: 10.1161/01.cir.83.5.1630. [DOI] [PubMed] [Google Scholar]
- 44.Kannel WB, Wolf PA, Garrison RJ. The Framingham Study: an epidemiological investigation of cardiovascular disease. Section 34. Some risk factors related to the annual incidence of cardiovascular disease and death using pooled repeated biennial measurements: Framingham Heart Study, 30-year-follow-up. National Heart, Lung, and Blood Institute. 1987 [Google Scholar]
- 45.Selvin S. Statistical Analysis of Epidemiologic Data. New York: Oxford University Press; 1991. [Google Scholar]
- 46.Mannucci PM. von Willebrand factor: a marker of endothelial damage? Arterioscler Thromb Vasc Biol. 1998;18:1359–1362. doi: 10.1161/01.atv.18.9.1359. [DOI] [PubMed] [Google Scholar]
- 47.Lip GY, Blann A. von Willebrand factor: a marker of endothelial dysfunction in vascular disorders? Cardiovasc Res. 1997;34:255–265. doi: 10.1016/s0008-6363(97)00039-4. [DOI] [PubMed] [Google Scholar]
- 48.Bonetti PO, Lerman LO, Lerman A. Endothelial dysfunction: a marker of atherosclerotic risk. Arterioscler Thromb Vasc Biol. 2003;23:168–175. doi: 10.1161/01.atv.0000051384.43104.fc. [DOI] [PubMed] [Google Scholar]
- 49.MacFadyen RJ. Intraindividual temporal variance of biomarkers and the definition of individualized prognosis in cardiovascular patients. J Hum Hypertens. 2006;20:383–386. doi: 10.1038/sj.jhh.1002008. [DOI] [PubMed] [Google Scholar]