Abstract
Objective
We previously demonstrated a silencing role for Stat3 in γ-globin gene regulation in primary erythroid cells. Recently GATA-1, a key transcription factor involved in hematopoietic cell development was shown to directly inhibit the activity of Stat3 in vivo. Therefore we completed studies to determine if interactions between these two factors influence γ-globin gene expression.
Methods
Chromatin immunoprecipitation (ChIP) assay was used to ascertain in vivo protein binding at the γ-globin 5’untranslated region (5’UTR); protein-protein interactions were examined by co-immunoprecipitation analysis. In vitro protein-DNA binding were completed using surface plasmon resonance and electrophoretic mobility shift assay (EMSA). Activity of a luciferase γ-globin promoter reporter, and levels of γ-globin mRNA and fetal hemoglobin in stable K562 cell lines over-expressing Stat3 and GATA-1 were used to determine the influence of the Stat3/GATA-1 interaction on γ-globin gene expression.
Results
We observed interaction between Stat3 and GATA-1 in K562 and mouse erythroleukemia cells in vivo at the γ-globin 5’UTR by ChIP assay. EMSA performed with a 41 base pair DNA probe (γ41) demonstrated the presence of Stat3 and GATA-1 proteins in complexes assembled at the γ-globin 5’UTR. A consensus Stat3 binding DNA probe inhibited GATA-1 binding in a concentration-dependent manner, and the converse was also true. Enforced Stat3 expression augmented its binding at the γ-globin 5’UTR in vivo and silenced γ-promoter driven luciferase activity. Stable enforced Stat3 expression in K562 cells reduced endogenous γ-globin mRNA level. This effect was reversed by GATA-1.
Conclusion
These data provide evidence that GATA-1 can reverse Stat3-mediated γ-globin gene silencing in erythroid cells.
Keywords: γ-globin, Stat3, GATA-1, fetal hemoglobin, Interleukin-6
INTRODUCTION
The human β-like globin genes are sequentially expressed during development to produce the γ- to β-globin switch involving a reciprocal decrease in hemoglobin F (HbF) and increase in adult hemoglobin A (HbA) synthesis [1]. Mutations in β-globin produce major hemoglobinopathies such as sickle cell disease and β-thalassemia. Increased HbF synthesis ameliorates the clinical severity of both disorders which provides a rationale for pharmacological reactivation of γ-globin expression after birth [2–4].
Modules involved in regulating the β-like globin genes include promoter consensus binding sites and the locus control region (LCR), critical for high-level globin gene expression [5]. The transcription factor GATA-1 [6,7] and several others including Stat3 [8], CCAAT displacement protein [9], fetal kruppel like factors [10,11], CP2, NF-E4 [12], and the DRED complex [13] have been implicated in γ-globin gene regulation. GATA-1 and Stat3 function both as trans-activators and repressors of gene expression [14–18] suggesting that γ-globin gene silencing may involve interaction between these proteins.
We previously demonstrated the ability of Stat3 to silence γ-globin gene expression after interleukin-6 (IL-6) treatment [8]. IL-6 binds its cognate receptor gp130 [19,20] to trigger Janus kinase 2 activation [21]; subsequently, Stat3 is phosphorylated, undergoes dimerization and translocates to the nucleus [22]. Stat3 partners include Stat1 [23], caveolin-1, clathrin, adaptins and chaperone proteins [24]. Human CD34+ cells express gp130 however the soluble IL-6 receptor is required to sensitize progenitors to the effects of IL-6 [25] and mediates Stat3 activation [26] to stimulate cell expansion during erythropoiesis [27,28]. A recent study demonstrated that Stat3 function is altered by GATA-1 through protein-protein interactions in murine hematopoietic cells [17]. Structure-function analysis showed direct binding of the GATA-1 N-zinc finger to the DNA binding domain of Stat3 to impede gp130-dependent cell signaling. These findings support an emerging paradigm that GATA-1 antagonizes Stat3 activity.
We performed studies to determine if interactions between Stat3 and GATA-1 play a role in γ-globin expression. Protein-protein interactions between the two factors and in vivo binding for Stat3 and GATA-1 in the γ-globin 5’UTR was confirmed in K562 cells. Enforced Stat3 expression silenced γ-globin promoter activity in a luciferase reporter system which was reversed by increased GATA-1 levels. Stat3 over-expression in K562 stable lines decreased γ-globin mRNA levels and HbF synthesis which was reversed by GATA-1. We propose a mechanism whereby GATA-1 reverses the negative regulatory effect of Stat3 on γ-globin gene expression.
MATERIALS AND METHOD
Tissue Culture and Reagents
K562 cells were cultured in Iscove's Modified Dulbecco's Medium containing 10% fetal bovine serum, penicillin (100 units/ml), and streptomycin (0.1 mg/ml). K562 cells were grown in the presence of IL-6 (100 ng/ml), butyrate (2 mM) or hemin (50 µM) for 48 hrs.
Western Blot
K562 cells from the various conditions were mixed with lysis buffer (Promega, Madison, WI) to isolate total protein. Fifty to 100 µg of protein was resolved on a 12% SDS-PAGE gel, transferred to a nitrocellulose membrane and hybridized with 1:250–500 dilution of pStat3 (sc-8059) or GATA-1 (sc-13053) antibody (Santa Cruz Biotechnology, Santa Cruz, CA). After incubation with secondary antibody (1:5000) bands were detected using the ECL system (Amersham Piscataway, NJ); membranes were stripped and probed with actin (Chemicon, Temecula, CA) or total Stat3 (sc-8019; Santa Cruz Biotechnology) antibody as loading controls. For immunoprecipitation (IP) reactions protein was pre-cleared with protein A agarose, treated with GATA-1 antibody, and then complexes were precipitated with pStat3 antibody followed by western blot analysis. The reverse studies with Stat3 IP and GATA-1 western blot were completed as well.
Reporter Constructs and Expression Plasmids
The reporter construct −201γLuc containing the γ-globin promoter from −201 to +36 relative to the cap site, cloned upstream of the luciferase gene in the pGL3-Basic plasmid (Promega) was used for enforced expression studies. A mutant reporter −201γLuc(m) carrying the TATC to GGCG substitution at base +26 to +29 was tested as well. The pZeoSV-LacZ (Invitrogen, Carlsbad, CA) and pEGFP-N1 (Clontech, Palo Alto, CA) plasmids were used to produce the Stat3 and GATA-1 expression vectors respectively. The cDNA for each gene was generated by PCR with primers shown in Table 1. For subcloning, the Stat3 primers contained ScaI and AgeI sites and the GATA-1 primers contained XhoI and SalI restriction sites. The inserts were confirmed by direct sequencing.
Table 1.
Summary of primers used for the various analyses performed.
| ChIP Analysis | |
| γ-globin 5’UTR | Forward: 5’-CGGCGGCTGGCTAGGGATGAA-3’ |
| Reverse: 5’-CTGTGAAATGACCCATGGCG-3’ | |
| qPCR Analysis | |
| GAPD | Forward: 5’-GAAGGTGAAGGTCGGAGT-3’ |
| Reverse: 5’-GAAGATGGTGATGGGATTTC-3’ | |
| γ-globin | Forward: 5’-GGCAACCTGTCCTCTGCCTC-3’ |
| Reverse: 5’-GAAATGGATTGCCAAAACGG-3’ | |
| Gene Copy Number | |
| GATA1 | Forward: 5’-AGCCCCTCCCCCAGTTTGTG-3’ |
| Reverse: 5’-GCTCGGGGCAGTGGAGGAAG-3’ | |
| Stat3 | Forward: 5’-TTGTGCTGATAGAGAACATTCGAC-3’ |
| Reverse: 5’-ATATGCGGCCAGCAAAGAATC-3’ | |
| GAPD | Forward: 5’-GAAGGTGAAGGTCGGAGT-3’ |
| Reverse: 5’-GAAGATGGTGATGGGATTTC-3’ | |
ChIP Assay
ChIP assays were performed using a kit purchased from Upstate Biotechnology (Lake Placid, NY) as previously published [29]. Briefly, K562 cells (1×10⁷) were treated with 1% formaldehyde and protease inhibitors. After cell lysis, approximately 800 bp DNA fragments were generated using the Misonix Sonicator 3000 (Farmingdale, NY). Chromatin was pre-cleared with protein A agarose and then IP was completed with pStat3, GATA-1, pStat1 (sc-8394), pStat5 (sc-11761), TFIID (sc-204X), and histone deacetylase 1 (sc-7872) antibodies purchased from Santa Cruz Biotechnology, Inc.; IgG antibody was purchased from Sigma (St Louis, MO). For enforced expression studies, 15µg of pZeoStat3 or pEGFP-GATA-1 vector was electroporated into K562 cells for 24 hrs and then ChIP assays were completed.
Quantitative PCR (qPCR) Analysis
Reverse transcription combined with qPCR analysis was used to measure γ-globin and glyceraldehyde-3-phosphate dehydrogenase (GAPD) gene expression levels as previously published [29]. cDNA was generated from total RNA (1 µg) using the Improm-II reverse transcriptase system (Promega, Madison, WI). qPCR reactions were performed using the iQ SyberSupermix (BioRad, Hercules, CA) and gene-specific primers (Table 1). Input DNA in the range of 0.5 to 500 ng was used to generate standard curves.
Surface Plasmon Resonance (SPR)
K562 cell nuclear extract [30] and recombinant Stat3 protein (a gift from Dr. Richard Jove, City of Hope, Comprehensive Cancer Center, Duarte, CA) were tested for DNA-protein interactions using a BIAcore 2000 system (Piscataway, New Jersey). Various γ-globin oligonucleotide probes were immobilized on detection surfaces and perfused with protein dissolved in 10 mM Hepes-NaOH, pH 7.4, 150 mM NaCl, 3.4 mM EDTA, 0.005% P20, at a flow rate of 3 ml/min. Sensor surfaces were regenerated between binding experiments with buffer containing 10 mM Hepes-KOH, pH 10.8 50mM KH2PO4 and 1 M NaCl. The SPR data was generated in resonance units (RU) that correlate with the concentration of molecules on the surface layer [31]. Two SPR probes, +9Sγ (+11 to +18) and +26Sγ (+23 to +37) were synthesized with a 5’-biotin label (Fisher Scientific, Waltham, MA). Equivalent amounts of each probe (500 RU ± 10) were captured on sensor surfaces pre-immobilized with streptavidin. One flow cell without bound probe was used as a reference control for bulk refractive index differences in the injected samples. The +9γ and +26γ probes were analyzed with recombinant Stat3 protein or K562 nuclear proteins at 1:5 to 1:40 dilutions in the presence of 4 µg/ml of poly (dI:dC). RUs were recorded for 5 min and binding curves were documented in triplicate as previously published [32].
Electrophoretic Mobility Shift Assay (EMSA)
K562 extract was analyzed with the γ41 probe from +1 to +41 relative to the γ-globin cap site; the mutant γ41 probe (+26γ41m) contains the TATC to GGCG base changes at position +26. The wild-type γS3 (+1 to +22) and γS3/G (+20 to +41) probes were used to test DNA-protein interactions at each element independently. Control Stat3 (sc-2571) and GATA-1 (sc-2531) consensus probes were purchased from Santa Cruz Biotechnology. All probes were labeled with [γ-32P]ATP and purified using a G-50 column (Amersham, Piscataway, NJ). For super shift experiments probes (30,000 cpm) were incubated with 5 µg of nuclear proteins and 2 µg of target antibody. Competitive binding reactions were performed using Stat3 consensus oligo at 50- and 100-fold excess of GATA-1 probe and vice versa.
Transient Transfections
K562 cells (1×10⁷) were transfected with 10 µg of reporter plasmid and 3 µg of β-galactosidase plasmid (Promega) to monitor transfection efficiency. For co-transfection studies 15 µg of pZeoStat3 or pEGFP-GATA-1 expression vector was electroporated at 260 V and 975 µF (Gene Pulser II, BioRad) with the reporter plasmid. The corresponding empty vectors pZeoSV-LacZ and pEGFP-N1 were tested as controls. Cells were harvested at 24 hrs in luciferase lysis buffer (Promega) and luciferase activity determined on a Turner Designs luminometer TD-20/20. β-Galactosidase activity was measured per the manufacturer’s protocol (Calbiochem, La Jolla, CA). Luciferase activity was reported after subtracting the activity of empty vectors and normalization to β-galactosidase activity and total protein.
Stable Lines
Linearized pZeoStat3 or pEGFP-GATA-1 vector (10 µg) was electroporated into 107 K562 cells; after three days 50 µg/ml Zeocin (Invitrogen) or 500 µg/ml G418 (Sigma) was added for 21 days and then single cell clones were obtained by serial dilutions. Stat3 and GATA-1 enforced expression was confirmed by western blotting.
Expression vector copy number was calculated using a qPCR method [33]. Genomic DNA was isolated using FlexiGene DNA kit (Qiagen) and used to generate standard curves. The copy number of the transfected genes (pZeoStat3 and pEGFP-GATA-1) and GAPD was measured in stable clones and wild-type K562 cells. The primers used for gene quantification are shown in Table 1. The relative copy number (Q) of target gene versus the GAPD gene was calculated using the following equation:
Where Ns is the ratio of target gene divided by the GAPD copy number in stable clones and Nk is the analogous calculation for K562 cells. NsT is the copy number of target gene in stable cell clones and NkT the copy number of the target gene in K562 cells. Finally NsG and NkG represent the copy number of GAPD in stable cell clones and K562 cells respectively.
Fetal Hemoglobin Levels by Enzyme Linked Immunoassay (ELISA)
Total hemoglobin was quantified using 20 µl of protein extract from treated K562 cells mixed with 5 ml of Drabkin’s reagent (Sigma, St. Louis, MO) and then cyanmethemoglobin was measured at 540nm. HbF levels were measured using the Human Hemoglobin F ELISA Quantitation Kit (Bethyl Laboratory, Montgomery, TX). Briefly, 96-well plates were coated with sheep anti-human HbF antibody (1mg/ml) and then after blocking with 1% bovine serum albumin. After incubation of protein for one hour horse radish peroxidase-conjugated secondary antibody (1mg/ml) was added and then tetramethyl benzidine substrate was read at 450 nm. Raw data were analyzed using GraphPad PRISM (GraphPad Software, Inc., La Jolla, CA) and normalized by total protein and hemoglobin levels.
Statistical Analysis
Each experiment was repeated three to five times independently, and data are shown as the mean ± standard error of the mean (SEM). The student's t-test was used to determine the statistical significance at p<0.05.
RESULTS
Stat3 and GATA-1 undergo protein-protein interactions and bind the γ-globin 5’UTR in vivo
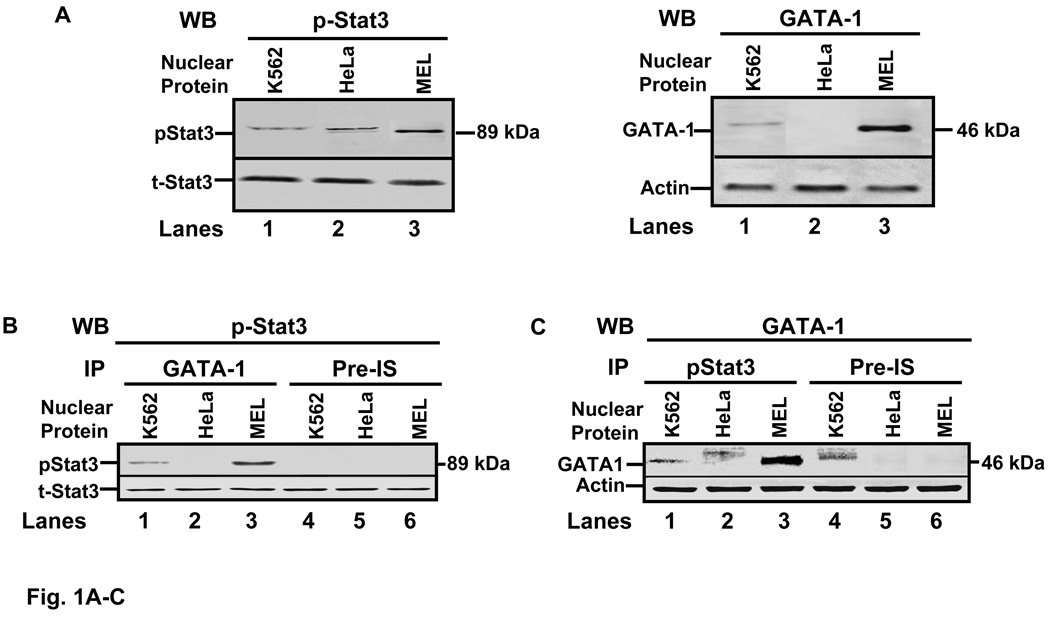
We first performed studies to determine if GATA-1 physically interacts with Stat3 in human erythroid cells. Nuclear protein was IP with p-Stat3 or GATA-1 antibodies and then screened by western blot. At baseline GATA-1 was absent in HeLa cells however we confirmed ubiquitous Stat3 protein synthesis (Fig. 1A). When nuclear protein was IP with GATA-1 antibody followed by Stat3 western blot (Fig. 1B), an 89 kDa band was identified with K562 and MEL cell extracts only. Similar studies were performed with pStat3 immune complexes where a 46 kDa band was observed with GATA-1 antibody in erythroid cells (Fig. 1C). Another band was observed with HeLa extract believed to represent non-specific binding since a similar band was produced with pre-immune serum. These findings demonstrated co-immunoprecipitation of pStat3 and GATA-1 in K562 and MEL cells similar to that observed in murine Ba/F3 cells [17].
Fig. 1. Protein-protein interaction occurs between GATA-1 and Stat3.
A) Western blot (WB) analysis was performed to determine pStat3 and GATA-1 protein levels (see materials and methods). Phosphorylated Stat3 (pStat3) antibody (left blot) and the nuclear proteins shown were used to demonstrate the presence of an 89kDa band in K562, HeLA and mouse erythroleukemia (MEL) cells. Membranes were stripped and probed with total Stat3 (t-Stat3) antibody as a loading control. WB with GATA-1 antibody (right blot) demonstrated its presence in K562 and MEL cells extracts but not in non-hematopoietic HeLa cells. Actin was used as a loading control. B) Immunoprecipitation (IP) reactions were performed with GATA-1 antibody or pre-immune serum (Pre-IS) followed by WB with pStat3 antibody. C) Nuclear proteins from the indicated cells were immunoprecipitated with pStat3 antibody followed by WB with GATA-1 antibody.
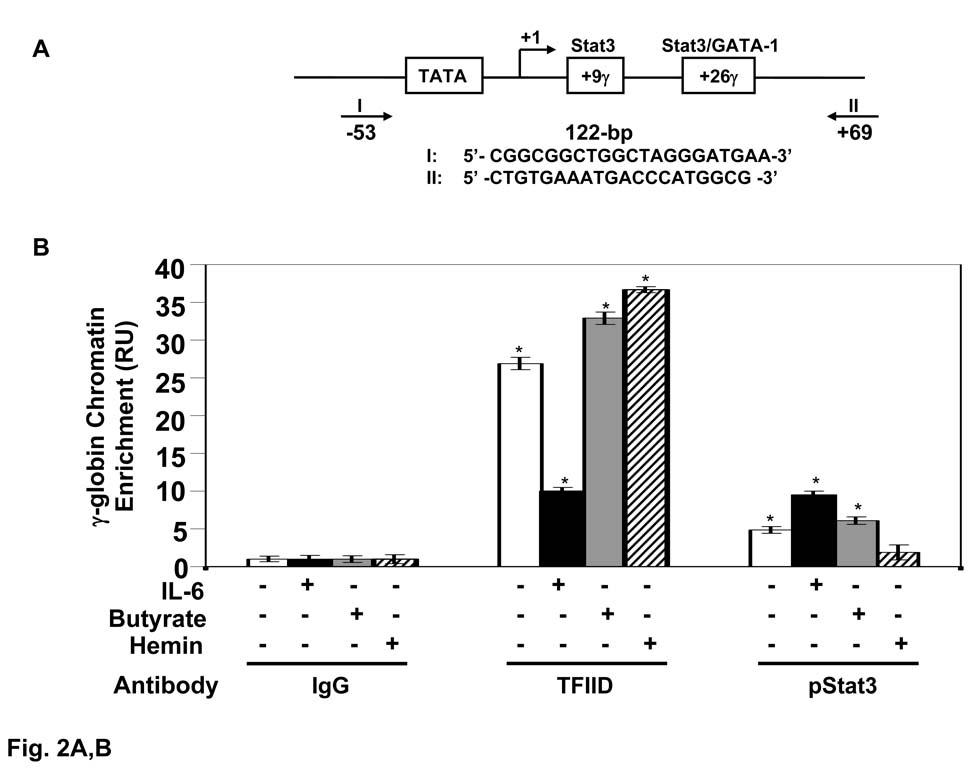
Studies have demonstrated the ability of Stat3 [8,34] and GATA-1 [35,36] to influence γ-globin gene expression independently however whether a combined action occurs has not been investigated. Therefore in vivo binding studies were performed by ChIP assays in the γ-globin 5’UTR to test the consensus Stat3 site at nucleotide +9 and predicted Stat3/GATA-1 site at position +26 (Fig. 2A). To determine the degree of non-specific protein binding, ChIP assay was performed with IgG antibody for the different experimental conditions producing chromatin enrichment in the range of 1.4–1.6 RU (Fig. 2B). Therefore chromatin enrichment for TFIID and Stat3 was compare to levels obtained with IgG. At steady state TFIID was bound 26.9-fold higher than IgG but was decreased 16.9-fold by IL-6. Treatment with butyrate and hemin increased TFIID binding 6.0-fold and 9.8-fold respectively above levels without treatment (Fig. 2B). Similar experiments to analyze in vivo Stat3 binding showed 4.9-fold chromatin enrichment at steady state. IL-6 (50 ng/ml) increased in vivo Stat3 binding 4.6-fold above baseline in contrast to hemin which decreased Stat3 binding 3-fold while butyrate had little effect (Fig. 2B).
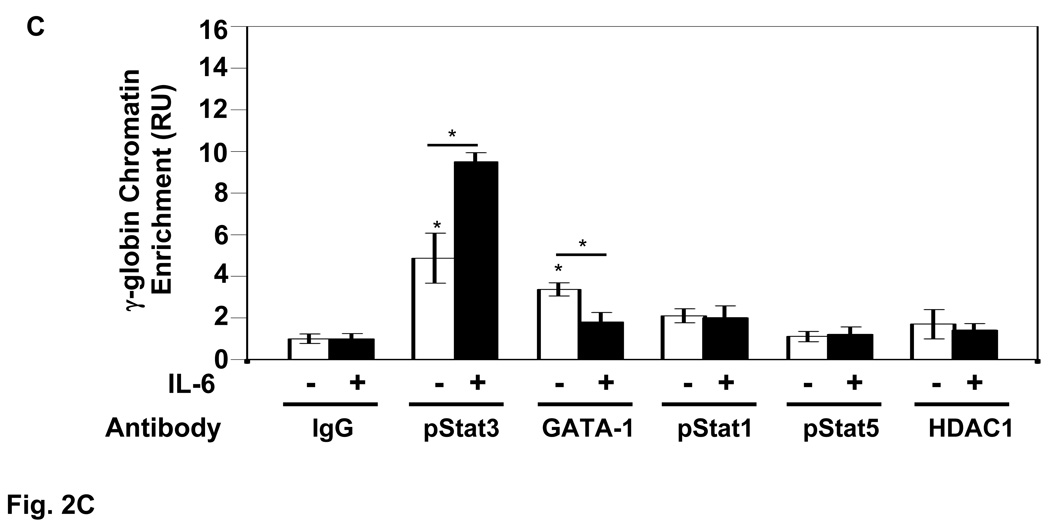
Fig. 2. Interleukin-6 (IL-6) alters in vivo Stat3 and GATA-1 binding in the γ-globin 5’UTR.
A) Shown are the sequence for the γ-globin 5’UTR and position of the primers used for qPCR analysis. B) The levels of γ-globin 5’UTR chromatin enrichment obtained by qPCR analysis of DNA isolated from ChIP assay in the absence (−) or presence (+) of drug treatments with IL-6 (50 ng/ml), butyrate (2 mM) or hemin (50 µM) for 48 hrs is shown (see materials and methods). Immunoprecipitations were performed with IgG, TFIID or pStat3 antibody. The results are expressed as the mean ± standard error of the mean (SEM). The (*) indicate significance at p<0.05 compared to normalized IgG control values. C) The levels of γ-globin chromatin enrichment were quantified in the −/+ of IL-6 treatment for the different antibodies shown. The (*) above the bar graph indicate significance at p<0.05 compared to normalized IgG control values. The line and star above the graphs, −/+ IL-6 indicates a significant difference in protein binding after IL-6 treatment.
Subsequent studies were performed to determine other proteins that interact in the γ-globin gene 5’UTR. GATA-1 immunoprecipitation produced 3.4-fold chromatin enrichment (Fig. 2C) compared to a lack of in vivo binding in this region for pStat1, pStat5, and histone deacetylase 1. Treatment with IL-6 simultaneously decreased GATA-1 binding (1.6-fold) and increased pStat3 binding 4.6-fold above baseline (Fig. 2C). IL-6 treatment had no effect on chromatin binding for Stat1, Stat5 or histone deacetylase 1.
The γ-globin 5’UTR contains high and low affinity Stat3 binding sites
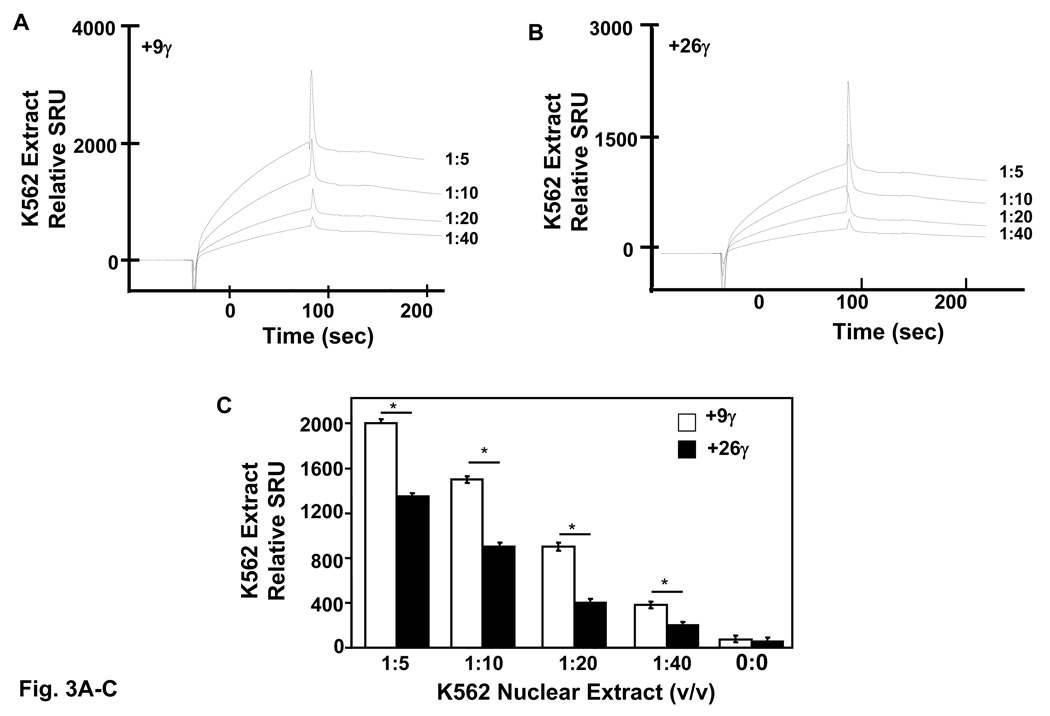
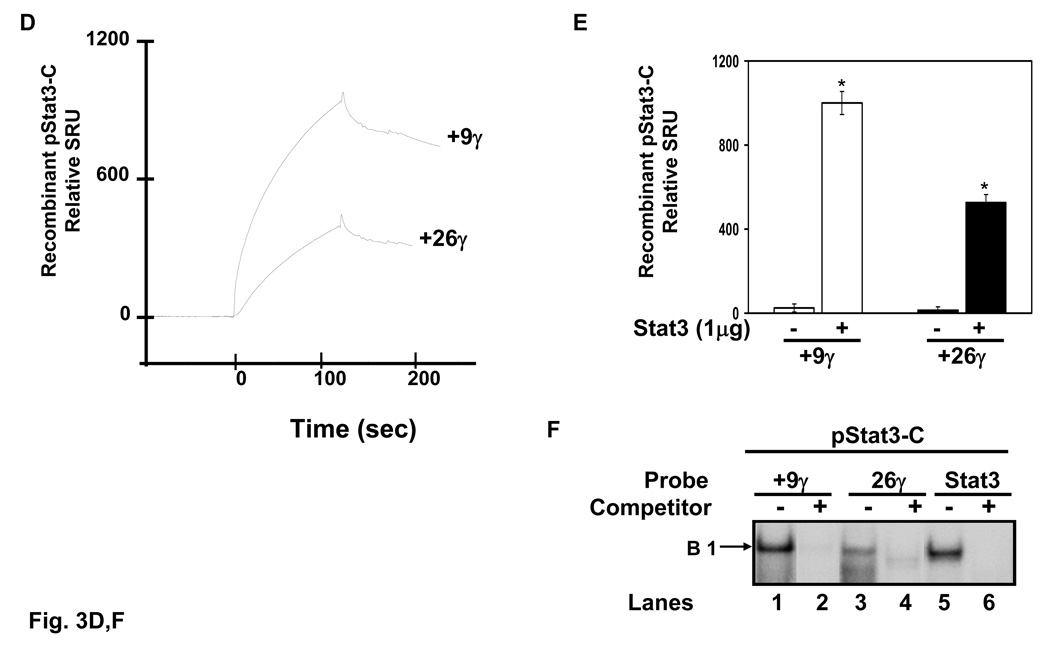
Evidence for Stat3 binding in the γ-globin promoter is limited, thus additional experiments were performed to determine the binding affinities of Stat3 using surface plasmon resonance (SPR) technique. Two SPR γ-globin probes including +9γ (+11 to +18) and +26.γ (+23 to +37) specifically targeted to the Stat3 consensus sites were 5’-biotinylated and immobilized to streptavidin conjugated sensor chips. Active K562 nuclear protein binding was recorded for 5 min in SPR response units (SRU). Control experiments were completed in the absence of nuclear extract to determine nonspecific binding. A correlation between SRU and increasing concentrations of K562 nuclear proteins was observed (Fig. 3A). Binding to the +9γ probe reached a maximum 2,000 SRU at the 1:5 protein dilution which was higher than the maximum binding of 1,350 SRU for the +26γ probe at the same dilution (Fig. 3B). Furthermore, a higher amount of protein binding to the +9γ probe was evident at every concentration (Fig. 3C) however these results were not proof that Stat3 was bound per se. To address this issue, SPR was performed with recombinant activated Stat3 protein. Differential binding of Stat3 to the +9γ and +26γ elements was confirmed (Fig. 3D). Stat3 binding to the +9γ probe reached a maximum 950 SRU, which was over 2-fold higher than levels obtained with the +26γ probe (Fig. 3E). EMSA was completed with recombinant Stat3 protein which produced a prominent complex on the +9γ probe similar to that produced with the Stat3 consensus probe (Fig. 3F). Collectively, these data provide evidence that Stat3 binds a high-affinity +9γ and lower-affinity +26γ site. Purified GATA-1 protein was not available to complete similar studies.
Fig. 3. High and low-affinity Stat3 binding sites exists in the γ-globin 5’UTR.
Quantitative assessment of DNA-protein interactions was performed with two probes, +9γ (+11 to +18) and +26γ (+23 to +37) by SPR analysis (see materials and methods). Biotin-conjugated probes were separately bound to streptavidin-coated sensor chips and treated with K562 nuclear extract or recombinant activated Stat3 protein. The level of protein binding to target consensus sequence was measured in SPR response units (SRU). A) The +9γ probe was analyzed with 1:5 to 1:40 dilutions of K562 nuclear proteins. Note the concentration-dependent increase in RU readout. B) The same studies described in panel A were completed with the +26γ probe. C) Shown in the graph is the quantification for protein bound to the γ-globin probes from panels A and B. Binding studies were performed without nuclear extract (0:0) as a control. The results are expressed as the mean ± SEM. The line above the graphs indicates a significant difference in binding between the two probes at p<0.05. D) A graph showing the relative RU generated by SPR analysis with activated pStat3 (pStat3-C) protein (1 µg). E) Quantitative data collected from the SPR analysis completed in panel D. Binding studies were performed in the presence and absence of recombinant pStat3-C protein. F) EMSA using recombinant Stat3 protein and the γ-globin probes showed the formation of a single DNA-protein complex with +9γ and consensus Stat3 probes in lanes 1 and 5 respectively. Formation of this complex was abolished by cold self oligo competitor (lanes 2 and 6). Similar studies were performed with the +26γ probe which produced a less prominent binding pattern which was competed by cold self oligo (lanes 3 and 4).
Stat3 and GATA-1 bind in the γ-globin 5’UTR in vitro
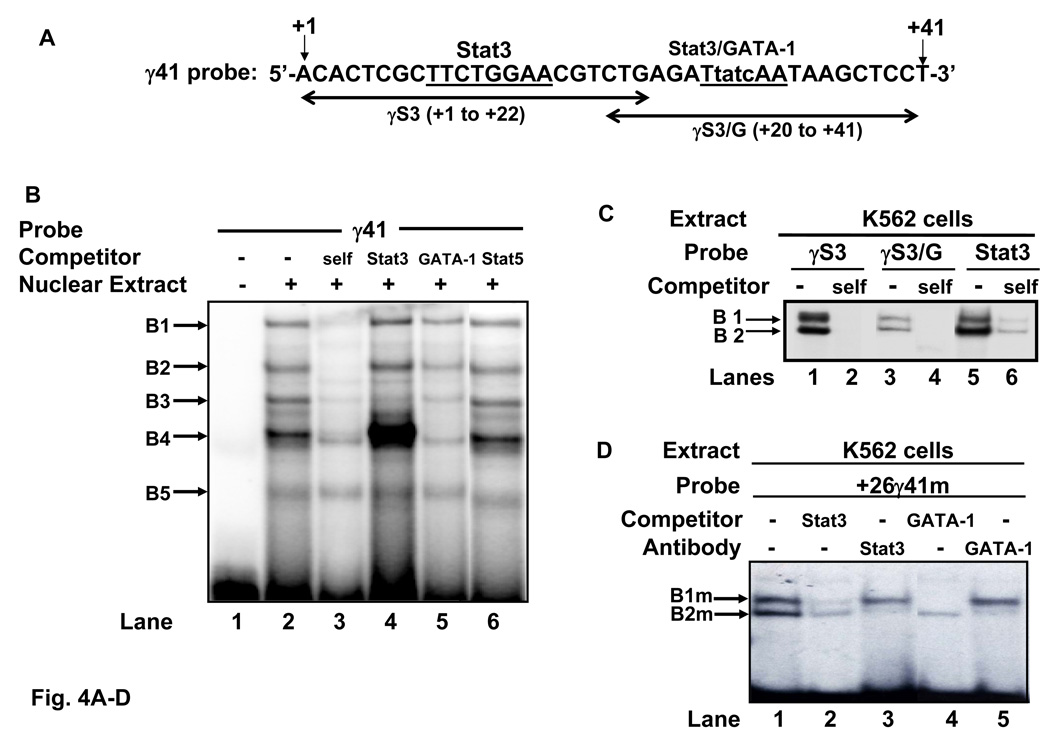
EMSA was performed to dissect the cis-elements in the γ-globin 5’UTR bound by Stat3 and GATA-1, using K562 nuclear extracts and the wild-type γ41 (+1 to +41), γS3 (+1 to +22) and γS3/G (+20 to +41) probes shown in Fig. 4A. A four base pair mutation was engineered in the GATA-1/Stat3 binding site to produce the +26γ41m probe. Five major DNA-protein complexes formed with the γ41 probe and four complexes were competed significantly with self cold probes (Fig. 4B, lanes 2 and 3). Unlabeled Stat3 consensus probe markedly increased the intensity of B4 (lanes 2 and 4) while abolishing the B3 complex. By contrast the B4 DNA-protein complex was decreased by GATA-1 cold competitor (lanes 2 and 5). The EMSA findings for the B4 complex shown in lanes 4 and 5 suggest competitive Stat3 binding to its consensus site may allow increased GATA-1 binding to the γ41 probe.
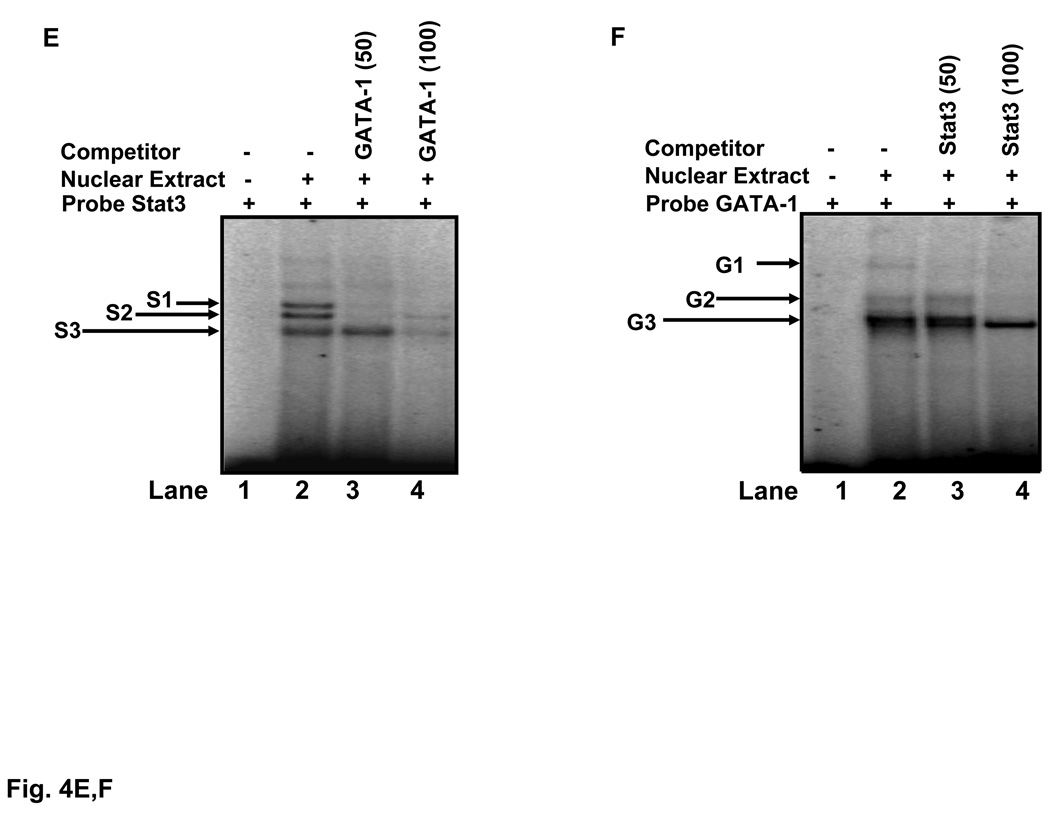
Fig. 4. Stat3 and GATA-1 bind cis-elements in the γ-globin 5’UTR in vitro.
A) The sequence of the γ41 probe extends from nucleotide +1 to +41 relative to the cap site. Also shown are the sequences of the γS3 and γS3/G probes (black arrows). The +9 Stat3 and +26 overlapping GATA-1 (tatc) and Stat3 (TtatcAA) binding sites are underlined. A mutant probe +26γ41m, was created by mutating the bases shown. B) EMSA was performed using K562 cell nuclear proteins (5 µg) and the γ41 probe. Five major DNA-protein complexes (B1-B5) were observed. Cold competition experiments with γ41, Stat3, GATA-1 and Stat5 consensus oligo are shown in lanes 3–6. C) DNA-protein interactions in γS3 and γS3/G probes were also analyzed by EMSA. Two complexes (B1, B2) were observed with both probes (lanes 1 and 3) and a control Stat3 consensus probe (lane 5); both complexes were abolished with self cold competitors. D) EMSA was completed with the +26γm probe in the absence or presence of Stat3 and GATA-1 antibodies. Two DNA-protein complexes were established, labeled B1m and B2m. Experiments with Stat3 or GATA-1 self oligo or the Stat3 and GATA-1 antibody were completed. Note the disappearance of the B2m complex in the presence of both antibodies. E) Radiolabeled Stat3 consensus probe was incubated with 5 µg of K562 nuclear extracts. The Stat3 DNA-protein complexes were competed with increasing concentrations of GATA-1 oligo at 50-fold [GATA-1 (50)] and 100-fold [GATA-1 (100)] molar excess of cold GATA-1 probe. F) EMSA was performed with consensus GATA-1 probe which produced three complexes. Competition studies were completed with 50-fold [Stat3 (50)] and 100-fold [Stat3 (100)] molar excess of cold Stat3 consensus probe.
Amrolia et al. demonstrated that mutations in the interval +24 to +29 enhanced γ-globin gene transcription suggesting the presence of a repressor activity in this region [35]. To ferret out complexes bound to the overlapping Stat3/GATA-1 site at position +26, we tested a mutant γ41 probe (+26γ41m) shown in Fig. 4A. Two specific complexes formed with the γS3 and γS3/G probes (Fig. 4C) similar to that observed with the Stat3 consensus. Interestingly, mutating the GATA-1 site in the +26γ41m probe, produced the B1m and B2m complexes presumably due to Stat3 binding in the +9γ Stat3 element supported by competition and antibody studies (Fig. 4D, lanes 1–3). Both complexes were competed by GATA-1 consensus sequence however GATA-1 antibody abolished only the B2m band (lanes 4 and 5). These data suggest that Stat3 and GATA-1 bind the B2 complex.
A final set of in vitro binding studies determined whether Stat3 and GATA-1 compete for binding to target consensus sites. K562 nuclear extract produce three major bands with Stat3 probe (Fig. 4E, lane 2) which were abolished by increasing molar concentrations of GATA-1 competitor (lanes 3 and 4). In the converse experiments there was lost of GATA-1 binding to its consensus site in the presence of increasing molar excess of Stat3 probe (Fig 4F). These data provide evidence that Stat3 and GATA-1 compete for binding to their cognate binding sites.
Functional antagonism occurs between Stat3 and GATA-1
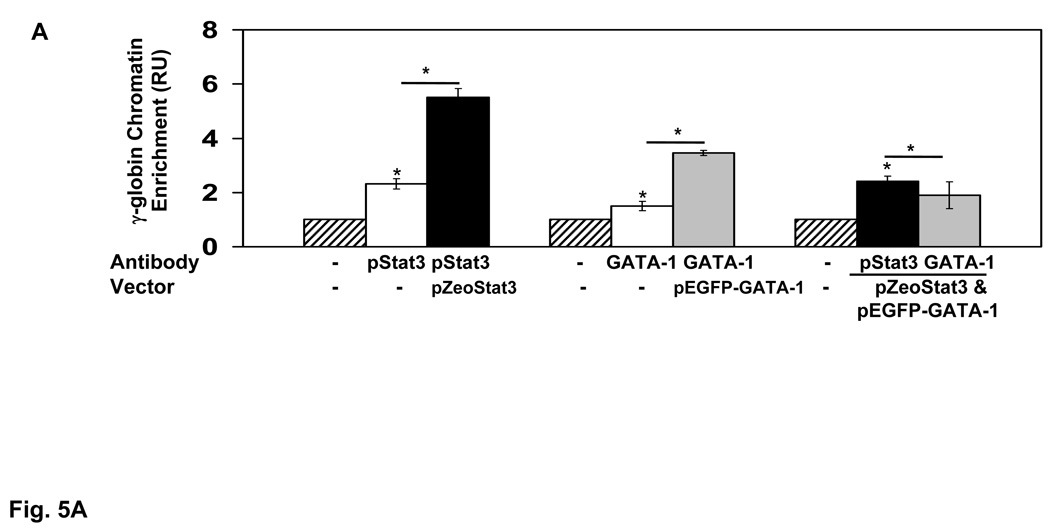
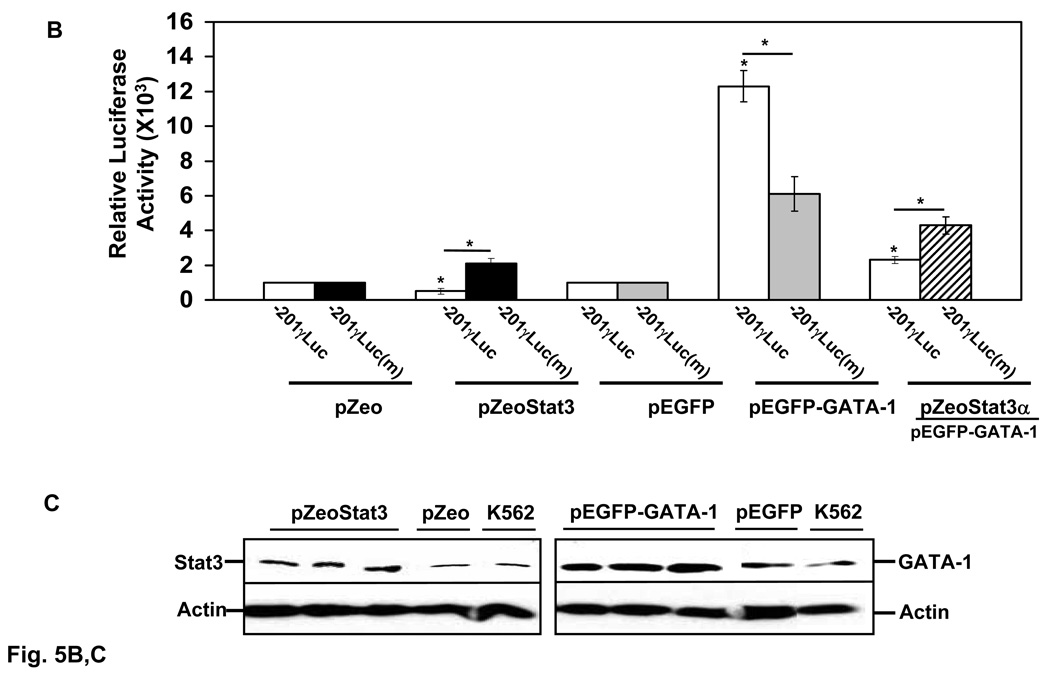
The final studies were aimed at determining if GATA-1 could reverse Stat3-mediated γ-globin silencing to support functional antagonism. We observed 2-fold increased Stat3 and GATA-1 binding in the γ-globin 5’UTR in vivo after enforced pZeoStat3 or pEGFP-GATA-1 expression in K562 cells (Fig. 5A). However, enforced expression of both proteins reduced interaction of each in the target region suggesting competitive binding. To test the functional consequences of this interaction we investigated the −201γLuc wild type or mutant −201γLuc(m) reporters. Enforced pZeoStat3 expression decreased −201γLuc luciferase activity by 50% (Fig. 5B), but the −201γLuc(m) reporter was not repressed by Stat3. Similar studies completed with pEGFP-GATA-1 produced a 12-fold increase in luciferase activity in the wild-type reporter which was reversed for −201γLuc(m) (Fig. 5B). When both factors were over-expressed simultaneously, GATA-1 blocked the ability of Stat3 to silence γ-globin promoter activity (Fig. 5B).
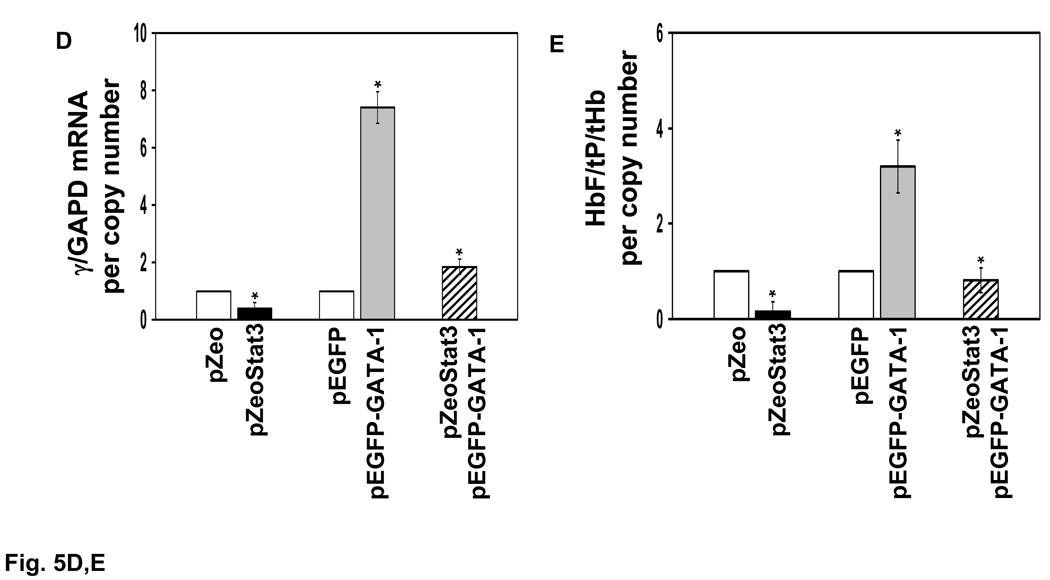
Fig. 5. GATA-1 reverses Stat3-mediated γ-globin silencing in K562 stable clones.
A) The change in Stat3 and GATA-1 binding in vivo in the γ-globin 5’UTR was measured after transient transfection with 15µg of pZeoStat3 or pEGFP-GATA-1 expression vector alone or 15µg of each vector combined. Chromatin enrichment was measured by ChIP assay. The results are expressed as the mean ± SEM. The (*) indicate significance at p<0.05 for chromatin enrichment under the different experimental conditions. The bracket indicates the level of trans-factor binding increased significantly after enforced protein expression. B) Luciferase activity was measured in K562 cells transiently transfected with either the −201γluc or mutant −201γLuc(m) reporter co-transfected with 15 µg of pZeoStat3 or pEGFP-GATA-1 alone or combined (see materials and methods). Luciferase activity was normalized by β-galactosidase and total protein (N=5 independent experiments). C) Using the expression vectors K562 stable clones were established using the zeocin and G418 selectable markers. Enforced expression of Stat3 and GATA-1 was verified by western blotting as shown in the figure; actin was used as an internal control. D) The effect of enforced pZeoStat3 and pEGFP-GATA-1 expression on γ-gene activity was analyzed at the mRNA level by qPCR. Shown are γ-globin mRNA levels normalized by the internal control GAPD and copy number in each stable clone. Levels of mRNA were calculated as a ratio to levels observed in wild-type K562 cells. E) The fold-increase in HbF was measured by ELISA performed with anti-HbF monoclonal antibody (see materials and methods). HbF levels were normalized by total hemoglobin (tHb), total protein (tP) and copy number. Levels of HbF are shown as a ratio to levels observed in wild-type K562 cells.
To further investigate the functional interactions between Stat3 and GATA-1 we established K562 stable clones. Increased Stat3 and GATA-1 expression was verified by western blotting for three independent clones (Fig. 5C). In the pZeoStat3 clones, γ-globin mRNA levels were reduced 60% however, enforced pEGFP-GATA-1 expression increased γ-globin mRNA 7.4-fold (p<0.05) (Fig. 5D). The non-specific effects produced by the empty vector controls pZeo-LacZ and pEGFP-N1 were subtracted from values shown in the graph. Enforced expression of both proteins produced γ-globin mRNA levels higher than those observed in pZeoStat3 clones, suggesting antagonism between the transcription factors (Fig. 5D).
Final studies were completed to correlate changes in the endogenous γ-globin mRNA with HbF levels in stable clones. By ELISA there was a 70% decrease in HbF protein in the pZeoStat3 clones (Fig. 5E) compared to a 2.5-fold increase in pEGFP-GATA-1 clones. When expressed together, GATA-1 reversed Stat3 mediated inhibition of HbF synthesis, a result consistent with in vivo functional antagonism between these factors.
DISCUSSION
This study was designed to elucidate mechanisms for Stat3-medicated γ-globin gene regulation. Previous investigations from our laboratory demonstrated that IL-6 activates Stat3β to silence γ-globin expression. [8]. Subsequently, Kirito et al. demonstrated the ability of Stat3 to inhibit erythropoietin-mediated γ-globin induction in UT-7 human cells [37]. To gain insights into mechanisms of γ-globin regulation by Stat3 we demonstrated interaction between Stat3 and GATA-1 in vitro and in vivo, and their binding collectively to the γ-globin 5’UTR. Furthermore, our ChIP data suggests that IL-6 silences γ-globin transcription through increased Stat3 binding in this region facilitated in part by competition with GATA-1.
Stat3 and GATA-1 act downstream of multiple cytokines with complementary attributes on hematopoiesis. IL-6 stimulates cell expansion and erythropoiesis through Stat3 activation [27,28] although Stat5 is the major target of erythropoietin-mediated signaling during erythroid differentiation [38]. Indeed, Stat5 knock-out mice show a mild anemia which is compensated by Stat1 and Stat3 activation by erythropoietin [39]. Erythropoietin also induces GATA-1 expression to stimulate a program of erythroid gene expression [40] and maturation of erythroid progenitors [41].
GATA-1 has multiple protein partners including Stat3, Stat5, FOG-1, TAL-1, and Gfi-1b among others [17,42,43]. GATA-1 was first identified as a trans-activator [42], however its ability to mediate gene repression can be achieved through different DNA binding sequences such as palindromic GATA-1 motifs and double GATA sites [44,45]. GATA-1 repressor activity has been implicated in naturally occurring mutations in the γ-globin genes associated with persistent HbF synthesis after birth. These include point mutations at base −175 (T→C) and −173 (T→C) of the γ-globin promoter which reduces GATA-1 binding and produces elevated HbF levels in humans and transgenic mice respectively [46]. Likewise, the −567 and −566 GATA-1 sites in the Gγ- and Aγ-globin promoter respectively have been associated with gene silencing [47,48]. Amrolia et al. defined a repressor element in the γ-globin 5’-UTR, which was bound by a complex of two proteins, identified as GATA-1 and a ubiquitous negative regulator [35].
Data generated in our study strongly suggest that Stat3 binds the γ-globin 5’UTR to silence γ-globin transcription while GATA-1 binds the same region to enhance γ-promoter activity. Collectively, these data suggest a model whereby GATA-1 acts as either a direct repressor or interacts with factors that bind nearby canonical sites to silence gene expression as proposed by Amrolia and coworkers [35]. These findings provided a rationale for investigating the functional relevance of Stat3/GATA-1 interactions in γ-globin gene silencing by Stat3.
We generated data demonstrating that GATA-1 is recruited to the proximal γ-globin promoter similar to findings from a previous study [49]. Moreover we discovered that Stat3 is recruited to the same region, where it interacts with GATA-1 at the γ-globin 5’UTR. While this finding is novel, Ezoe and coworkers were the first to demonstrate physical interaction between Stat3 and GATA-1 mediated by the N-terminal GATA-1 zinc finger and the DNA-binding domain of Stat3. Our data shows that the functional outcome of this interaction is attenuation of the transcriptional effect each factor exerts on the γ-globin gene. This attenuation is evident in vitro and in vivo, and is consistent with alterations in DNA binding. To the best of our knowledge the 43 kDa PU.1 transcription factor is the only known factor to inhibit GATA-1 function by blocking DNA binding [50,51]. This is accomplished by PU.1 binding to the C-finger of GATA-1, the domain also likely to bind to the γ-globin 5’UTR sequence given its inverted GATA core motif.
To elucidate molecular mechanisms for Stat3/GATA-1 interaction in the γ-globin 5’UTR, we mapped high and low affinity Stat3 elements at the +9γ and +26γ probes by SPR with recombinant Stat3 protein. At +26 in γ-globin 5’UTR is an overlapping consensus Stat3 (TTATCAA) and tandem inverted GATA-1 (GATTATC) site. The DNA binding domain of Stat3 resides between amino acids 400–500 and in vivo Stat3 binding is blocked by interaction with the GATA-1 N-finger [17]. GATA-1 contains a C-terminal zinc finger, which is both necessary and sufficient for independent DNA binding to the GATA motif (A/T)GATA(A/G) [52]. In contrast, the N-terminal finger of GATA-1 interacts with co-regulatory proteins such as Friend of GATA [53] and is required to stabilize high-affinity GATA-1 C-finger interactions with naturally occurring double GATA sites [44,45]. Work by Crossley and colleagues confirmed the ability of the N-finger of GATA-1 to also directly bind a core GATC motif [54]. Therefore, GATA-1 binds DNA with both C- and N-fingers with the former binding to core GATA sequences, and the latter binding motifs with GATC core sequences.
In our experimental system enforced Stat3 expression in K562 stable lines produced γ-globin silencing which was reversed by simultaneous GATA-1 over-expression. Therefore the reversal of Stat3-mediated γ-globin silencing by GATA-1 are consistent with a mechanism of GATA-1 directly blocking access of the Stat3 DNA-binding domain to the γ-globin 5’UTR. In a similar manner, GATA-1 has been shown to block IL-6-induced macrophage differentiation [55] suggesting an inhibitory effect of GATA-1 involving IL-6-mediate Stat3 activation. The ability of Stat3 to inhibit GATA-1 trans-activation is likely due to alteration of GATA-1 sufficient to destabilize its binding to the γ-globin 5’UTR. Firstly, the N-finger of GATA-1 is required to stabilize its binding to DNA, and this domain is sequestered by Stat3, which may deprive GATA-1 of high-affinity interaction with DNA. Secondly, Stat3 forms high order structures that may sterically hinder GATA-1 binding. This idea is supported by reports showing that Stat3 dimers bound to DNA can form tetramers on tandem STAT binding sites [33] such as those present in the γ-globin 5’UTR at nucleotide +9 and +26, which may further destabilize GATA-1 binding. Experimental data are required to substantiate these mechanisms.
The data presented herein support a competitive interaction between the Stat3 and GATA-1 trans-factors in γ-globin gene expression in response to IL-6 treatment. A possible role for Stat3 signaling in silencing erythroid-specific gene during commitment of the bi-potential erythroid-megakaryocytic progenitor to the megakaryocyte lineage will be investigated in the future.
ACKNOWLEDGEMENT
This work was supported by grant #HL073447 from the National Institutes of Health to the University of Texas at Dallas on behalf of Betty S. Pace. Special thanks to Inderdeep Kalra for technical assistance with the ChIP assay. No financial interest/relationships with financial interest relating to the topic of this article have been declared.
Footnotes
Publisher's Disclaimer: This is a PDF file of an unedited manuscript that has been accepted for publication. As a service to our customers we are providing this early version of the manuscript. The manuscript will undergo copyediting, typesetting, and review of the resulting proof before it is published in its final citable form. Please note that during the production process errors may be discovered which could affect the content, and all legal disclaimers that apply to the journal pertain.
REFERENCES
- 1.Stamatoyannopoulos G, Grosveld F. Hemoglobin switching, in The Molecular Basis of Blood Disease. In: Stamatoyannopoulos, Majerus, Perlmutter, Varmus, editors. 3rd Edition. Philadelphia, PA: Saunders; 2000. pp. 135–182. [Google Scholar]
- 2.Morrison JC, Whybrew WD, Bucovaz ET, Wiser WL. Fluctuation of fetal hemoglobin in sickle-cell anemia. Am J Obstet Gynecol. 1976;125:1085–1088. doi: 10.1016/0002-9378(76)90812-7. [DOI] [PubMed] [Google Scholar]
- 3.Resar LM, Segal JB, Fitzpatric LK, Friedmann A, Brusilow SW, Dover GJ. Induction of fetal hemoglobin synthesis in children with sickle cell anemia on low-dose oral sodium phenylbutyrate therapy. J Pediatr Hematol Oncol. 2002;24:737–741. doi: 10.1097/00043426-200212000-00011. [DOI] [PubMed] [Google Scholar]
- 4.Ware RE, Eggleston B, Redding-Lallinger R, Wang WC, Smith-Whitley K, Daeschner C, Gee B, Styles LA, Helms RW, Kinney TR, Ohene-Frempong K. Predictors of fetal hemoglobin response in children with sickle cell anemia receiving hydroxyurea therapy. Blood. 2002;99:10–14. doi: 10.1182/blood.v99.1.10. [DOI] [PubMed] [Google Scholar]
- 5.Li Q, Peterson KR, Fang X, Stamatoyannopoulos G. Locus control regions. Blood. 2002;100:3077–3086. doi: 10.1182/blood-2002-04-1104. [DOI] [PMC free article] [PubMed] [Google Scholar]
- 6.Walters M, Martin DI. Functional erythroid promoters created by interaction of the transcription factor GATA-1 with CACCC and AP-1/NFE-2 elements. Proc Natl Acad Sci USA. 1992;89:10444–10448. doi: 10.1073/pnas.89.21.10444. [DOI] [PMC free article] [PubMed] [Google Scholar]
- 7.Goodwin AJ, McInerney JM, Glander MA, Pomerantz O, Lowrey CH. In vivo formation of a human beta-globin locus control region core element requires binding sites for multiple factors including GATA-1, NF-E2, erythroid Kruppel-like factor, and Sp1. J Biol Chem. 2001;276:26883–26892. doi: 10.1074/jbc.M008410200. [DOI] [PubMed] [Google Scholar]
- 8.Foley HA, Ofori-Acquah SF, Yoshimura A, Critz S, Baliga BS, Pace BS. Stat3 beta inhibits gamma-globin gene expression in erythroid cells. J Biol Chem. 2002;277:16211–16219. doi: 10.1074/jbc.M106556200. [DOI] [PubMed] [Google Scholar]
- 9.Mantovani R, Superti-Furga G, Gilman J, Ottolenghi S. The deletion of the distal CCAAT box region of the A gamma-globin gene in black HPFH abolishes the binding of the erythroid specific protein NFE3 and of the CCAAT displacement protein. Nucleic Acids Res. 1989;17:6681–6691. doi: 10.1093/nar/17.16.6681. [DOI] [PMC free article] [PubMed] [Google Scholar]
- 10.Asano H, Li XS, Stamatoyannopoulos G. FKLF, a novel Kruppel-like factor that activates human embryonic and fetal beta-like globin genes. Mol Cell Biol. 1999;19:3571–3579. doi: 10.1128/mcb.19.5.3571. [DOI] [PMC free article] [PubMed] [Google Scholar]
- 11.Asano H, Li XS, Stamatoyannopoulos G. FKLF-2: a novel Kruppel-like transcriptional factor that activates globin and other erythroid lineage genes. Blood. 2000;95:3578–3584. [PubMed] [Google Scholar]
- 12.Bose F, Fugazza C, Casalgrandi M, Capelli A, Cunningham JM, Zhao Q, Jane SM, Ottolenghi S, Ronchi A. Functional interaction of CP2 with GATA-1 in the regulation of erythroid promoters. Mol Cell Biol. 2006;26:3942–3954. doi: 10.1128/MCB.26.10.3942-3954.2006. [DOI] [PMC free article] [PubMed] [Google Scholar]
- 13.Tanabe O, Katsuoka F, Campbell AD, Song W, Yamamoto M, Tanimoto K, Engel JD. An embryonic/fetal beta-type globin gene repressor contains a nuclear receptor TR2/TR4 heterodimer. Embo J. 2002;21:3434–3442. doi: 10.1093/emboj/cdf340. [DOI] [PMC free article] [PubMed] [Google Scholar]
- 14.Caldenhoven E, van Dijk TB, Solari R, Armstrong J, Raaijmakers JA, Lammers JW, Koenderman L, de Groot RP. STAT3beta, a splice variant of transcription factor STAT3, is a dominant negative regulator of transcription. J Biol Chem. 1996;271:13221–13227. doi: 10.1074/jbc.271.22.13221. [DOI] [PubMed] [Google Scholar]
- 15.Schaefer TS, Sanders LK, Nathans D. Cooperative transcriptional activity of Jun and Stat3 beta, a short form of Stat3. Proc Natl Acad Sci USA. 1995;92:9097–9101. doi: 10.1073/pnas.92.20.9097. [DOI] [PMC free article] [PubMed] [Google Scholar]
- 16.Yoo JY, Huso DL, Nathans D, Desiderio S. Specific ablation of Stat3beta distorts the pattern of Stat3-responsive gene expression and impairs recovery from endotoxic shock. Cell. 2002;108:331–344. doi: 10.1016/s0092-8674(02)00636-0. [DOI] [PubMed] [Google Scholar]
- 17.Ezoe S, Matsumura I, Gale K, Satoh Y, Ishikawa J, Mizuki M, Takahashi S, Minegishi N, Nakajima K, Yamamoto M, Enver T, Kanakura Y. GATA transcription factors inhibit cytokine-dependent growth and survival of a hematopoietic cell line through the inhibition of STAT3 activity. J Biol Chem. 2005;280:13163–13170. doi: 10.1074/jbc.M413461200. [DOI] [PubMed] [Google Scholar]
- 18.Ikonomi P, Noguchi CT, Miller W, Kassahun H, Hardison R, Schechter AN. Levels of GATA-1/GATA-2 transcription factors modulate expression of embryonic and fetal hemoglobins. Gene. 2000;261:277–287. doi: 10.1016/s0378-1119(00)00510-2. [DOI] [PubMed] [Google Scholar]
- 19.Taga T, Kishimoto T. gp130 and the interleukin-6 family of cytokines Annu. Rev. Immunol. 1997;15:797–819. doi: 10.1146/annurev.immunol.15.1.797. [DOI] [PubMed] [Google Scholar]
- 20.Rose-John S. Coordination of interleukin-6 biology by membrane bound and soluble receptors. Adv Exp Med Biol. 2001;495:145–151. doi: 10.1007/978-1-4615-0685-0_19. [DOI] [PubMed] [Google Scholar]
- 21.Schindler C, Darnell JE., Jr Transcriptional responses to polypeptide ligands: the JAK-STAT pathway. Annu Rev Biochem. 1995;64:621–651. doi: 10.1146/annurev.bi.64.070195.003201. [DOI] [PubMed] [Google Scholar]
- 22.Heinrich PC, Behrmann I, Muller-Newen G, Schaper F, Graeve L. Interleukin-6-type cytokine signaling through the gp130/Jak/STAT pathway. Biochem J. 1998;334(Pt 2):297–314. doi: 10.1042/bj3340297. [DOI] [PMC free article] [PubMed] [Google Scholar]
- 23.Stancato LF, David M, Carter-Su C, Larner AC, Pratt WB. Preassociation of STAT1 with STAT2 and STAT3 in separate signaling complexes prior to cytokine stimulation. J Biol Chem. 1996;271:4134–4137. doi: 10.1074/jbc.271.8.4134. [DOI] [PubMed] [Google Scholar]
- 24.Sehgal PB. Plasma membrane rafts and chaperones in cytokine/STAT signaling. Acta Biochim Pol. 2003;50:583–594. [PubMed] [Google Scholar]
- 25.Gerhartz C, Heesel B, Sasse J, Hemmann U, Landgraf C, Schneider-Mergener J, Horn F, Heinrich PC, Graeve L. Differential activation of acute phase response factor/STAT3 and STAT1 via the cytoplasmic domain of the interleukin 6 signal transducer gp130, I: definition of a novel phosphotyrosine motif mediating STAT1 activation. J Biol Chem. 1996;271:12991–12998. doi: 10.1074/jbc.271.22.12991. [DOI] [PubMed] [Google Scholar]
- 26.Tajima S, Tsuji K, Ebihara Y, Sui X, Tanaka R, Muraoka K, Yoshida M, Yamada K, Yasukawa K, Taga T, Kishimoto T, Nakahata T. Analysis of IL-6 receptor and gp130 expressions and proliferative capability of human CD34+ cells. J Exp Med. 1996;184:1357–1364. doi: 10.1084/jem.184.4.1357. [DOI] [PMC free article] [PubMed] [Google Scholar]
- 27.Chung YJ, Park B, Kang YJ, Kim TM, Eaves CJ, Oh IH. Unique effects of STAT3 on the early phase of hematopoietic stem cell regeneration. Blood. 2006;108:1208–1215. doi: 10.1182/blood-2006-01-010199. [DOI] [PubMed] [Google Scholar]
- 28.Peters M, Müller A, Rose-John S. Interleukin-6 and soluble interleukin-6 receptor: direct stimulation of gp130 and hematopoiesis. Blood. 1998;92:3495–3504. [PubMed] [Google Scholar]
- 29.Sangerman J, Lee MS, Yao X, Oteng E, Hsiao CH, Li W, Zein S, Ofori-Acquah SF, Pace BS. Mechanism for fetal hemoglobin induction by histone deacetylase inhibitors involves gamma-globin activation by CREB1 and ATF-2. Blood. 2006;108:3590–3599. doi: 10.1182/blood-2006-01-023713. [DOI] [PMC free article] [PubMed] [Google Scholar]
- 30.Andrews NC, Faller DV. A rapid micropreparation technique for extraction of DNA-binding proteins from limiting numbers of mammalian cells. Nucleic Acids Res. 1991;19:2499. doi: 10.1093/nar/19.9.2499. [DOI] [PMC free article] [PubMed] [Google Scholar]
- 31.Watts HJ, Yeung D, Parkes H. Real-time detection and quantification of DNA hybridization by an optical biosensor. Anal Chem. 1995;67:4283–4289. doi: 10.1021/ac00119a013. [DOI] [PubMed] [Google Scholar]
- 32.Biet E, Sun J, Dutreix M. Conserved sequence preference in DNA binding among recombination proteins: an effect of ssDNA secondary structure. Nucleic Acids Res. 1999;27:596–600. doi: 10.1093/nar/27.2.596. [DOI] [PMC free article] [PubMed] [Google Scholar]
- 33.Zhang X, Darnell JE., Jr Functional importance of Stat3 tetramerization in activation of the alpha 2-macroglobulin gene. J Biol Chem. 2001;276:33576–33581. doi: 10.1074/jbc.M104978200. [DOI] [PubMed] [Google Scholar]
- 34.Ferry AE, Baliga BS, Monteiro C, Pace BS. Globin gene silencing in primary erythroid cultures, an inhibitory role for interleukin-6. J Biol Chem. 1997;272:20030–20037. doi: 10.1074/jbc.272.32.20030. [DOI] [PubMed] [Google Scholar]
- 35.Amrolia PJ, Cunningham JM, Ney P, Nienhuis AW, Jane SM. Identification of two novel regulatory elements within the 5′-untranslated region of the human A gamma-globin gene. J Biol Chem. 1995;270:12892–12898. doi: 10.1074/jbc.270.21.12892. [DOI] [PubMed] [Google Scholar]
- 36.Li Q, Clegg C, Peterson K, Shaw S, Raich N, Stamatoyannopoulos G. Binary transgenic mouse model for studying the trans control of globin gene switching: evidence that GATA-1 is an in vivo repressor of human epsilon gene expression. Proc Natl Acad Sci USA. 1997;94:2444–2448. doi: 10.1073/pnas.94.6.2444. [DOI] [PMC free article] [PubMed] [Google Scholar]
- 37.Kirito K, Uchida M, Takatoku M, Nakajima K, Hirano T, Miura Y, Komatsu N. A novel function of Stat1 and Stat3 proteins in erythropoietin-induced erythroid differentiation of a human leukemia cell line. Blood. 1998;92:462–471. [PubMed] [Google Scholar]
- 38.Jelkmann W, Bohlius J, Hallek M, Sytkowski AJ. The erythropoietin receptor in normal and cancer tissues. Crit Rev Oncol Hematol. 2008;67:39–61. doi: 10.1016/j.critrevonc.2008.03.006. [DOI] [PubMed] [Google Scholar]
- 39.Socolovsky M, Fallon AE, Wang S, Brugnara C, Lodish HF. Fetal anemia and apoptosis of red cell progenitors in Stat5a−/−5b−/− mice: a direct role for Stat5 in Bcl-X (L) induction. Cell. 1999;98:181–191. doi: 10.1016/s0092-8674(00)81013-2. [DOI] [PubMed] [Google Scholar]
- 40.Welch JJ, Watts JA, Vakoc CR, Yao Y, Wang H, Hardison RC, Blobel GA, Chodosh LA, Weiss MJ. Global regulation of erythroid gene expression by transcription factor GATA-1. Blood. 2004;15:3136–3147. doi: 10.1182/blood-2004-04-1603. [DOI] [PubMed] [Google Scholar]
- 41.Weiss MJ, Orkin SH. Transcription factor GATA-1 permits survival and maturation of erythroid precursors by preventing apoptosis. Proc Natl Acad Sci USA. 1995;10:9623–9627. doi: 10.1073/pnas.92.21.9623. [DOI] [PMC free article] [PubMed] [Google Scholar]
- 42.Cantor AB, Orkin SH. Transcriptional regulation of erythropoiesis: an affair involving multiple partners. Oncogene. 2002;21:3368–3376. doi: 10.1038/sj.onc.1205326. [DOI] [PubMed] [Google Scholar]
- 43.Grosveld F, Rodriguez P, Meier N, Krpic S, Pourfarzad F, Papadopoulos P, Kolodziej K, Patrinos GP, Hostert A, Strouboulis J. Isolation and characterization of hematopoietic transcription factor complexes by in vivo biotinylation tagging and mass spectrometry. Ann N Y Acad Sci. 2005;1054:55–60. doi: 10.1196/annals.1345.008. [DOI] [PubMed] [Google Scholar]
- 44.Trainor CD, Ghirlando R, Simpson MA. GATA zinc finger interactions modulate DNA binding and transactivation. J Biol Chem. 2000;275:28157–28166. doi: 10.1074/jbc.M000020200. [DOI] [PubMed] [Google Scholar]
- 45.Trainor CD, Omichinski JG, Vandergon TL, Gronenborn AM, Clore GM, Felsenfeld G. A palindromic regulatory site within vertebrate GATA-1 promoters requires both zinc fingers of the GATA-1 DNA-binding domain for high-affinity interaction. Mol Cell Biol. 1996;16:2238–2247. doi: 10.1128/mcb.16.5.2238. [DOI] [PMC free article] [PubMed] [Google Scholar]
- 46.Magis W, Martin DI. HMG-I binds to GATA motifs: implications for an HPFH syndrome. Biochem Biophys Res Commun. 1995;214:927–933. doi: 10.1006/bbrc.1995.2375. [DOI] [PubMed] [Google Scholar]
- 47.Zhiyi Chen H-YL, Raveen K. Basran, Tien-Huei Hsu, Daniel W. H. Mang, Lalana Nuntakarn, Cathy G. Rosenfield, George P. Patrinos, Ross C. Hardison, Martin H. Steinberg, David H. K. Chui. A T-to-G Transversion at Nucleotide −567 Upstream of HBG2 in a GATA-1 Binding Motif Is Associated with Elevated Hemoglobin F. Mol. Cell. Biol. 2008;28:4386–4393. doi: 10.1128/MCB.00071-08. [DOI] [PMC free article] [PubMed] [Google Scholar]
- 48.Harju-Baker S, Costa FC, Fedosyuk H, Neades R, Peterson KR. Silencing of Agamma-globin gene expression during adult definitive erythropoiesis mediated by GATA-1-FOG-1-Mi2 complex binding at the −566 GATA site. Mol Cell Biol. 2008;28:3101–3113. doi: 10.1128/MCB.01858-07. [DOI] [PMC free article] [PubMed] [Google Scholar]
- 49.Duan Z, Stamatoyannopoulos G, Li Q. Role of NF-Y in in vivo regulation of the gamma-globin gene. Mol Cell Biol. 2001;21:3083–3095. doi: 10.1128/MCB.21.9.3083-3095.2001. [DOI] [PMC free article] [PubMed] [Google Scholar]
- 50.Zhang P, Zhang X, Iwama A, Yu C, Smith KA, Mueller BU, Narravula S, Torbett BE, Orkin SH, Tenen DG. PU.1 inhibits GATA-1 function and erythroid differentiation by blocking GATA-1 DNA binding. Blood. 2000;96:2641–2648. [PubMed] [Google Scholar]
- 51.Stopka T, Amanatullah DF, Papetti M, Skoultchi AI. PU.1 inhibits the erythroid program by binding to GATA-1 on DNA and creating a repressive chromatin structure. Embo J. 2005;24:3712–3723. doi: 10.1038/sj.emboj.7600834. [DOI] [PMC free article] [PubMed] [Google Scholar]
- 52.Tsai SF, Strauss E, Orkin SH. Functional analysis and in vivo footprinting implicate the erythroid transcription factor GATA-1 as a positive regulator of its own promoter. Genes Dev. 1991;5:919–931. doi: 10.1101/gad.5.6.919. [DOI] [PubMed] [Google Scholar]
- 53.Tsang AP, Visvader JE, Turner CA, Fujiwara Y, Yu C, Weiss MJ, Crossley M, Orkin SH. FOG, a multitype zinc finger protein, acts as a cofactor for transcription factor GATA-1 in erythroid and megakaryocytic differentiation. Cell. 1997;90:109–119. doi: 10.1016/s0092-8674(00)80318-9. [DOI] [PubMed] [Google Scholar]
- 54.Newton A, Mackay J, Crossley M. The N-terminal zinc finger of the erythroid transcription factor GATA-1 binds GATC motifs in DNA. J Biol Chem. 2001;276:35794–35801. doi: 10.1074/jbc.M106256200. [DOI] [PubMed] [Google Scholar]
- 55.Tanaka H, Matsumura I, Nakajima K, Daino H, Sonoyama J, Yoshida H, Oritani K, Machii T, Yamamoto M, Hirano T, Kanakura Y. GATA-1 blocks IL-6-induced macrophage differentiation and apoptosis through the sustained expression of cyclin D1 and bcl-2 in a murine myeloid cell line M1. Blood. 2000;95:1264–1273. [PubMed] [Google Scholar]


