

Abstract
Visual scenes comprise enormous amounts of information from which nervous systems extract behaviorally relevant cues. In most model systems, little is known about the transformation of visual information as it occurs along visual pathways. We examined how visual information is transformed physiologically as it is communicated from the eye to higher-order brain centers using bumblebees, which are known for their visual capabilities. We recorded intracellularly in vivo from 30 neurons in the central bumblebee brain (the lateral protocerebrum) and compared these neurons to 132 neurons from more distal areas along the visual pathway, namely the medulla and the lobula. In these three brain regions (medulla, lobula, and central brain), we examined correlations between the neurons' branching patterns and their responses primarily to color, but also to motion stimuli. Visual neurons projecting to the anterior central brain were generally color sensitive, while neurons projecting to the posterior central brain were predominantly motion sensitive. The temporal response properties differed significantly between these areas, with an increase in spike time precision across trials and a decrease in average reliable spiking as visual information processing progressed from the periphery to the central brain. These data suggest that neurons along the visual pathway to the central brain not only are segregated with regard to the physical features of the stimuli (e.g., color and motion), but also differ in the way they encode stimuli, possibly to allow for efficient parallel processing to occur.
Introduction
How is visual information segregated, processed, and integrated by higher-order brain centers? The complexity of the vertebrate visual cortex and related brain areas has made answering these questions challenging (Hubel and Livingstone, 1987; Kara et al., 2000; Kumbhani et al., 2007). Parallel and sequential visual processing are more easily addressed in some invertebrates, where it is possible to record in vivo in awake animals and identify individual neurons (Hertel, 1980; Haag et al., 2007; Paulk et al., 2008). Ultimately, the invertebrate and vertebrate visual systems can be compared and convergent basic mechanisms designed to both encode and partition visual information can be discovered.
Here, we examine mechanisms of color processing in bumblebees (Bombus impatiens) at various stages of the visual pathway from peripheral areas to higher-order brain centers. Bumblebees have extensive visual and learning capabilities (Ney-Nifle et al., 2001; Lotto and Chittka, 2005; Lotto and Wicklein, 2005; Dyer et al., 2008) and true color vision (Peitsch et al., 1992) and are amenable to electrophysiological recordings (Paulk et al., 2008, 2009).
In terms of visual pathways in insects, the photoreceptors provide input from the eye to the lamina, which then sends its projections to the medulla (Ribi, 1975a,b; Strausfeld, 1976). The medulla connects to the central brain and, in parallel, to a third-order visual processing center, the lobula, which then sends inputs via several tracts into the central brain (Hertel, 1980; Ribi and Scheel, 1981; Mobbs, 1982, 1984; Hertel and Maronde, 1987). Recent work in the bumblebee lobula has shown that color and motion information are segregated along anatomical pathways (Paulk et al., 2008), which are then integrated by the central brain.
The lateral protocerebrum is a central brain area that has mostly been studied anatomically or in the context of olfactory processing (Kenyon, 1896; Strausfeld, 1976; Mobbs, 1982, 1984; Homberg, 1984; Heisenberg, 1998, 2003; Gronenberg, 2001; Ehmer and Gronenberg, 2002; Kirschner et al., 2006). The lateral protocerebrum also receives projections from the medulla and the lobula (Strausfeld, 1976; Mobbs, 1982, 1984; Maronde, 1991). Recently, anatomical mapping of the lateral protocerebrum in flies identified the existence of select centers (“glomeruli”) sensitive to visual stimulus orientation (Okamura and Strausfeld, 2007; Strausfeld and Okamura, 2007). However, little is known about how visual information from the medulla and lobula converge and are integrated in the protocerebrum in any insect.
To address the functional organization of the lateral protocerebrum, we examined lateral protocerebral neurons and compared their properties to medulla and lobula neurons (Paulk and Gronenberg, 2008; Paulk et al., 2008, 2009). The purpose of these studies is to perform an initial examination of diverse neurons at three stages of visual processing while testing visual cues. We found that color sensitivity was mostly segregated in the lateral protocerebrum. Moreover, the temporal characteristics of the neurons differed as signals progressed from the periphery to the central brain, indicating that information is both processed and transformed in parallel as it is passed from one visual stage to another.
Materials and Methods
Animals and preparation
Bumblebee colonies (Bombus impatiens) were acquired from Biobest Biological Systems (International Technology Services) and were maintained in the laboratory. We selected relatively large bumblebees of unknown age for recording (n = 145) and for Bodian staining (n = 6).
Bodian staining
Bodian reduced silver staining was performed using a protocol similar to that of Gregory (1980). Brains were fixed overnight at 4°C in 64% ethyl alcohol, 5% acetic acid, and 3.75% formalin in water. After fixation the tissue was dehydrated and embedded in paraffin (Paraplast+, Oxford Labware), sectioned at 15 μm, mounted on slides coated with albumin, deparaffinized, and rehydrated before incubation in protargol solution: 2.5 g of silver protein (Merck) and 2 g of metallic copper, in 250 ml of distilled water. After 23 h at 60°C slides were removed from the protargol solution and processed through 1% hydroquinone and 5% sodium sulfite for 5 min, 1% gold chloride under bright light for 7 min, (1%) oxalic acid for 5 min, and 2.5% sodium thiosulfate for 5 min. Sections were again dehydrated and then coverslipped using Entellan (Merck).
Intracellular recording procedure
Bees were cold anesthetized and immobilized in plastic tubes. The rest of the recording was performed under room temperature, ∼25–26°C. While this is not the optimal temperature at which bumblebees warm up to take flight (at 30–40°C) (Krogh and Zeuthen, 1941; Heinrich, 1993), bumblebees can perform various behavioral tasks, including those involving learning and memory while walking and not in flight. We currently perform several behavioral assays (including optomotor flight assays and learning assays) in the same lab space in which the electrophysiological studies were performed. The brain was exposed for recording and insect saline (Baumann and Hadjilazaro, 1972) was applied at intervals. Borosilicate thin-walled glass electrodes (tip resistances: 70–120 MΩ with 1 m KCl) were pulled from capillary tubes (A-M Systems) on a laser-based micropipette puller (model P-2000, Sutter Instruments). Micropipettes were backfilled with either Lucifer yellow (200 μm in 0.5 m LiCl) or one of three Alexa Fluor hydrazide dyes (excitation spectra at 568, 633, or 647 nm, 200 μm in 1 m KCl; Invitrogen). The intracellular signals of spiking neurons were amplified (Neuroprobe 1600; A-M Systems), and recorded on a computer using a Power Lab data acquisition board (ADInstruments). Data were captured at 20 kHz and saved for offline analysis. The bumblebee was presented with an array of visual stimuli (see below). At the end of the experiment, the neuron was labeled with the dye by injecting a current of −2 to −5 nA at 1 Hz for 1–3 min.
Histology
Brains with dye-filled neurons were fixed (4% paraformaldehyde in buffered insect saline, pH 6.9), dissected, rinsed, and dehydrated using increasing concentrations of ethanol and embedded in Spurr's low-viscosity medium (EMS) and polymerized. These plastic blocks were sectioned at 10–20 μm using a sliding microtome, mounted, and coverslipped. Images of the brain sections were recorded using a Nikon PCM 2000 confocal laser microscope (Nikon) or an LSM 5 Pascal confocal microscope (Zeiss) both with argon and HeNe lasers. Neurons were reconstructed from the image stacks and were adjusted for brightness and contrast using Photoshop (Adobe). Neurons in figures represent two-dimensional projections across all plastic sections containing processes of the fluorescent neuron.
Brain areas and neuronal anatomy are described according to the neuraxis where the mushroom body calyces are dorsal, the antennal lobes are ventral and anterior while the subesophageal ganglion is posterior (Fig. 1E,F). The optic lobes are lateral in the brain relative to the protocerebrum and central complex.
Figure 1.

The bee brain and the lateral protocerebrum. A, Whole bumblebee brain viewed frontally. Several structures are noted, including the optic lobes (ol), mushroom body calyces (mb-c), antennal lobes (al), retina (ret), and protocerebrum (prot). B, Bodian-stained horizontal section at the level of the dashed line in A. The staining delineates the lobula (lo), medulla (me), the mushroom body lateral calyx (mb-lc), and the protocerebrum. Glomeruli in the protocerebrum (prot) are indicated by light blue asterisks, axonal tracts by white asterisks. Ci, Frontal section of half of the bumblebee brain, Bodian stained. The staining delineates the antennal lobes, the lobula, medulla, the mushroom body lateral calyx, the mushroom body medial calyx (mb-mc), and the mushroom body lobe (mb-l). Cii, Color-coded areas used to reconstruct the brain: the medulla (green), antennal lobes (orange), and protocerebral areas comprising glomeruli (cyan and yellow). D, Three-dimensional reconstruction of major components of the bumblebee brain, including the antennal lobes (orange), lobula (light blue), medulla (green), central complex (cc, purple), mushroom bodies (mb, magenta), LH (gray), and SLPr (cyan). E, Reconstructions of brain areas as in D along with other brain areas removed to reveal protocerebral components: LH (gray), SLPr (cyan), ILPr (yellow), AOT (blue), PPr (red), and subesophageal ganglion (SOG). F, The same brain reconstruction rotated for a dorsal view. G, A schematic of a dorsal view of the same brain areas, with a view of the SLPr, PPr, optic lobes, and other brain areas listed above. Scale bar, 100 μm.
Visual stimuli
Color and motion stimuli as described by Paulk and Gronenberg (2008) and Paulk et al. (2008, 2009) were presented to the bees' eye ipsilateral to the recording electrode. The stimuli are briefly described below.
Color stimuli.
An array of 60 light-emitting diodes [LEDs; 20 each violet (v), blue (b), and green (g); peak wavelengths: v: 404 nm; b: 476 nm; g: 561 nm, with an average half-peak width: 22.13 ± 8.86 nm] provided light flashes of different colors (wavelengths) and wavelength combinations (bg, bv, gv, and bgv). The LEDs' efficiency with respect to the bumblebee spectral sensitivity as well as the behavioral relevance of the applied stimulus intensities are discussed in detail in Paulk and Gronenberg (2008) and Paulk et al. (2008, 2009). The LED colors were arranged in a semirandom configuration, with trios of violet, blue, and green LEDs grouped together right next to each other such that they could be treated as coarse overlapping “pixels” of violet, blue, and green colors (supplemental Fig. 1, available at www.jneurosci.org as supplemental material). Considering that the divergence angles of light from each LED were 15° and the angular separation of the LEDs at the level of the bee's eye is at 1.45°, we are confident that there was significant overlap of colors when they were presented simultaneously to the bumblebee eye.
The LED array was arranged in a half-circle such that the long axis of the array aligned with the long axis of the bumblebee eye, spanning 2.9° by 123.3° of the visual field (Paulk and Gronenberg, 2008; Paulk et al., 2008). The array could be moved out of the way to present motion cues, but it was not moved to test the entire receptive field since the recordings did not always last long enough to test all fields (∼5 min). Each stimulus was presented as five consecutive 500 ms LED light flashes at 1 Hz, which was unlikely to cause adaptation at the level of the photoreceptors.
Motion stimuli.
Motion stimuli were presented on a computer-controlled (Vision Egg software) (Straw et al., 2006) cathode ray tube (CRT) monitor that subtended 114.0° by 103.1° of the visual field of one eye, with a vertical refresh rate of 160 Hz [for details of the motion stimuli, see Paulk and Gronenberg (2008) and Paulk et al. (2008, 2009)] (supplemental Fig. 1, available at www.jneurosci.org as supplemental material).
Four types of motion stimuli were tested: a wide-field high-contrast square-wave moving grating (filling the entire computer screen, at a spatial frequency of 12.89°, moving at a rate of 57.2°/s), a small moving bar (subtending 3.85° by 16.2°, moving at a rate of 73.57°/s), a large moving bar (either a black bar on white or a white bar on black; subtending 9.04° by 103.1°, moving at a rate of 54.25°/s), and a moving black edge on a white background (filling the entire CRT screen, moving at a rate of 87.69°/s). Each stimulus was moved in eight different directions (up, down, left, right, and 45° to these respective directions) and four different orientations (Paulk and Gronenberg, 2008; Paulk et al., 2008). Luminance changes of the CRT monitor resulting from the visual stimuli were measured by a photodiode and recorded with the neuronal signals.
Analysis of responses to visual stimuli
Membrane potential data were imported into Matlab (The MathWorks), downsampled to a resolution of 0.1 ms, and filtered to remove high-frequency (>2000 Hz) and low-frequency (<50 Hz) components. Electrical noise from the LED relay switches was also removed digitally. The spike time and mean frequency of the action potentials were measured by detecting spikes above a set threshold. A significant response to a visual cue was defined as a change in spike rate more than two times above or below the standard deviation of the mean background spiking activity. Response categories are described in the Results and are laid out in supplemental Table 1 (available at www.jneurosci.org as supplemental material). The temporal dynamics and adaptation of the response were analyzed. Habituation was identified when a neuron significantly (see above) changed its response to subsequent light flashes compared with the first light flash.
Spike time precision and response reliability
Spike timing precision, response reliability, average event spiking, and habituation across repeated trials were calculated using procedures similar to those described by Mainen and Sejnowski (1995), Paulk et al. (2008), Schreiber et al. (2003), and Tiesinga et al. (2008). We first give a qualitative description of these measures before giving their mathematical formulation.
The terms precision and reliability address two temporal properties of neurons and have been used extensively in studies involving vertebrate visual cortex (for review, see Tiesinga et al., 2008). These measures do not necessarily determine the coding strategy used, but put constraints on which ones are possible. A highly precise neuron has the potential for coding information using single spikes, or spike patterns, in conjunction with other neurons. A highly reliable neuron fires every time a given stimulus is presented. The firing may or may not be precise. With reliable neurons, the need for redundancy (number of neurons coding for the same aspect of the stimulus) is small, so that in the extreme case, single neurons can carry information unrelated to that of other neurons.
Across multiple presentations of the same stimuli, neurons tend to fire at specific times, with a certain amount of reliability and precision. The specific firing times are termed “events” and can be seen qualitatively as vertical alignments in a raster plot, or peaks in the peristimulus time histogram (PSTH). The average number of spikes fired in events is defined as the average event spiking of the neuron. A neuron with a high average event spiking value presumably has a high postsynaptic impact on a downstream neuron. On the other hand, habituation is inversely related to the length of time elapsed before the neuron stops responding to the same stimulus. A strongly habituating neuron can potentially help a network in differentiating transient from sustained stimulus patterns.
Full explanations of the calculations and examples of spike time precision and response reliability measurements are described in detail in the study by Paulk et al. (2008). Briefly, reliability, precision, and average event spiking are defined on the basis of “events,” which are quantitatively defined as peaks in the PSTH of the neuron three standard deviations above the mean (see Fig. 7). Reliability, precision, and average event spiking quantify these alignments. In short, spike time precision is the inverse of the jitter of the spike times across trials (see below), which directly relates to the timing of the neural responses. A highly precise (i.e., with low jitter) spike will occur with exactly the same latency after stimulus onset or offset every time the neuron responds. Spike time precision = P = E/Σσe, where E is the number of events, and σe is the standard deviation of the individual spike times in event e.
Figure 7.
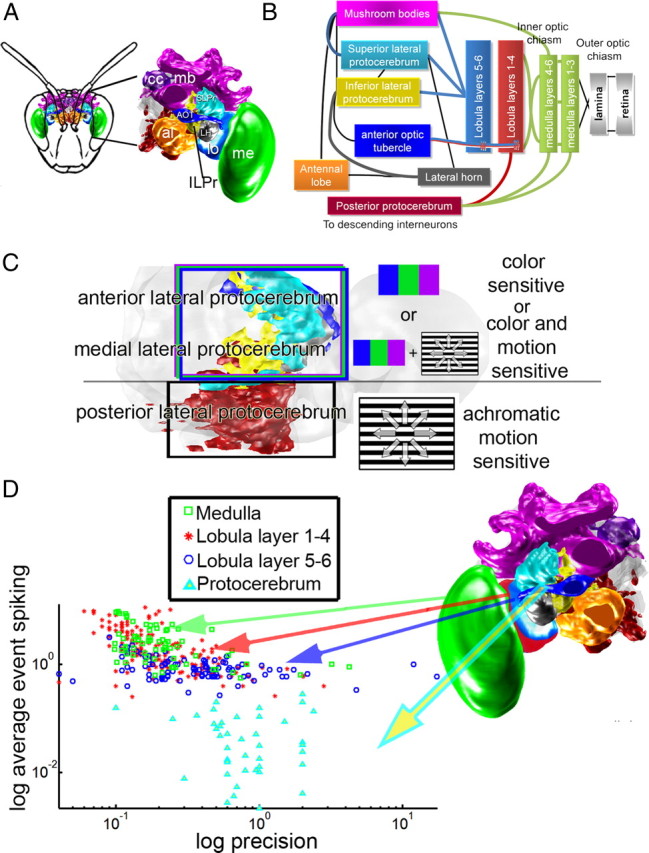
Summary of the connections and anatomy of the bumblebee brain. A, Overview of the specific brain regions that are the subject of the current study: medulla (me), lobula (lo), SLPr, ILPr, AOT, and the LH. mb, Mushroom bodies; cc, central complex; al, antennal lobe. B, Major connections between the brain areas; bold colored lines represent connections addressed in this paper. Thin black lines represent connections described elsewhere; the same color scheme is used in A and B. C, Distribution of color and motion sensitivity in the lateral protocerebrum, with color sensitivity generally in the anterior and medial protocerebrum, and achromatic motion sensitivity distributed to the posterior protocerebrum. D, Distribution of the log of the spike time precision plotted against the log of average event spiking for individual neurons from the medulla (green), lobula layers 1–4 (red), lobula layers 5–6 (blue), and lateral protocerebral (cyan) neurons. As the cells progress from the periphery to the central brain, note how the data move away from high to low average event spiking values while increasing the precision values.
Reliability, the fraction of spikes across trials that occurred during the events relative to those outside of the events, was calculated with the following equation: response reliability = R = Σ(Ne)/N, where Ne is the number of spikes in event e (across all trials), and N is the total number of spikes across all trials. Average event spiking, the average number of spikes occurring per event and per trial, was calculated with the following equation: average event spiking = S = 1/Ntrials × (ΣNe) × 1/E, where Ne is the number of spikes within each event e, E is the number of events, and Ntrials is the number of trials. Statistical comparisons of measurements between cell groups or stimuli were made using the Mann–Whitney U test.
Results
We recorded from and morphologically identified 30 neurons with the majority of their neurites in the lateral protocerebrum. The anatomy and physiology of the lateral protocerebral neurons were compared with those of the output neurons from the medulla (n = 27) and the lobula (n = 105), whose properties have recently been published (Paulk and Gronenberg, 2008; Paulk et al., 2008, 2009).
To correlate lobula and medulla inputs with protocerebral neuron branching patterns, we divided the lateral protocerebrum into five major regions using anatomical criteria. Then, we grouped individual neurons according to the location of the bulk of their processes with respect to four of these regions in the lateral protocerebrum to ultimately examine whether subregions of the lateral protocerebrum differed with respect to their responses to color stimuli. To examine how visual information was transformed at the three different stages of visual processing (medulla, lobula, and lateral protocerebrum), we measured the temporal response properties to light flashes of neurons in each brain area. We found that the neurons segregated in terms of color sensitivity as well as in terms of stimulus encoding.
The lateral protocerebrum can be subdivided into five regions
The lateral protocerebrum (Fig. 1) surrounds well defined anatomical structures [the mushroom bodies (magenta) and the central complex (purple; Fig. 1)] and receives input tracts from the antennal lobes (orange) and the optic lobe regions: the medulla (green) and lobula (light blue in Fig. 1) (Schildberger, 1984). The distribution of tracts and neuropil in the lateral protocerebrum of bumblebees (Fig. 1), revealed subdivisions of the lateral protocerebrum into neuropilar concentrations (Fig. 1B–E), referred to as foci (Strausfeld, 1976) or, more recently, glomeruli (∼25 are described for flies) (Strausfeld and Okamura, 2007; Strausfeld et al., 2007). These protocerebral glomeruli (25- to 100-μm-wide spheroidal structures) (Fig. 1B, blue asterisks) contain apparent blebs and spines, presynaptic and postsynaptic specializations. Using tract location (Fig. 1B, white asterisks) and glomeruli as landmarks, we mapped and reconstructed the bumblebee lateral protocerebrum in three dimensions (Fig. 1C–F), but did not attempt to discriminate individual optic glomeruli.
Using nomenclature established in honeybees (Kenyon, 1896; Mobbs, 1982, 1984; Rybak and Menzel, 1993; Strausfeld, 2002; Kirschner et al., 2006), we identified five main regions in the lateral protocerebrum: the superior lateral protocerebrum (SLPr), the inferior lateral protocerebrum (ILPr), the posterior protocerebrum (PPr), the lateral horn (LH), and the anterior optic tubercle (AOT). The SLPr, PPr, and ILPr were three spatially distinguishable clusters of glomeruli defined by location with respect to the dorsal–ventral and anterior–posterior axes. The SLPr was in the dorsal–anterior area of the brain (Fig. 1D–F, cyan), the ILPr was ventral and posterior to the SLPr (Fig. 1D–F, yellow), and the PPr was posterior and ventral to the SLPr and ILPr (Fig. 1D–F, red).
The SLPr and ILPr together span much of the anterior-medial axis of the lateral protocerebrum, and thus neurons projecting into the anterior lateral protocerebrum were in the dorsal (SLPr) or ventral (ILPr) anterior lateral protocerebrum. Most of the lateral protocerebral neurons recorded in this study were distributed in the anterior regions or in the posterior region of the lateral protocerebrum, but could be in the SLPr or the ILPr, depending on whether they were distributed dorsally or ventrally, respectively (see below). Furthermore, the input to the protocerebrum from the medulla and lobula neurons was also segregated along the anterior–posterior axis (Paulk et al., 2008, 2009).
The LH and the AOT were not subdivided, each likely representing one single neuropil. The LH was lateral to the ILPr (Fig. 1D–F, gray) and did not represent a typical glomerulus because it is a diffuse structure with inputs from olfactory areas (Kirschner et al., 2006; Jefferis et al., 2007). The AOT formed one distinct large spheroidal structure previously described as a visual glomerulus in flies (Strausfeld and Okamura, 2007), located in the anterior aspect of the bumblebee brain, dorsal to the antennal lobes and close to the anterior brain surface (Fig. 1D–G, dark blue). The AOT possessed numerous and prominent input and output tracts (Fig. 1B).
The lateral protocerebrum receives segregated visual inputs
The extent of individual medulla and lobula neuron projections to the lateral protocerebrum were variable. Some neurons projected within only one or two foci (Fig. 2A), while others contacted many (Fig. 2A). Therefore, we focused on the projections of individual neurons in the distinct subregions of the lateral protocerebrum containing multiple foci (i.e., ILPr, PPr, SLPr). In total, 89 lobula neurons and 12 medulla neurons were traced to specific regions of the lateral protocerebrum (Fig. 2A; supplemental Table 2, available at www.jneurosci.org as supplemental material). The lobula was divided based on its layered organization into the distal lobula (layers 1–4) and the proximal lobula (layers 5–6) (Ribi and Scheel, 1981; Paulk et al., 2008). Of the large-field tangential lobula neurons in the proximal lobula, 90% projected into the SLPr or ILPr (Paulk et al., 2008) (Fig. 2A; supplemental Table 2, available at www.jneurosci.org as supplemental material) while 94% of the neurons from the distal lobula projected into the PPr (Paulk et al., 2008) (Fig. 2A; supplemental Table 2, available at www.jneurosci.org as supplemental material).
Figure 2.
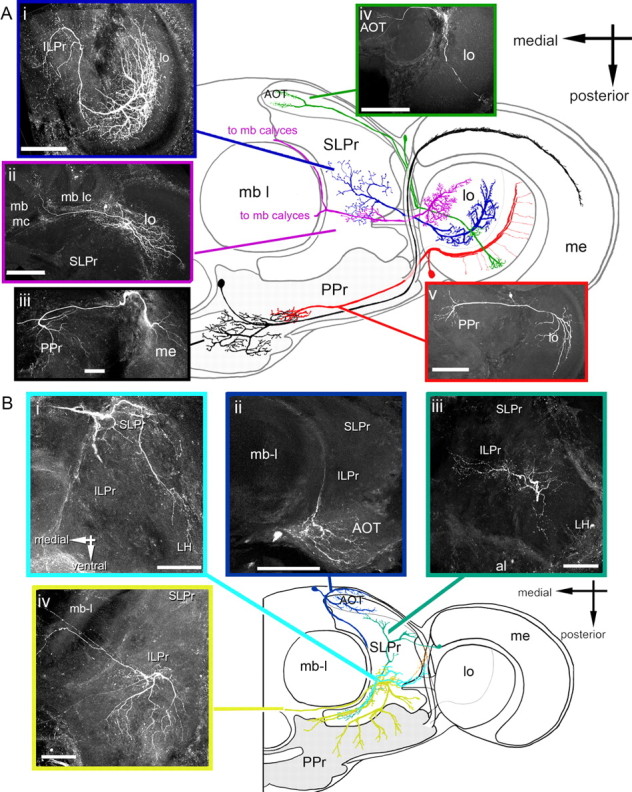
Visual input neurons to the lateral protocerebrum and lateral protocerebral neurons. A, Visual input neurons. Ai, Large-field lobula neuron with output to the medial ILPr. Aii, Large-field tangential lobula neuron with branches in the mushroom body calyces (mb-mc and mb-lc). Aiii, Large-field tangential medulla neuron with branches in the PPr. Aiv, Columnar neuron with fine branches in a lobula column and projections into the AOT. Av, Large-field tangential lobula neuron with outputs to the PPr. Ai–Av, Frontal views; a schematic horizontal representation (dorsal view) is shown in the center. lo, Lobula; me, medulla; mb l, mushroom body lobe; mb lc, mushroom body lateral calyx; mb mc, mushroom body medial calyx. B, Lateral protocerebral neurons. Bi, Protocerebral neuron primarily branching in the LH and SLPr. Bii, Protocerebral neuron with branches in anterior optic tubercle. Biii, Protocerebral neuron with branches in the anterior ILPr. Biv, Protocerebral neuron branching posteriorly in the ILPr. Center, Schematic representation (dorsal view) of the neurons in Bi–Biv, representing a virtual horizontal section. Note the relative locations of the branching patterns of the neurons along the anterior–posterior axis. Scale bar, 100 μm.
All columnar neurons of the lobula projected into the AOT (n = 6) (Fig. 2A) (Paulk et al., 2008) (supplemental Table 2, available at www.jneurosci.org as supplemental material), and all of the large-field medulla neurons projected into the PPr (Paulk et al., 2009) (Fig. 2A; supplemental Table 2, available at www.jneurosci.org as supplemental material). We recorded no neurons from the optic lobes that projected directly to the LH. These optic lobe output pathways represent functional streams of information (Hertel and Maronde, 1987; Hertel et al., 1987; Otsuna and Ito, 2006; Paulk et al., 2008) suggesting that a segregation of input should be reflected in the response properties of their postsynaptic targets, the lateral protocerebral neurons.
Neurons in the lateral protocerebrum have complex branching patterns
Branching patterns of lateral protocerebral neurons were mapped with respect to the lateral protocerebral subregions (Fig. 2B). Neurons in the lateral protocerebrum showed diverse projection patterns, including branching patterns that were widely diffuse (Fig. 2Bi,Biv), others that were restricted to specific subcompartments (such as the AOT) (Fig. 2Bii), and some with intermediate branching patterns (Fig. 2Biii). Most of the lateral protocerebral neurons recorded were located in the SLPr (n = 15/30) (Fig. 2Bi) or the ILPr (n = 12/30) (Fig. 2Biii), and were relatively anterior and medial in the brain (Fig. 1F, dark blue, yellow, and cyan structures). These neurons did have occasional branches elsewhere in the brain, including the LH (Fig. 2Biii) or the central complex (data not shown), but the majority of the lateral protocerebral neurons were in the anterior and medial protocerebrum, including two AOT neurons (Fig. 2Bii) and one mushroom body feedback neuron (data not shown).
Here, we characterized the physiological response properties of these neurons to determine whether their sensitivities to color and their temporal characteristics correlated with anatomical locations. In particular, we compared response properties of (1) neurons that projected into the SLPr versus the ILPr, and (2) neurons that branched anteriorly versus those that branched medially or posteriorly. We did not record from any of the PPr interneurons, and so to determine what visual information was sent to the PPr, we included the responses of medulla and lobula neurons supplying the PPr.
As an initial test of the neural responses to motion cues, we did test a number of motion cues, including small targets and gratings, but only three of the 16 lateral protocerebral neurons tested responded to the motion cues (supplemental Fig. 2, available at www.jneurosci.org as supplemental material). The distribution of motion information within the lateral protocerebrum, then, was examined in terms of the projections from the lobula neurons. Lobula neurons projecting to the PPr were mostly sensitive to directional motion (60%), while most of the lobula neurons projecting into the anterior protocerebrum were not motion sensitive (54%) or not sensitive to directional motion cues (15%) (supplemental Fig. 4, available at www.jneurosci.org as supplemental material) (Paulk et al., 2008). Together, these data suggest that motion information segregates along the anterior–posterior axis of the protocerebrum, with much of the motion information sent posteriorly. This indicated that the processing of motion may not be a principal function of the anterior or medial lateral protocerebrum, but further tests are needed to firmly establish the role of motion in the lateral protocerebrum.
Distribution of color sensitivity in the bumblebee brain
Color responses were classified as broad band (Fig. 3A,B), narrow band (Fig. 3C), and color opponent (Fig. 3D) (Kien and Menzel, 1977a,b; Yang et al., 2004; Paulk et al., 2008). Nearly half of the protocerebral neurons (n = 12 out of 25 tested) (Fig. 3A,B) showed broad-band color sensitivity, responding to all three colors similarly. Many other protocerebral neurons (n = 9 out of 25 tested) (Fig. 3C) showed narrow band sensitivity, responding to one or two colors, but not all three colors. For instance, the neuron in Figure 3C responded when violet was present in the stimulus. A third, smaller group of protocerebral neurons showed color opponency (n = 4 out of 25 tested) (Fig. 3D), defined as the influence of one color on the response to another color. For example, the neuron in Figure 3D produced a burst of excitation at the onset of the blue light, with reduced responses to violet and green. Overall, when all three colors were presented together (bgv) (Fig. 3D), the change in spike rate was not as strong as the neuron's response to blue alone, indicating that the violet or the green inputs had an inhibitory effect on this neuron's response to blue light. In addition, some protocerebral neurons expressed color specific responses by changes in spike pattern. Figure 3E shows a neuron that produced bursts of action potentials following a 1 Hz violet light flash. This was in contrast to its response to green or blue light (Fig. 3Ei, gray arrows) for different stimulus durations (Fig. 3Eii), and to the nearly 2 Hz bursting activity observed during spontaneous activity (Fig. 3E).
Figure 3.
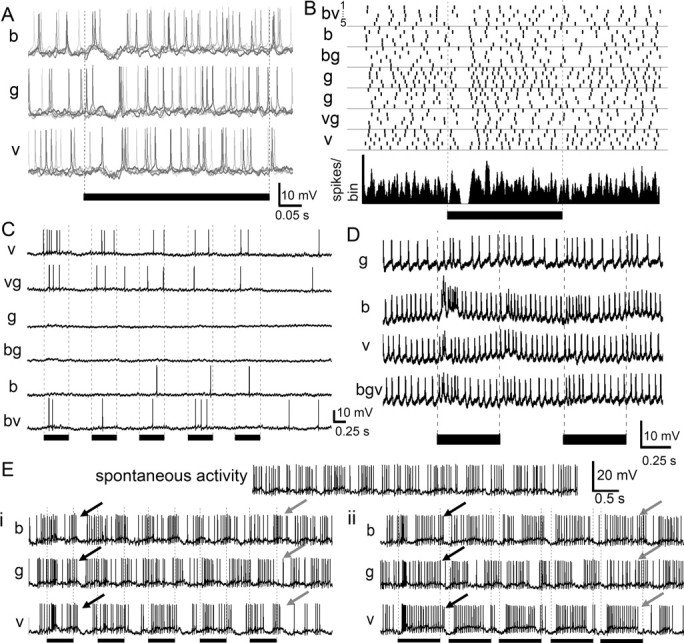
Color responses of protocerebral neurons. A, Protocerebral neuron responding with phasic “on” inhibition for all three colors [blue (b), green (g), and violet (v)] and across five trials (traces from each trial are overlaid and colored in gray). B, Raster plot (top; five trials per color) and peristimulus time histogram [bottom; Gaussian-smoothed (half-width = 5 ms); bin width = 1 ms] of responses of the same neuron as in A, revealing its phasic inhibition by light, regardless of color and color combinations (bv, vg, bg). C, Protocerebral neuron responding when violet light was present in the stimulus but not or only weakly to the other colors. D, Protocerebral neuron producing a burst of activity in response to the first light flash of blue, with a decreased response to violet and green. Simultaneous presentation of all three colors results in reduced activity compared with blue alone, suggesting that other colors inhibit the blue response. E, Stimulus entrainment. This protocerebral neuron exhibited a spontaneous rhythm of activity which persisted throughout the recording. Ei, The neuron shifts its bursting activity over time to match the rhythm of the violet light flashes. Green or blue light had a much weaker entrainment effect (black arrows: end of first stimulus; gray arrows: end of fifth stimulus). Eii, The stimulus entrainment response was also observed if the duration of the light flash was lengthened. In all cases, the black bars indicate the duration of the light flash. Stimulus markers: 500 ms in A–E, 840 ms in F.
Based on our observations, there were two possible ways the segregation of color information could occur within the lateral protocerebrum; color information could be segregated (1) based on the different lateral protocerebral regions or (2) based on the anterior–posterior brain axis. To determine the basis for color information segregation, we compared protocerebral projections based on their location within the SLPr, ILPr, lobula, and medulla (supplemental Fig. 3, available at www.jneurosci.org as supplemental material) as well as their location within the anterior, medial, or posterior portions of the lateral protocerebrum (Fig. 4; supplemental Fig. 3, available at www.jneurosci.org as supplemental material) and to input neurons from the medulla or lobula. The different types of color responses (see above) were evenly distributed across the SLPr, ILPr, the medulla, and the entire lobula, with the majority of neurons in each region featuring no color discrimination and fewer neurons featuring narrow-band or color-opponent responses (supplemental Fig. 3A, available at www.jneurosci.org as supplemental material). However, the majority of medulla and lobula inputs to the PPr as well as neurons residing in the medial lateral protocerebrum were not color sensitive (Fig. 4). Conversely, the majority of neurons projecting from the lobula to or residing in the anterior lateral protocerebrum were color sensitive, generally featuring either narrow-band or color-opponent responses (Fig. 4), suggesting that the location along the anterior–posterior axis is the better predictor of color sensitivity.
Figure 4.

Response distributions across color-responsive neurons in the bumblebee brain. Diagrammatic reconstruction (dorsal view) of the bumblebee brain; inferior lateral and superior lateral protocerebrum (prot.), lobula, and medulla are indicated together with the percentage of neurons within each group exhibiting broad-band (bb), narrow-band (nb), and color-opponent (co) responses. Note that lobula and medulla inputs to the posterior protocerebrum and interneurons in the medial protocerebrum are mainly color insensitive (broad band). In contrast, anterior protocerebral lobula inputs and interneurons were more often color sensitive. Data describing lobula and medulla neuron responses from Paulk and Gronenberg (2008) and Paulk et al. (2008, 2009).
Temporal features of responses along the visual pathway
To study the temporal features exhibited by the different stages of the bumblebee visual pathway, we compared the response dynamics of lateral protocerebral, lobula, and medulla neurons to a series of five light flashes. This allowed for an assessment of the temporal precision, reliability, and spike rate produced in response to stimuli, as well as habituation of each processing stage.
Most of the lateral protocerebral neurons exhibited habituation, whereby the response to the first light flash was significantly different from the response to subsequent light flashes (71%) (supplemental Table 1, available at www.jneurosci.org as supplemental material; Fig. 3C,D). Only 41% of the medulla neurons habituated to the stimulus (supplemental Fig. 5, available at www.jneurosci.org as supplemental material). Layer 1–4 (distal) lobula neurons (Paulk et al., 2008) rarely habituated to the light flash stimuli (14%) (supplemental Fig. 5, available at www.jneurosci.org as supplemental material) in contrast to the 69% of layer 5–6 (proximal) lobula neurons, which did habituate (supplemental Fig. 5, available at www.jneurosci.org as supplemental material). Generally, neurons exhibiting color dependent responses often exhibited habituation while the majority of the lateral protocerebral neurons habituated to the stimuli even if they were not color sensitive (70%) (Fig. 5C,D) (supplemental Fig. 5, available at www.jneurosci.org as supplemental material). Thus, there was an increase in the proportion of neurons that habituated from the earlier to later stages of visual processing.
Figure 5.

Temporal response properties of protocerebral neurons. A, The recording trace during a series of five light flashes does not exhibit a significant change in spike rate, but when the spike times were aligned across trials (raster in B), there was remarkable precision at the offset of the light flash also seen in the peristimulus time histogram (bin width = 1 ms, smoothed with a Gaussian filter, half-width = 5 ms). The gray box outlines instances of precise responses to the onset of the stimulus. C, Extremely well timed spikes occurred after the light flash regardless of color (white arrow). Five individual trials are overlaid; the large initial spike (black arrow) represents electrical noise produced by the relay switch. In some cases, the neuron fails to respond to the end of the light flash, as indicated by the gray asterisk in B and the black asterisks in C. D, Lobula neuron with pronounced “on” and “off” response but without a precise spike time response, demonstrating that the precise spike timing in A–C was not an artifact of the relay switch noise. E, This neuron (same as in D and F) did not exhibit precisely aligned spikes across trials. F, The spikes were not well timed with the offset of the stimulus (superimposed noise of relay switch; white arrow, action potential spike of the neuron). Gi, Another protocerebral neuron shows tonic depolarization for the duration of the light flash (Gii; box in Gi) and a single highly precise spike after each of a series of five blue light flashes. Giii, All five trials aligned at the end of the light flash (membrane potentials staggered to view each trial); note the highly precise temporal alignment of spikes.
Some lateral protocerebral neurons exhibit precise responses to light flashes
Some lateral protocerebral neurons produced remarkably precise spikes at the end of the light flashes (temporal jitter of <10 ms, n = 8 out of 30) (Fig. 5A–C), which could be observed when spike times were aligned across trials and summed in PSTHs (Fig. 5B,C), even at a bin width of 1 ms. We label this response type a “precise off response.” In a few cases, the neurons produced precise spike responses to the onset of the light flash with a delay (Fig. 5B, gray box), but the presence of these “on” responses depended on the color of the light flash. Lobula and medulla neurons generally produced bursts in response to stimuli (Fig. 5D,E) (Paulk et al., 2008, 2009) that did not exhibit the same type of highly precise spike time alignments across trials (Fig. 5E,F). We found that only one out of 105 lobula neurons and one medulla neuron out of 27 produced highly precise off responses across trials suggesting that temporal response dynamics varied along the visual pathway.
Interestingly, some lateral protocerebral neurons with highly precise off responses had a depolarized membrane potential during the light flash (Fig. 5Gi,Gii), which decreased at the end of the flash. When the membrane potentials across trials were superimposed (Fig. 5Giii), the precise spike alignment across all five trials became apparent. In addition to the high spike time precision, we found response latencies much shorter than expected (2–5 ms) for third- or higher-order interneurons. These responses did not represent recording artifacts as all of the precise lateral protocerebral neurons had response failures, with some neurons exhibiting more failures (Fig. 5B,C, asterisk) than others (Fig. 5G) depending on the stimulus. In addition, other neurons recorded in the same brain did not produce the precise off response (n = 2 of precise off response neurons, with n = 4 nonprecise off response neurons).
Protocerebral neurons differ in precision and reliability compared with optic lobe neurons
There are many ways to quantify the response of a neuron to stimuli. Extensive work has been done, for example, using information theory and other statistical techniques (de Ruyter van Steveninck et al., 1997; Warzecha and Egelhaaf, 1999). As a first step before using these analyses, and given the amount and nature of the data collected, we quantified the differences in the temporal dynamics of responses by using spike time precision, response reliability, and average event spiking (AES) measures of lateral protocerebral neurons, lobula neurons, and medulla neurons. These measures were used to quantify the responses of a large population of diverse neurons and to compare responses to the same visual stimuli at different stages of visual processing, as has been done in vertebrates (Kara et al., 2000). Spike time precision, response reliability, and AES address three different aspects of the neural responses, which is why these measures were used to examine the lateral protocerebral, lobula, and medulla neural responses to light flashes.
First, spike time precision measured the temporal jitter of spikes across trials. For instance, the lateral protocerebral neurons with “precise off” responses described above had relatively high precision. Across all stimuli, layer 5–6 lobula and lateral protocerebral neurons had similar spike time precision values (Fig. 6C) (Mann–Whitney U test; p = 0.3411) significantly higher than those of medulla and layer 1–4 lobula neurons (Fig. 6C) (Mann–Whitney U test; p < 0.05) regardless of whether the lateral protocerebral neurons exhibiting the highly precise off-responses were included. Medulla neurons had significantly higher spike time precision values compared with the layer 1–4 lobula neurons (Fig. 6C) (Mann–Whitney U test statistic: 29.742; p = 0.0018). These differences also depended on the stimulus color (Fig. 6A).
Figure 6.

Spike time precision and average event reliability across neural classes. A, Spike time precision values for the medulla, distal lobula (layer 1–4 lobula), proximal lobula (layer 5–6 lobula), and protocerebral neurons for different colors and color combinations. B, Average event reliability for the same neurons for different colors and color combinations. C, Average spike time precision values across all colors and color combinations for the same neural categories. D, Average event spiking values across all colors and color combinations for the same neural categories as above. Error bars indicate SE; each letter in the graph represents groups (i.e., a, b, or c) that are statistically significant from one another. For example, group “a” is significantly different from group “b” and group “c” just as groups “b” and “c” are statistically significantly different from each other (p < 0.05; Mann–Whitney U test). Data describing medulla and lobula neuron responses from Paulk et al. (2008, 2009).
Response reliability, on the other hand, measured how consistently the neurons responded to stimuli across trials. In principle, neurons could be unreliable but precise (i.e., did not respond at every trial, but was very precise when it did), or reliable but imprecise (i.e., responded at each trial but with large jitter). Only layer 5–6 lobula neurons had significantly lower response reliability values compared with the other categories, which depended on color (Mann–Whitney U test; p < 0.05 for blue, green, violet, and violet-green color presentations; p > 0.05 for other color combinations).
In many cases, neurons responded to a stimulus with a short burst of spikes. AES measured the strength of such responses by counting the number of spikes during each event detected across trials (see Materials and Methods). Thus, AES measured the potential for the neurons to use a rate code, while spike time precision measured its potential to use a temporal code. Medulla and layer 1–4 lobula neurons exhibited high AES values which were significantly larger than the layer 5–6 lobula neurons and the lateral protocerebral neurons (Fig. 6B) (Mann–Whitney U test; p < 0.05). In addition, the layer 5–6 neurons generally had significantly higher AES values across most of the colors and color combinations compared with the lateral protocerebral neurons (Fig. 6B) (Mann–Whitney U test; p < 0.05). Therefore, from the medulla, through the distal and proximal lobula to the lateral protocerebrum, AES decreased (Fig. 6D) while spike time precision generally increased (Fig. 6C). These differences in the temporal response dynamics were further confirmed when AES and precision were calculated at multiple time scales (from 1 to 20 ms) (supplemental Fig. 6, available at www.jneurosci.org as supplemental material). The potential for coding seemed to shift from a rate code at the periphery, to a temporal code toward the central brain.
Although AES depended on firing frequency, the medulla, lobula layer 1–4, and lobula layer 5–6 neurons all had similar average spiking activity (medulla: 29.5 ± 22.2 Hz; lobula layer 1–4: 36.1 ± 38.2 Hz; lobula layer 5–6: 25.8 ± 15.7 Hz; Mann–Whitney U test; p > 0.05 for all comparisons). Only the lateral protocerebral neurons had significantly lower average spiking activity compared with the other neurons (15.94 ± 11.869 Hz; Mann–Whitney U test; p < 0.05 for all comparisons). Although spike time precision was independent of spike rate, the lower baseline firing rate in the lateral protocerebrum could have affected the AES values. Shuffling the interspike interval values across trials for the individual neurons demonstrated that the four groups of neurons did not have significantly different spike time precision values across all colors (Mann–Whitney U test; p > 0.05 for all comparisons) and that the AES values did not differ for most of the comparisons (Mann–Whitney U test; p > 0.05 for four out of six comparisons), except, surprisingly, between the medulla and the lobula layer 5–6 and the medulla and lateral protocerebral neurons (Mann–Whitney U test; p < 0.05 for both comparisons). This indicated that the differences among these neurons had less to do with baseline firing rate but more to do with some aspects of the neurons' response properties.
Color and motion sensitivity were also correlated with the temporal features exhibited by different groups of neurons. Color-sensitive neurons were significantly more precise than broad-band neurons (Mann–Whitney U test; p < 0.05), but only the narrow-band color-sensitive neurons had lower AES values (Mann–Whitney U test; p < 0.05). Directional motion-sensitive neurons were significantly less precise than motion insensitive or nondirectional motion-sensitive neurons (Mann–Whitney U test; p < 0.05 for significant differences). However, the neurons which were not motion sensitive had significantly lower AES values compared with the neurons sensitive to nondirectional or directional motion (Mann–Whitney U test; p < 0.05 for significant differences). Lobula layer 5–6 and lateral protocerebral neurons were also found to have lower spike timing variability than medulla and lobula layer 1–4 neurons by calculating Fano factors of spike trains (Fano, 1947; Teich et al., 1996) at multiple time scales (supplemental Fig. 7, available at www.jneurosci.org as supplemental material). Thus, lobula layer 1–4 and medulla neurons tended to rely more on rate coding while lobula layer 5–6 and lateral protocerebral interneurons appeared to incorporate more of a spike timing, or temporal, component to code their responses. Overall, these results indicated that temporal properties, including habituation, AES, and spike time precision, differed among the medulla, lobula, and lateral protocerebral neurons.
Discussion
Little is known about the function of the lateral protocerebrum in any insect. It receives substantial inputs from and relays outputs to numerous brain areas (Strausfeld, 1976; Mobbs, 1982, 1984; Hertel et al., 1987; Maronde, 1991; Tanaka et al., 2004; Kirschner et al., 2006; Brockmann and Robinson, 2007). The response properties of neurons in the olfactory pathway within the LH (Jefferis et al., 2007) and the exclusively visual response properties of lateral protocerebral neurons (Okamura and Strausfeld, 2007) have only recently been addressed in flies. Here, we have begun to map the functional aspects of the protocerebrum to determine how visual information is transformed by the optic lobes and protocerebrum. Quantifying responses to color, temporal response properties and habituation using the same set of stimuli, we found differences between anatomical classes of neurons despite our limited dataset and probable preferential sampling from larger neurons. Notably, we found color and visual motion information appear to be segregated along anatomical routes (Figs. 4, 6, 7; supplemental Fig. 1, available at www.jneurosci.org as supplemental material) based on the anterior (color) and posterior (motion) axis of the brain (Fig. 7C). Furthermore, neurons in peripheral brain areas encode stimuli using a rate code while neurons in more central brain areas potentially use a temporal code (Figs. 5–7).
Color and motion sensitivity are segregated in the lateral protocerebrum
In bumblebees, inputs to the PPr from the medulla and lobula are insensitive to color but generally are sensitive to motion (Paulk et al., 2008). Likewise, PPr neurons in the fly were motion and orientation sensitive (Okamura and Strausfeld, 2007). The finding that neurons in the PPr mainly process achromatic motion information fits with the idea that the PPr produces a large amount of premotor descending output (Ibbotson, 2001) especially considering that optomotor control in bees is behaviorally achromatic (Kaiser and Liske, 1972; Chittka and Tautz, 2003).
While much is known behaviorally about the perception of color by honeybees (Srinivasan and Lehrer, 1985; Backhaus et al., 1987; Backhaus, 1992), only a few studies address color vision at the neural level (Kien and Menzel, 1977a,b; Yang et al., 2004; Paulk and Gronenberg, 2008; Paulk et al., 2008, 2009). In this study, color sensitivity was mostly localized in the anterior regions of the lateral protocerebrum, both regarding the lobula inputs and the lateral protocerebral neurons themselves (Fig. 6). The anterior portions of the protocerebrum provide input to and receive outputs from structures presumably supporting learning and memory, such as the central complex and mushroom bodies (Fig. 9) (Mauelshagen, 1993; Rybak and Menzel, 1993; Heisenberg, 1998, 2003; Strausfeld, 2002; Liu et al., 2006). The more central neurons generally habituated to the light flash stimuli (supplemental Fig. 3, available at www.jneurosci.org as supplemental material), suggesting that the anterior lateral protocerebrum may process advanced phenomena such as attention or the formation of associations. These responses imply that there is a functional segregation between the anterior and the posterior lateral protocerebrum, with the anterior protocerebrum processing color or pattern cues (potentially involved forming associations) while the posterior protocerebrum may be involved in processing motion and orientation information essential for moving through the environment.
Encoding of visual stimuli: transformations along the visual pathway
Much of the work on temporal coding and information content in the fly has focused on a specific small population of motion-sensitive neurons in the lobula complex, whose properties are well characterized (de Ruyter van Steveninck et al., 1997; Warzecha and Egelhaaf, 1999; Borst and Haag, 2002). The types of analyses performed in the work on the temporal properties of the fly lobula complex often required a data collection paradigm in which stimuli and length of the recordings were compatible with (if not specifically designed for) information-theoretic measures (Strong et al., 1998; Victor, 2002). Before performing such analyses in bees, we need to first understand the specificity of the large population of neurons leading from the periphery to the central brain, a task that has never been undertaken in the bee.
How do neurons in the mammalian retina, lateral geniculate nucleus, and visual cortex signal stimuli and transfer information between brain areas, particularly in the time domain? Vertebrate visual pathways demonstrate different properties in response reliability, spike time precision, spike rate, and the amount of information conveyed by neurons at every stage of processing (Hubel and Livingstone, 1987; Lennie, 1998; Kara et al., 2000; Lennie and Movshon, 2005; Kumbhani et al., 2007). As visual information passes from retina to cortex, the signal is contaminated with increasing amount of noise due to stochastic elements (e.g., synaptic failures, membrane channel noise) which decrease temporal precision (Kumbhani et al., 2007).
Surprisingly, and in contrast to the mammalian system, spike time precision increased from the periphery to the central brain of the bumblebee (Figs. 6, 7). In many cases, the temporally precise spike occurred within 5 ms of the offset of the light flash (Fig. 5). Synaptic release in insect visual neurons takes ∼1 ms to complete (Rind, 1984); therefore, it is unlikely that feedback networks underlie the precise spike times. Further investigation of potential inhibitory elements is required, but there could be other explanations for these responses.
An as yet unknown direct pathway from early processing stages to the central brain might contribute, akin to that involving the superior colliculus in mammalian systems. Visual information could be sent directly from the medulla or ocelli (eyes on the dorsal surface of the head of most insects that are independent from the large compound eyes) to the protocerebrum, bypassing the lobula, thereby decreasing the number of synapses between the photoreceptors and the protocerebrum. Descending neurons in flies produce precise, short-latency off responses which are induced by ocellar input (Haag et al., 2007). Furthermore, Parsons et al. (2006) and Haag et al. (2007) found that neurons in the fly brain that receive input from both the ocelli and the compound eyes, produced shorter latency responses for ocellar input compared with input from the compound eyes. Therefore, the depolarization observed in these protocerebral cells (Fig. 5) could represent excitatory input from the “regular” eye-to-protocerebrum pathway. In contrast, the precise “off” spike could be triggered by fast ocellar inputs, indicating that some protocerebral neurons represent a target of the convergence of visual information. However, ocellar neurons are not known to project into the anterior protocerebrum (Pan and Goodman, 1977; Milde, 1981; Strausfeld et al., 1998), generating the question of how this visual information could reach the protocerebral neurons. Alternatively, these neurons probably receive numerous inputs, some of which could be connected via gap junctions, evidenced by the variable level of subthreshold postsynaptic potential activity correlated with stimuli (Figs. 3, 5).
Notably, recordings in the locust medulla have reported highly precise spike times (on the order of <100 μs) (Osorio, 1987a). While the medulla neurons that we describe here appear to be less precise compared with the lobula and protocerebral neurons, it is likely that Osorio (1987a) recorded from a different population of medulla neurons. The medulla contains the largest amount of neurons in the optic lobes and comprises a wide range of different types of neurons (Osorio, 1987a,b; Paulk et al., 2009). We may be addressing a different population of medulla neurons because of the technique.
Whatever the underlying mechanism, the production of well timed highly precise spikes could have major implications for learning and memory (Bi and Poo, 1999). In the olfactory pathway neurons associated with the mushroom bodies demonstrate spike timing dependent plasticity (Mauelshagen, 1993; Li and Strausfeld, 1997; Menzel and Manz, 2005; Cassenaer and Laurent, 2007) and because the mushroom bodies receive massive input from and feed output into the lateral protocerebrum (for review, see Strausfeld et al., 1998), some of the plasticity observed in mushroom body neurons may be a result of interactions between the mushroom bodies and these highly precise and complex lateral protocerebral neurons.
The protocerebrum is a multimodal structure
Ultimately, the protocerebrum is a multimodal structure. In addition to visual information, olfactory and mechanosensory information are also sent to the lateral protocerebrum (Strausfeld, 1976; Maronde, 1991; Kirschner et al., 2006). Hence, many of the neurons in the lateral protocerebrum likely respond to these additional modalities, which may alter the temporal dynamics of the visual responses of lateral protocerebral neurons. The spatial information present in topographically arranged neuropils such as the retinotopic lamina, medulla, and (outer) lobula is most likely transformed in the glomerular protocerebrum, although the advantage of this arrangement is unknown. Visual information is functionally segregated in the protocerebrum, and this information is transformed from the retina to the protocerebrum, suggesting the protocerebrum may be key to understanding how bees navigate not only the visual scene but a natural world containing complex, interacting multimodal stimuli.
Footnotes
The project described was supported by Grant F31NS051123 from the National Institute of Neurological Disorders and Stroke to A.C.P. and National Science Foundation Grant IOB-0519483 to W.G. The content is solely the responsibility of the authors and does not necessarily represent the official views of the National Institute of Neurological Disorders and Stroke or the National Institutes of Health or the National Science Foundation. Research was additionally supported by National Institutes of Health Grant T32 AG007434 and by the Center for Insect Science, University of Arizona. We thank Thomas Christensen, Richard Levine, Charles Higgins, and Nicholas Strausfeld for helpful comments on this manuscript.
References
- Backhaus W. Color vision in honeybees. Neurosci Biobehav Rev. 1992;16:1–12. doi: 10.1016/s0149-7634(05)80045-4. [DOI] [PubMed] [Google Scholar]
- Backhaus W, Werner A, Menzel R. Color vision in honeybees: metric, dimensions, constancy, and ecological aspects. In: Menzel R, Mercer A, editors. Neurobiology and behavior of honeybees. New York: Springer; 1987. pp. 172–190. [Google Scholar]
- Baumann F, Hadjilazaro B. A depolarizing aftereffect of intense light in the drone visual system. Vis Res. 1972;12:17–31. doi: 10.1016/0042-6989(72)90134-4. [DOI] [PubMed] [Google Scholar]
- Bi G, Poo M. Distributed synaptic modification in neural networks induced by patterned stimulation. Nature. 1999;401:792–796. doi: 10.1038/44573. [DOI] [PubMed] [Google Scholar]
- Borst A, Haag J. Neural networks in the cockpit of the fly. J Comp Physiol A Neuroethol Sens Neural Behav Physiol. 2002;188:419–437. doi: 10.1007/s00359-002-0316-8. [DOI] [PubMed] [Google Scholar]
- Brockmann A, Robinson GE. Central projections of sensory systems involved in honey bee dance language communication. Brain Behav Evol. 2007;70:125–136. doi: 10.1159/000102974. [DOI] [PubMed] [Google Scholar]
- Cassenaer S, Laurent G. Hebbian STDP in mushroom bodies facilitates the synchronous flow of olfactory information in locusts. Nature. 2007;448:709–713. doi: 10.1038/nature05973. [DOI] [PubMed] [Google Scholar]
- Chittka L, Tautz J. The spectral input of honeybee visual odometry. J Exp Biol. 2003;206:2393–2397. doi: 10.1242/jeb.00436. [DOI] [PubMed] [Google Scholar]
- de Ruyter van Steveninck RR, Lewen GD, Strong SP, Koberle R, Bialek W. Reproducibility and variability in neural spike trains. Science. 1997;275:1805–1808. doi: 10.1126/science.275.5307.1805. [DOI] [PubMed] [Google Scholar]
- Dyer AG, Spaethe J, Prack S. Comparative psychophysics of bumblebee and honeybee colour discrimination and object detection. J Comp Physiol A Neuroethol Sens Neural Behav Physiol. 2008;194:617–627. doi: 10.1007/s00359-008-0335-1. [DOI] [PubMed] [Google Scholar]
- Ehmer B, Gronenberg W. Segregation of visual input to the mushroom bodies in the honeybee (Apis mellifera) J Comp Neurol. 2002;451:362–373. doi: 10.1002/cne.10355. [DOI] [PubMed] [Google Scholar]
- Fano U. Ionization yield of radiations. II. The fluctuations of the number of ions. Phys Rev. 1947;72:26–29. [Google Scholar]
- Gregory CE. The Bodian protargol technique. In: Strausfeld NJ, Miller TA, editors. Neuroanatomical techniques. New York: Springer; 1980. pp. 75–95. [Google Scholar]
- Gronenberg W. Subdivisions of hymenopteran mushroom body calyces by their afferent supply. J Comp Neurol. 2001;436:474–489. doi: 10.1002/cne.1045. [DOI] [PubMed] [Google Scholar]
- Haag J, Wertz A, Borst A. Integration of lobula plate output signals by DNOVS1, an identified premotor descending neuron. J Neurosci. 2007;27:1992–2000. doi: 10.1523/JNEUROSCI.4393-06.2007. [DOI] [PMC free article] [PubMed] [Google Scholar]
- Heinrich B. Cambridge, MA: Harvard UP; 1993. The hot blooded insects: strategies and mechanisms of insect thermoregulation. [Google Scholar]
- Heisenberg M. What do the mushroom bodies do for the insect brain? Learn Mem. 1998;5:1–10. [PMC free article] [PubMed] [Google Scholar]
- Heisenberg M. Mushroom body memoir: from maps to models. Nat Rev Neurosci. 2003;4:266–275. doi: 10.1038/nrn1074. [DOI] [PubMed] [Google Scholar]
- Hertel H. Chromatic properties of identified interneurons in the optic lobes of the bee. J Comp Physiol A Neuroethol Sens Neural Behav Physiol. 1980;137:215–231. [Google Scholar]
- Hertel H, Maronde U. The physiology and morphology of centrally projecting visual interneurons in the honeybee brain. J Exp Biol. 1987;133:301–315. [Google Scholar]
- Hertel H, Schäfer S, Maronde U. The physiology and morphology of visual commissures in the honeybee brain. J Exp Biol. 1987;133:283–300. [Google Scholar]
- Homberg U. Processing of antennal information in extrinsic mushroom body neurons of the bee brain. J Comp Physiol A Neuroethol Sens Neural Behav Physiol. 1984;154:825–836. [Google Scholar]
- Hubel DH, Livingstone MS. Segregation of form, color, and stereopsis in primate area 18. J Neurosci. 1987;7:3378–3415. doi: 10.1523/JNEUROSCI.07-11-03378.1987. [DOI] [PMC free article] [PubMed] [Google Scholar]
- Ibbotson MR. Evidence for velocity-tuned motion-sensitive descending neurons in the honeybee. Proc Biol Sci. 2001;268:2195–2201. doi: 10.1098/rspb.2001.1770. [DOI] [PMC free article] [PubMed] [Google Scholar]
- Jefferis GSXE, Potter CJ, Chan AM, Marin EC, Rohlfing T, Maurer CR, Jr, Luo L. Comprehensive maps of Drosophila higher olfactory centers: spatially segregated fruit and pheromone representation. Cell. 2007;128:1187–1203. doi: 10.1016/j.cell.2007.01.040. [DOI] [PMC free article] [PubMed] [Google Scholar]
- Kaiser W, Liske E. A preliminary report on the analysis of the optomotor system of the bee—behavioral studies with spectral lights. In: Wehner R, editor. Information processing in the visual systems of arthropods. New York: Springer; 1972. pp. 163–166. [Google Scholar]
- Kara P, Reinagel P, Reid RC. Low response variability in simultaneously recorded retinal, thalamic, and cortical neurons. Neuron. 2000;27:635–646. doi: 10.1016/s0896-6273(00)00072-6. [DOI] [PubMed] [Google Scholar]
- Kenyon FC. The brain of the bee. A preliminary contribution to the morphology of the nervous system of Arthropoda. J Comp Neurol. 1896;6:133–210. [Google Scholar]
- Kien J, Menzel R. Chromatic properties of interneurons in the optic lobes of the bee—I. Broad-band neurons. J Comp Physiol. 1977a;113:17–34. [Google Scholar]
- Kien J, Menzel R. Chromatic properties of interneurons in the optic lobes of the bee—II. Narrow band and color opponent neurons. J Comp Physiol. 1977b;113:35–53. [Google Scholar]
- Kirschner S, Kleineidam CJ, Zube C, Rybak J, Grünewald B, Rössler W. Dual olfactory pathway in the honeybee, Apis mellifera. J Comp Neurol. 2006;499:933–952. doi: 10.1002/cne.21158. [DOI] [PubMed] [Google Scholar]
- Krogh A, Zeuthen E. The mechanism of flight preparation in some insects. J Exp Biol. 1941;18:1–10. [Google Scholar]
- Kumbhani RD, Nolt MJ, Palmer LA. Precision, reliability, and information-theoretic analysis of visual thalamocortical neurons. J Neurophysiol. 2007;98:2647–2663. doi: 10.1152/jn.00900.2006. [DOI] [PubMed] [Google Scholar]
- Lennie P. Single units and visual cortical organization. Perception. 1998;27:889–935. doi: 10.1068/p270889. [DOI] [PubMed] [Google Scholar]
- Lennie P, Movshon JA. Coding of color and form in the geniculostriate visual pathway (invited review) J Opt Soc Am A Opt Image Sci Vis. 2005;22:2013–2033. doi: 10.1364/josaa.22.002013. [DOI] [PubMed] [Google Scholar]
- Li Y, Strausfeld NJ. Morphology and sensory modality of mushroom body extrinsic neurons in the brain of the cockroach, Periplaneta americana. J Comp Neurol. 1997;387:631–650. [PubMed] [Google Scholar]
- Liu G, Seiler H, Wen A, Zars T, Ito K, Wolf R, Heisenberg M, Liu L. Distinct memory traces for two visual features in the Drosophila brain. Nature. 2006;439:551–556. doi: 10.1038/nature04381. [DOI] [PubMed] [Google Scholar]
- Lotto RB, Chittka L. Seeing the light: Illumination as a contextual cue to color choice behavior in bumblebees. Proc Natl Acad Sci U S A. 2005;102:3852–3856. doi: 10.1073/pnas.0500681102. [DOI] [PMC free article] [PubMed] [Google Scholar]
- Lotto RB, Wicklein M. Bees encode behaviorally significant spectral relationships in complex scenes to resolve stimulus ambiguity. Proc Natl Acad Sci U S A. 2005;102:16870–16874. doi: 10.1073/pnas.0503773102. [DOI] [PMC free article] [PubMed] [Google Scholar]
- Mainen ZF, Sejnowski TJ. Reliability of spike timing in neocortical neurons. Science. 1995;268:1503–1506. doi: 10.1126/science.7770778. [DOI] [PubMed] [Google Scholar]
- Maronde U. Common projection areas of antennal and visual pathways in the honeybee brain, Apis mellifera. J Comp Neurol. 1991;309:328–340. doi: 10.1002/cne.903090304. [DOI] [PubMed] [Google Scholar]
- Mauelshagen J. Neural correlates of olfactory learning in an identified neuron in the honeybee brain. J Neurophysiol. 1993;69:609–625. doi: 10.1152/jn.1993.69.2.609. [DOI] [PubMed] [Google Scholar]
- Menzel R, Manz G. Neural plasticity of mushroom body-extrinsic neurons in the honeybee brain. J Exp Biol. 2005;208:4317–4332. doi: 10.1242/jeb.01908. [DOI] [PubMed] [Google Scholar]
- Milde J. Graded potentials and action potentials in the large ocellar interneurons of the bee. J Comp Physiol. 1981;143:427–434. [Google Scholar]
- Mobbs PG. The brain of the honeybee, Apis mellifera. I. The connections and spatial organization of the mushroom bodies. Philos Trans R Soc Lond B Biol Sci. 1982;298:309–354. [Google Scholar]
- Mobbs PG. Neural networks in the mushroom bodies of the honeybee. J Insect Physiol. 1984;30:43–58. [Google Scholar]
- Ney-Nifle M, Keasar T, Shmida A. Location and color learning in bumblebees in a two-phase conditioning experiment. J Insect Behav. 2001;14:697–711. [Google Scholar]
- Okamura JY, Strausfeld NJ. Visual system of calliphorid flies: motion- and orientation-sensitive visual interneurons supplying dorsal optic glomeruli. J Comp Neurol. 2007;500:189–208. doi: 10.1002/cne.21195. [DOI] [PubMed] [Google Scholar]
- Osorio D. The temporal properties of non-linear, transient cells in the locust medulla. J Comp Physiol A Neuroethol Sens Neural Behav Physiol. 1987a;161:431–440. [Google Scholar]
- Osorio D. Temporal and spectral properties of sustaining cells in the medulla of the locust. J Comp Physiol A Neuroethol Sens Neural Behav Physiol. 1987b;161:441–448. [Google Scholar]
- Otsuna H, Ito K. Systematic analysis of the visual projection neurons of Drosophila melanogaster. I. Lobula-specific pathways. J Comp Neurol. 2006;497:928–958. doi: 10.1002/cne.21015. [DOI] [PubMed] [Google Scholar]
- Pan KC, Goodman LJ. Ocellar projections within the central nervous system of the worker honeybee (Apis mellifera) Cell Tissue Res. 1977;176:505–527. doi: 10.1007/BF00231405. [DOI] [PubMed] [Google Scholar]
- Parsons MM, Krapp HG, Laughlin SB. A motion-sensitive neurone responds to signals from the two visual systems of the blowfly, the compound eyes and ocelli. J Exp Biol. 2006;209:4464–4474. doi: 10.1242/jeb.02560. [DOI] [PubMed] [Google Scholar]
- Paulk AC, Gronenberg W. Higher order visual input to the mushroom bodies in the bee, Bombus impatiens. Arthropod Struct Dev. 2008;37:443–458. doi: 10.1016/j.asd.2008.03.002. [DOI] [PMC free article] [PubMed] [Google Scholar]
- Paulk AC, Phillips-Portillo J, Dacks AM, Fellous JM, Gronenberg W. The processing of color, motion, and stimulus timing are anatomically segregated in the bumblebee brain. J Neurosci. 2008;28:6319–6332. doi: 10.1523/JNEUROSCI.1196-08.2008. [DOI] [PMC free article] [PubMed] [Google Scholar]
- Paulk AC, Dacks AM, Gronenberg W. Color processing in the medulla of the bumblebee (Apidae: Bombus impatiens) J Comp Neurol. 2009;513:441–456. doi: 10.1002/cne.21993. [DOI] [PMC free article] [PubMed] [Google Scholar]
- Peitsch D, Feitz A, Hertel H, de Souza J, Ventura DF, Menzel R. The spectral input systems of hymenopteran insects and their receptor-based colour vision. J Comp Physiol A Neuroethol Sens Neural Behav Physiol. 1992;170:23–40. doi: 10.1007/BF00190398. [DOI] [PubMed] [Google Scholar]
- Ribi WA. The first optic ganglion of the bee. I. Correlation between visual cell types and their terminals in the lamina and medulla. Cell Tissue Res. 1975a;165:103–111. doi: 10.1007/BF00222803. [DOI] [PubMed] [Google Scholar]
- Ribi WA. The neurons in the first optic ganglion of the bee (Apis mellifera) Adv Anat Embryol Cell Biol. 1975b;50:1–43. [PubMed] [Google Scholar]
- Ribi WA, Scheel M. The second and third optic ganglia of the worker bee: Golgi studies of the neuronal elements in the medulla and lobula. Cell Tissue Res. 1981;221:17–43. doi: 10.1007/BF00216567. [DOI] [PubMed] [Google Scholar]
- Rind FC. A chemical synapse between two motion detecting neurons in the locust brain. J Exp Biol. 1984;110:143–167. doi: 10.1242/jeb.110.1.143. [DOI] [PubMed] [Google Scholar]
- Rybak J, Menzel R. Anatomy of the mushroom bodies in the honey bee brain: the neuronal connections of the alpha-lobe. J Comp Neurol. 1993;334:444–465. doi: 10.1002/cne.903340309. [DOI] [PubMed] [Google Scholar]
- Schildberger K. Temporal selectivity of identified auditory neurons in the cricket brain. J Comp Physiol A Neuroethol Sens Neural Behav Physiol. 1984;155:171–185. [Google Scholar]
- Schreiber S, Fellous JM, Whitmer D, Tiesinga P, Sejnowski TJ. A new correlation-based measure of spike timing reliability. Neurocomputing. 2003;52–54:925–931. doi: 10.1016/S0925-2312(02)00838-X. [DOI] [PMC free article] [PubMed] [Google Scholar]
- Srinivasan MV, Lehrer M. Temporal resolution of colour vision in the honeybee. J Comp Physiol A Neuroethol Sens Neural Behav Physiol. 1985;157:579–586. doi: 10.1007/BF01351352. [DOI] [PubMed] [Google Scholar]
- Strausfeld NJ. New York: Springer; 1976. Atlas of an insect brain. [Google Scholar]
- Strausfeld NJ. Organization of the honey bee mushroom body: representation of the calyx within the vertical and gamma lobes. J Comp Neurol. 2002;450:4–33. doi: 10.1002/cne.10285. [DOI] [PubMed] [Google Scholar]
- Strausfeld NJ, Okamura JY. Visual system of calliphorid flies: organization of optic glomeruli and their lobula complex efferents. J Comp Neurol. 2007;500:166–188. doi: 10.1002/cne.21196. [DOI] [PubMed] [Google Scholar]
- Strausfeld NJ, Hansen L, Li Y, Gomez RS, Ito K. Evolution, discovery, and interpretation of arthropod mushroom bodies. Learn Mem. 1998;5:11–37. [PMC free article] [PubMed] [Google Scholar]
- Strausfeld NJ, Sinakevitch I, Okamura JY. Organization of local interneurons in optic glomeruli of the dipterous visual system and comparisons with the antennal lobes. Dev Neurobiol. 2007;67:1267–1288. doi: 10.1002/dneu.20396. [DOI] [PubMed] [Google Scholar]
- Straw AD, Warrant EJ, O'Carroll DC. A ‘bright zone’ in male hoverfly (Eristalis tenax) eyes and associated faster motion detection and increased contrast sensitivity. J Exp Biol. 2006;209:4339–4354. doi: 10.1242/jeb.02517. [DOI] [PubMed] [Google Scholar]
- Strong SP, de Ruyter van Steveninck RR, Bialek W, Koberle R. On the application of information theory to neural spike trains. Pac Symp Biocomput. 1998;1998:621–632. [PubMed] [Google Scholar]
- Tanaka NK, Awasaki T, Shimada T, Ito K. Integration of chemosensory pathways in the Drosophila second-order olfactory centers. Curr Biol. 2004;14:449–457. doi: 10.1016/j.cub.2004.03.006. [DOI] [PubMed] [Google Scholar]
- Teich MC, Turcott RG, Siegel RM. Temporal correlation in cat striate-cortex neural spike trains. IEE Eng Med Biol. 1996;15:79–87. [Google Scholar]
- Tiesinga PHE, Fellous JM, Sejnowski TJ. Regulation of spike timing in visual cortical circuits. Nat Rev Neurosci. 2008;9:97–107. doi: 10.1038/nrn2315. [DOI] [PMC free article] [PubMed] [Google Scholar]
- Victor JD. Binless strategies for estimation of information from neural data. Phys Rev E Stat Nonlin Soft Matter Phys. 2002;66 doi: 10.1103/PhysRevE.66.051903. 051903. [DOI] [PubMed] [Google Scholar]
- Warzecha AK, Egelhaaf M. Variability in spike trains during constant and dynamic stimulation. Science. 1999;283:1927–1930. doi: 10.1126/science.283.5409.1927. [DOI] [PubMed] [Google Scholar]
- Yang EC, Lin HC, Hung YS. Patterns of chromatic information processing in the lobula of the honeybee, Apis mellifera L. J Insect Physiol. 2004;50:913–925. doi: 10.1016/j.jinsphys.2004.06.010. [DOI] [PubMed] [Google Scholar]