Abstract
The clinical manifestations of diabetic nephropathy, proteinuria, increasing blood pressure, decreased glomerular filtration rate and are similar in type 1 and type 2 diabetes; however the renal lesions underlying renal dysfunction in the two conditions may differ. Indeed, although tubular, interstitial and arteriolar lesions are ultimately present in type 1 diabetes, as the disease progresses, the most important structural changes involve the glomerulus. In contrast, a substantial subset of type 2 diabetic patients, despite the presence of microalbuminuria or proteinuria, have normal glomerular structure with or without tubulo-interstitial and/or arteriolar abnormalities. The clinical manifestations of diabetic nephropathy are strongly related to the structural changes, especially with the degree of mesangial expansion in both type 1 and type 2 diabetes. However, several other important structural changes are involved. Previous studies using light and electron microscopic morphometric analysis have described the renal structural changes and the structural-functional relationships of diabetic nephropathy. This review focuses on these topics, emphasizing the contribution of research kidney biopsy studies to the understanding of the pathogenesis of diabetic nephropathy and the identification of patients with higher risk of progression to end stage renal disease. Finally, the evidence is presented that reversal of the established lesions of diabetic nephropathy is possible.
Keywords: diabetic nephropathy, kidney biopsy, mesangial expansion, morphometric analysis, glomerular basement membrane
The Histology of Progressive Diabetic Nephropathy
The constellation of the renal structural lesions occurring in diabetes is unique, although each of these lesions can be individually observed in other renal disorders. The morphologic lesions in type 1 diabetes (T1DM), predominantly affect the glomeruli, with thickening of glomerular basement membrane (GBM) and mesangial expansion, although also the podocytes, renal tubules, interstitium and arterioles undergo substantial changes, especially at later stages of disease (1–5).
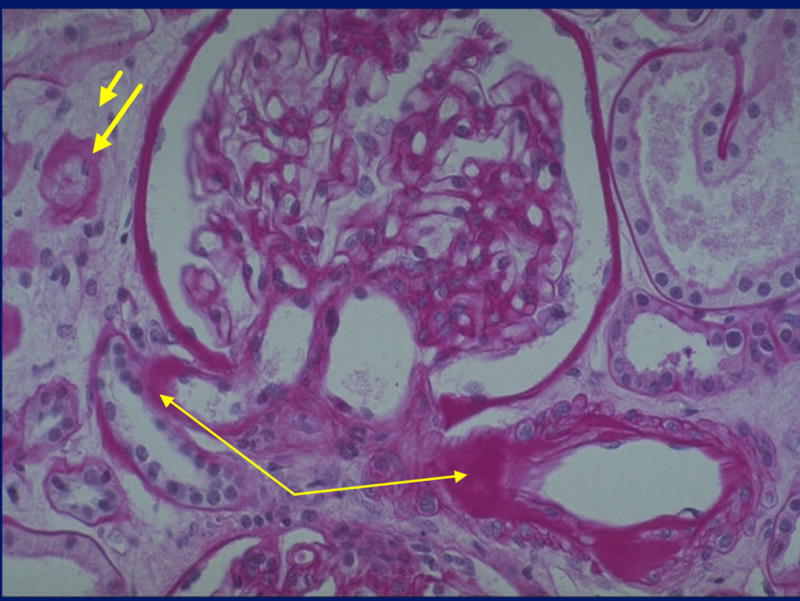
GBM thickening, the first measurable change, has been detected as early as 1.5 to 2.5 years after the onset of T1DM (6, 7). Thickening of tubular basement membrane (TBM) closely parallels that of GBM thickening, implying that glomerular hemodynamic perturbations are not required for these changes to occur (3). Mesangial expansion, predominantly due to an increase in mesangial matrix, develops later although an increase in the matrix component of the mesangium can be detected as early as 5–7 years after the onset of diabetes (8–10). Thereafter, these structural changes do not necessarily develop at the same rate in the individual patients (11). In fact, while GBM thickening may develop steadily over time, mesangial expansion has a more asymptotic relationship with T1DM duration (Steinke J, Mauer M, unpublished observations). However, when renal insufficiency occurs, marked mesangial expansion and increased GBM width are present in virtually all T1DM patients (9–10). Diffuse mesangial expansion, commonly termed diffuse diabetic glomerulosclerosis, can be associated with nodular lesions consisting of areas of marked mesangial expansion forming large round fibrillar mesangial zones with palisading of mesangial nuclei around the periphery of the nodule and compression of the associated glomerular capillaries (Kimmelstiel-Wilson nodules) (Figures 1 and 2). Both mesangial expansion and GBM and TBM thickening are a consequence of extracellular matrix (ECM) accumulation, with increased deposition of the normal ECM local components of types IV and VI collagen, laminin and fibronectin (12–13) due to their increased production, decreased degradation or both. In contrast to the mesangium, initial interstitial expansion is primarily due to an increase in the cellular component of this renal compartment (14); increase in fibrillar collagen is, in fact, a relatively late finding in this disease, measurable only in patients with an already established decline in glomerular filtration rate (GFR) (14).
Figure 1.
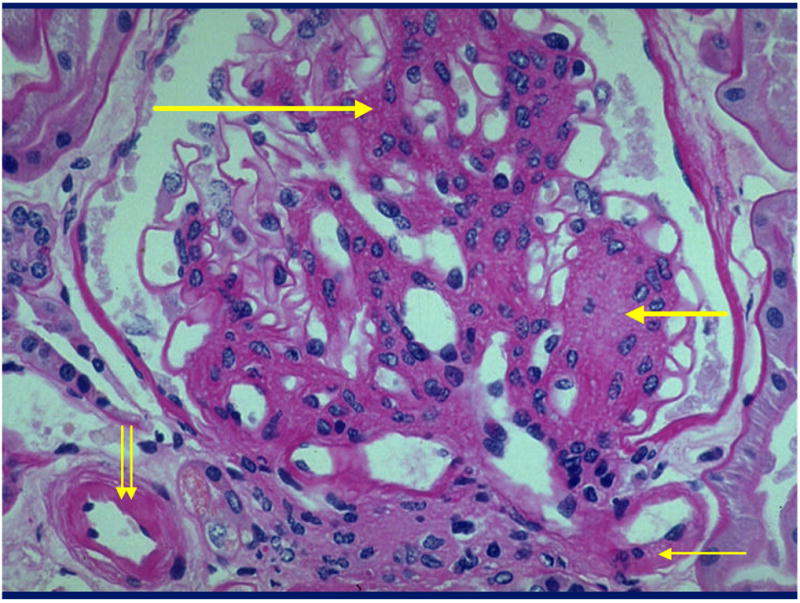
Glomerulus from a type 1 diabetic (T1DM) patient with diffuse (long thick arrow) and nodular (short thick arrow) mesangial expansion and afferent (double thin arrows) and efferent (single thin arrow) arteriolar hyalinosis [Periodic Acid Schiff’s (PAS) stain].
Figure 2.
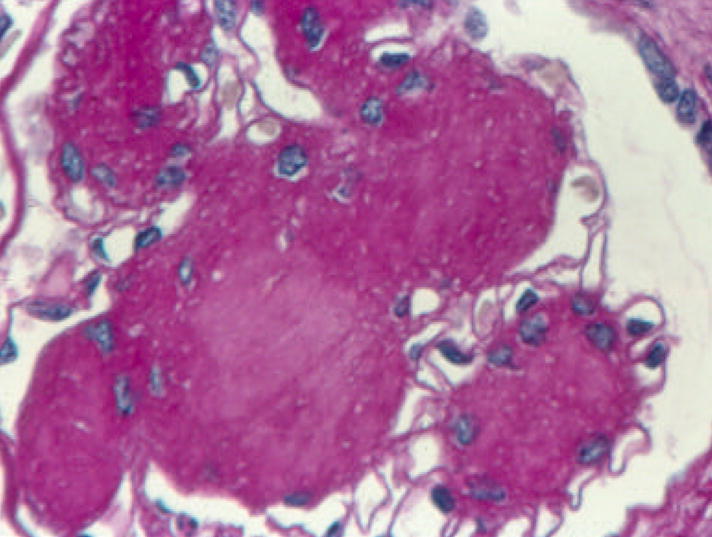
Glomerulus from a T1DM patient with nodular (Kimmelstiel-Wilson) lesions. Note the palisading of nuclei at the periphery of the nodules, the central matrix accumulation, and the restriction of the surrounding glomerular capillaries (PAS). Reprinted with permission from: Parving H-H, Mauer M, Ritz E. Diabetic nephropathy. In: Brenner & Rector’s The Kidney, 7th Ed., Bremer BM (Ed). Saunders, Elsevier’s Health Sciences Department, Philadelphia, 2004, pp. 1777–1818.
Afferent and efferent arteriolar hyalinosis (Figure 1) may be present within a few years after diabetes onset (5). This exudative lesion which plasma proteins, especially immunoglobulins, complement, fibrinogen and albumin may ultimately replace the smooth muscle cells and the severity of arteriolar hyalinosis is significantly correlated with percent sclerosed glomeruli (5), suggesting that this vascular lesion could contribute to schemic global glomerular sclerosis. Similar lesions may occur of as yet unstudied clinical significance in the glomerular subendothelial space (hyaline caps) and along the parietal surface of Bowman’s capsule (capsular drops) (Figures 3c and 3d).
Figure 3.
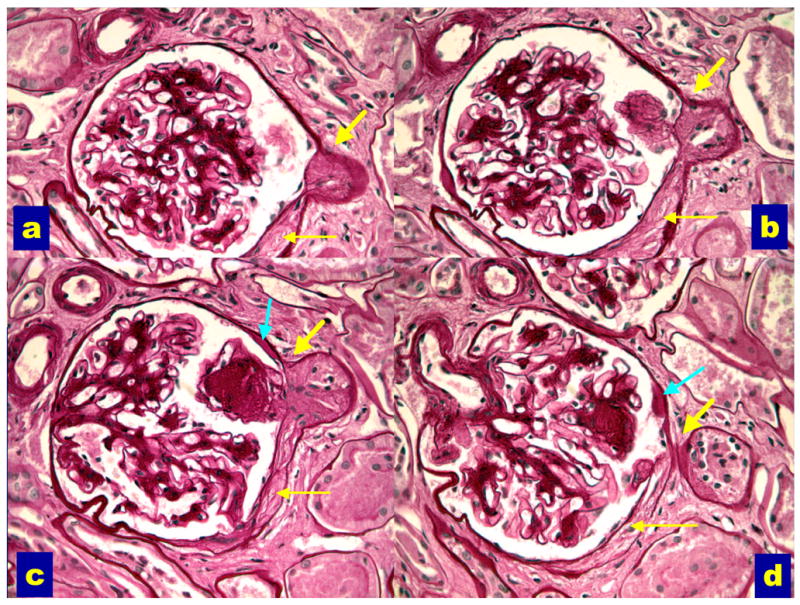
Serial sections through a glomerulus with an abnormal glomerular tubular junction with no observable glomerular opening (ATNO) into the proximal tubule (thick yellow arrows). Note the associated Bowman’s capsule abnormalities (thin yellow arrows) and the adhesion of a nodular lesion at the GTJ (images b and c). Acapsular drop (teal arrows, images c and d) is also present (PAS). Reprinted with permission from J Am Soc Nephrol 14:908–917, 2003.
Abnormalities of the glomerular-tubular junction (GTJA) as late manifestations of the disease (15), predominantly in patients with proteinuria (16), with focal adhesions, obstruction of the proximal tubular take-off from the glomerulus detachment of the tubule from the glomerulus (atubular glomerulus). We classified the GTJA as: normal tubules (NT), atrophic tubules (AT) or atubular glomeruli (AG) when no tubular connection was observed. AT were subcategorized as short atrophic tubules (SAT), with atrophy of the first few proximal tubular cells; long atrophic tubules (LAT) with atrophy over a longer segment of proximal tubule and atrophic tubules with no observable glomerular opening (ATNO) where no connection between glomerular urinary space and proximal tubular lumen could be discerned (Figure 3). AG have open circulation, but with no tubular attachment are presumably non-functioning. GTJA were often associated with tip lesions, i.e., focal segmental glomerulosclerosis (FSGS) lesions at or near the GTJ (Figures 3a, 3b, and 3c) (15, 16). Tip lesions were present in all SAT, 64% of LAT, 82% of ATNO and 9% of NT, while they were never observed in normal subjects. GTJA were almost entirely restricted to proteinuric patients, being rare in normoalbuminuric (NA) or microalbuminuric patients (MA) (16). Moreover, FSGS lesions, also rare in NA and MA patients, had a marked predilection for the GTJ and were uncommon at other locations. Interestingly, the lesions at the GTJ were inversely correlated with GFR (15, 16) and thus, should be added to the constellation of lesions contributing to the loss of renal function in T1DM.
These various lesions of diabetic nephropathology progress at varying rates within and between T1DM patients, and, as discussed below, this is even more the case in type 2 diabetes (T2DM). For example, GBM width and Vv(Mes/glom) are significantly but not very precisely correlated with one another; with some patients have relatively marked GBM thickening without much mesangial expansion and others the countrary (9). Marked renal extracellular basement membrane accumulation resulting in extreme mesangial expansion and GBM thickening are present in the vast majority of T1DM patients who develop overt diabetic nephropathy (DN) manifesting as proteinuria, hypertension, and declining GFR (8, 17). Ultimately, focal and global glomerulosclerosis, tubular atrophy, interstitial expansion and GTJA facilitate this downward spiral. However, tubulo-interstitial lesions and GTJA contribute only ≈10–15% to functional loss in T1DM patients whose GFR is above 40 ml/min/1.73m2 (16). Tubulo-interstitial disease may be more important in the progression from moderate renal insufficiency to end-stage renal disease (ESRD) (18), but it is probably a mistake to extrapolate this to earlier stages of DN progression.
The situation in T2DM is more complex. Parving et al (19) described a high prevalence of non-diabetic glomerular diseases in Danish T2DM patients with proteinuria undergoing clinical renal biopsies; 23% had a variety of glomerulopathies including “minimal lesion nephropathy,” chronic glomerulonephritis, and mesangial proliferative glomerulonephritis alone or superimposed to diabetic structural abnormalities. Lipkin et al. (20) described that only 50 of 82 T2DM diabetic patients with nephropathy had typical diabetic glomerulopathy; similarly Gambara et al (21) found that 33% of proteinuric T2DM patients had glomerular disease superimposed on diabetic glomerulosclerosis, although more recently the same group reported that non-diabetic glomerulopathies occurred only in 18% of T2DM patients with proteinuria (22). In the study of Olsen (23) only 12% of the proteinuric patients had non-diabetic renal diseases. Thus, the real frequency of non-diabetic renal diseases among patients with T2DM and proteinuria is difficult to assess in studies of which patients biopsied for clinical reasons because of selection bias towards atypical cases; the broad variability described above is likely to be related to the different biopsy policies adopted, as recently discussed by Mazzucco et al (24).
We performed renal function studies and research renal biopsies in a large cohort of T2DM patients with MA and proteinuria and described marked heterogeneity in renal structure among these patients; in fact, only a minority subset had DN patterns typical of those seen in T1DM patients; the remaining had mild or absent diabetic glomerulopathy with (Figures 4 and 5) or without tubulo-interstitial, arteriolar and global glomerulosclerosis changes (25). Less than 10% of our proteinuria patients had non-diabetic renal diseases. Based on these observations, we proposed a classification system which included 3 major categories (25):
Figure 4.
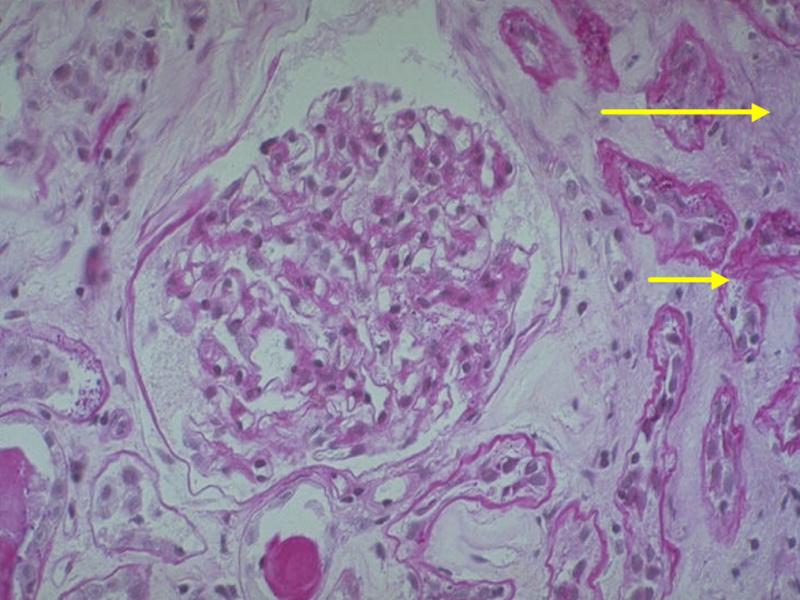
Renal biopsy from a T2DM patient with mild mesangial expansion relative to the severity of interstitial fibrosis (long arrow) and tubular atrophy (short arrow). This would be classified as Category III (PAS).
Figure 5.
Renal biopsy from a T2DM patient with hyalinosis of the afferent (right thin arrow) and efferent (left thin arrow) glomerular arterioles, interstitial expansion (short thick arrow) and tubular atrophy (long thick arrow). This would be classified as Category III (PAS).
Category C I: Normal or near normal renal structure
These patients (35% of MA and 15% of proteinuria) had normal renal biopsies or showed very mild glomerular, tubular, interstitial and/or vascular changes.
Category C II: Typical diabetic nephropathology
These patients (30% of MA and 50% of proteinuria) had established diabetic lesions with an approximately balanced severity of glomerular, tubulo-interstitial and arteriolar changes, a picture typical of that seen in most T1DM patients with obvious light microscopic DN changes.
Category C III: Atypical patterns of renal injury(Figures 4 and 5)
These patients (35% of MA and proteinuria) had relatively mild diabetic glomerular changes considering disproportionately severe: (a) Tubular atrophy, TBM thickening and reduplication and interstitial fibrosis (tubulo-interstitial lesions). (b) Advanced glomerular arteriolar hyalinosis commonly associated with atherosclerosis of larger vessels. (c) Global glomerular sclerosis. In C III group these patterns were present in all possible combinations. More recently, examining the associations of albumin excretion rates (AER) and electron microscopic morphometrically quantitated DN lesions, we could mathematically define a spatial cluster of structural/functional relationships which contained the T1DM patients. About 1/3 of the T2DM fell outside of this cluster because of MA or proteinuria despite a paucity of diabetic glomerulopathy lesions (26). These objective data largely confirm the more subjective categorical classifications.
Thus, hyperglycaemia may cause different patterns of renal injury in T1DM compared to T2DM patients. Alternatively, the disproportionate tubulo-interstitial, glomerulosclerotic and vascular changes of T2DM could also be related to aging, atherosclerosis and systemic hypertension. However, it is also possible that the T2DM heterogeneity in renal structure might reflect the heterogeneous nature of T2DM. The natural history of MA and proteinuria T2DM patients with minimal or no renal lesions is not yet well understood, however, GFR loss in the relatively short-term (about 3 years), is largely confined to T2DM research patients with mesangial expansion (27).
Morphometric analysis and structural-functional relationships
The relationships between structural abnormalities and kidney function are best defined using light and electron microscopic morphometric analysis. The critical lesion in T1DM is mesangial expansion, morphometrically termed mesangial fractional volume [Vv(Mes/glom)] (the fraction of the cross-sectional area of the glomerular tuft made up by mesangium); this is the electron microscopically estimated structural parameter that best correlates with all functional parameters in T1DM (9, 17). Indeed, a highly significant inverse correlation exists between Vv(Mes/glom) and GFR (9, 15–17); when mesangium expands it restricts and distorts glomerular capillaries and diminishes capillary filtration surface (9), which is strongly directly related to Vv(Mes/glom) and inversely to GFR (28). Vv(Mes/glom) is also related to AER (9, 15–17, 29) and blood pressure levels (30). In contrast, GBM thickening is closely related to AER and less so to GFR or hypertension, suggesting that this lesion is a closer surrogate to the pathogenesis of albuminuria. Interstitial expansion and percentage of global sclerosis are also directly related to proteinuria, hypertension and inversely to GFR (4, 5, 9, 15, 16). However, our studies in a small number of T1DM patients studied with sequential renal biopsies about 5 years apart, indicate that progression from NA to MA and from MA to proteinuria was primarily related to progressive mesangial expansion (11); in contrast there was no significant progression in interstitial fibrosis or GBM thickening over this time period. These data may initially seem contradictory to recent studies describing that greater GBM width at baseline biopsy was predictive of AER after 5 or 6 years of follow-up (31, 32). However, given the linear course of GBM thickening vs. the non-linear trajectory of mesangial expansion, it is not surprising that GBM width, a strong correlate of AER, is a better predictor of DN risk while mesangial expansion, through its intimate relationship with filtration surface, better defines the clinical course of those destined to develop severe diabetic kidney disease.
Although an increase in AER to the MA range is usually considered the first clinical expression of DN, some long-term T1DM patients have reduced GFR as initial indicator of renal disease (33). Thus, T1DM patients, most often females with diabetic retinopathy and/or hypertension, may still be NA despite reduced GFR. These patients have significantly more advanced diabetic glomerulopathy lesions than the NA patients with normal GFR (33). This situation of “normoalbuminuria with renal dysfunction” has also been seen in T2DM patients (34); in this study 39% of NA T2DM patients, a majority of whom were women, had an estimated GFR lower than 60 ml/min (34).
As alluded to above, through much of the natural history of DN lesions develop in complete clinical silence. When persistent MA and proteinuria supervene, lesions are often far advanced and loss of GFR may then progress relatively rapidly toward ESRD. This typical clinical story is best described by non-linear analyses of structural-functional relationships (16). Using simple linear regression models, glomerular structural variables explained about 65% of AER and 35% of GFR variability among T1DM patients (17). However, using piecewise (spline) regression models, glomerular structural variables alone, GBM width, [Vv(Mes/glom), and total filtration surface per glomerulus or TFS], explained 95% of variability in AER ranging from NA to proteinuria. These same glomerular structures, however, explained only 78% of GFR variability in this study, and this increased to 92% with the addition of indices of GTJA and interstitial expansion (16).
In summary, most of the AER and GFR changes in T1DM are explained by diabetic glomerulopathy lesions and these structural-functional relationships are largely driven by patients with more advanced lesions and clinical functional abnormalities while structure is highly variable (from virtually none to moderate severity) in patients without functional abnormalities. In the end, as in other slowly progressive renal diseases, clinical findings in DN may, at least in part, reflect the lesions outstripping of renal compensatory capacities and this may be mirrored in the non-linear analyses described above.
Our findings in T2DM confirm that mesangial expansion is a crucial structural change leading to loss of renal function in diabetes; AER is directly related to both GBM width (r=0.47) and Vv(Mes/glom) (r=0.44), but GFR is inversely related only to Vv(Mes/glom) (r=0.47) (Fioretto P, unpublished data). Although these structural-functional relationships are highly statistically significant, they are less precise than in T1DM. Moreover, confirming our observations from light microscopic studies (25, 26), glomerular lesions are less advanced in T1DM than T2DM patients and a substantial number of T2DM patients had normal glomerular structure despite abnormal AER. These data are in agreement with those in Pima Indians, where global glomerular sclerosis, Vv(interstitium) and GBM width were similar in patients with long-term T2DM with NA and those with MA; only Vv(Mes/glom) increased from early diabetes to MA (35). Ultrastructural glomerular parameters in these patients were significantly abnormal only in patients with clinical nephropathy (35). While Hayashi H et al (36) reported renal structural-functional relationships in T2DM patients similar to those observed in T1DM, Østerby et al described great variability in glomerular injury in Danish T2DM patients with proteinuria; they also concluded that T2DM patients often had less marked glomerular changes than T1DM patients with comparable renal function (37). As already noted above, our cluster analysis studies argue that this greater structural/functional heterogeneity represents increased AER in a substantial subset of T2DM patients which is, at least in part, unexplained by the classical DN lesions which is of obscure pathogenetic origin (26). The prognostic relevance of increased AER in this subset of T2DM patients is not yet fully described.
Nonetheless, the heterogeneity in renal structure is related to the risk of progressive GFR loss (27). Indeed GFR decline over 4 years of follow-up in T2DM diabetic patients with MA and proteinuria was significantly correlated with the severity of mesangial expansion and GBM thickening (27). These findings may, in part, explain why treatment trials have shown less dramatic benefits in proteinuric T2DM (38, 39) than T1DM (40) subjects. Thus, greater randomization of substantial numbers of proteinuric subjects who are slow progressors or non-progressors to both treatment arms would necessarily blunt a study’s ability to demonstrate treatment effects. This could be mitigated somewhat by the exclusion at study entry or through subset analyses of T2DM patients without diabetic retinopathy, as these subjects are more likely to have increases in AER levels disproportionate to their diabetic glomerular lesions (25).
Role of podocytes in diabetic nephropathy
The glomerular filtration barrier is composed of fenestrated endothelium, GBM, podocyte foot processes and slit diaphragms. Compromise of one or more elements of this filtration complex leads to proteinuria (41). Podocyte detachment from GBM, from apoptosis, necrosis or loss of adhesive interaction may play a central role in the pathogenesis of several proteinuric diseases; in fact proteinuria in glomerular disorders is ultimately associated with foot process effacement, flattening and retraction (42) although these changes may not be present at the initiation of the glomerular barrier alteration or injury (41). Podocytes are injured in numerous experimental and human glomerular disorders, including minimal-change disease, FSGS, collapsing glomerulopathy, lupus nephritis and DN (42, 43).
The understanding of the role of podocytes in DN is increasing in recent years, although definitive conclusions have not been reached. Although it is well known that podocyte foot process width increases and slit pore length per GBM surface area decreases with increasing urinary protein excretion in diabetes (44–46), recent studies have documented that podocyte shape changes, albeit subtle, are already present in NA young T1DM subjects (47) perhaps consistent with an early role for this cell in the pathogenesis of diabetic glomerulopathy. This may not have been detectable in earlier studies (45) because of confounding of the normal control group with cadaver kidney donor material which may evidence increased foot process width compared to biopsies obtained in situ from normal living kidney donors (47 and Mauer M, unpublished data). Podocyte detachment from GBM, which may also be an early phenomenon in patients with T1DM, worsens with increasing albuminuria (44) and could be responsible for podocyte loss and decreased podocyte number (see below).
White et al. (48) observed similar numbers of podocytes in normal subjects and in T1DM patients with abnormal AER, although there was a trend towards fewer podocytes per glomerulus in the diabetic patients. This study, moreover, found no statistically significant correlation between podocyte number and AER. These findings are in contrast with those in earlier T1DM studies (49) which reported decreased podocyte number in patients with normal AER, when compared to normal controls, thus suggesting that diabetes per se may adversely affect podocyte reproduction, survival, or both. Low podocyte number has also been described also in proteinuric T2DM Pima Indian patients (35). The authors’ hypothesis that podocyte loss and increased foot process width could play a role in the progression to overt nephropathy was supported in their subsequent longitudinal study where T2DM MA Pima Indian subjects were studied over 4 years (50); a greater reduction in the number of podocytes per glomerulus at baseline in these MA subjects predicted a higher risk of progression to overt nephropathy (50). This variable was a slightly stronger predictor than mesangial fractional volume in these subjects, although were a head-to-head comparison of these two variables carried out, it is likely that these would be statistically similarly powerful predictors (50).
MA and proteinuric Caucasian T2DM patients that we studied also had decreased length density of filtration slits (FSLv/glom), and increased foot process width over the peripheral GBM compared to NA subjects (51). AER was inversely related to podocyte numerical density [Nv(epi/glom)] and FSLv/glom and directly to foot process width, while there was no statistically significant correlation with podocyte number per glomerulus [Epi N/glom]. GFR was weakly co-related to FSLv/glom, but not to any other podocyte variable. Several patients with abnormal AER had normal Vv(Mes/glom) (≤0.25). We compared their podocyte structure to that of NA patients who also had normal Vv(Mes/glom). Patients with abnormal AER had lower Nv(epi/glom) and FSLv/glom and greater foot process width than NA patients with the similar Vv(Mes/glom). Thus, changes in podocyte structure and density occur at the early stages of DN in Caucasian T2DM patients and might contribute to increasing albuminuria in these patients. Moreover, podocyte structural changes could in part explain or result from increased albuminuria in patients without classical diabetic glomerulopathy.
Podocytes probably have limited capacity to replicate. Podocyte loss, along with the increase in glomerular volume which may occur in diabetes, would necessarily require the residual podocytes to cover a larger area of GBM. This might facilitate podocyte detachment resulting in bare GBM areas with consequent proteinuria. Moreover, these areas of detachment could initiate adhesions and potential starting points for GTJA and focal or global glomerular sclerosis.
Risk factors for diabetic nephropathy
Although it is clear that genetic factors modulate DN risk and that some patients escape this complication despite decades of poor glycemic control, it is also clear that hyperglycemia is a necessary precondition for DN lesions and renal functional disturbances to develop. Important support for this concept derives from research kidney biopsies in identical twins discordant for T1DM. The kidneys of all of the nondiabetic members of these twin pairs were structurally normal, and in each instance GBM and mesangial measures were greater in the diabetic twin of the pair (52). Several diabetic twins had values for GBM width and Vv(Mes/glom) that were still within the range of normal and thus, diabetic, had changes only in comparison with their nondiabetic twin, whereas others had more severe lesions (52). Thus, given sufficient duration, probably all T1DM patients have structural changes that are similar in their direction but vary markedly between individuals in the rate at which these lesions develop. The marked variability in the rate of development of kidney lesions of DN in transplanted kidneys was not fully explained by glycemia (53). Since all the recipients had ESRD secondary to DN in their native kidneys, the absence of detectable disease recurrence in some renal allografts is consistent with intrinsic renal tissue susceptibility to the diabetic state which may be genetically determined.
Variability in glomerular volume and number could also be structural determinants of nephropathy risk. Mean glomerular volumes were lower in patients developing DN after 15 years of T1DM compared to a group that developed nephropathy after at least 25 years (54). Thus, glomerular volume increases as mesangial expansion develops and that patients unable to respond to mesangial expansion with glomerular enlargement may thus more quickly loose filtration surface and develop overt nephropathy than those whose glomeruli enlarge. The number of glomeruli per kidney can vary markedly among normal individuals and among diabetic patients (55) and it has been suggested that fewer glomeruli per kidney could be a risk factor for the development of DN (56). However, T1DM transplant recipients, having a single kidney, do not have accelerated development of diabetic renal lesions compared to T1DM patients with two native kidneys (Chang S, Caramori ML, Moriya R, Mauer M, unpublished results). Although of unproven importance in the genesis of DN, reduced glomerular number could result in more rapid progression to ESRD once advanced lesions and overt DN had developed.
Several studies have demonstrated that DN risk clusters in families. Seaquist et al (57) discovered that DN occurred only in two of the 12 T1DM diabetic siblings of the probands free of DN while 82% of siblings of probands with DN had evidence of diabetic renal disease. These findings have been largely confirmed both in T1DM and T2DM patients (58–61).
We studied glomerular structure in T1DM sibling pairs and described that the concordance of nephropathy among these pairs was based on concordance in glomerular lesions (62). In fact, the strongest predictor of glomerular structure in the diabetic sibling was glomerular structure in the diabetic proband (61). Not only was the severity of individual glomerular lesions highly correlated, but also the patterns of glomerular lesions were also similar; for example, if one sibling had relatively greater increase in GBM width compared to mesangial matrix fractional volume [Vv(MM/glom)], the other sibling was more likely to have the same pattern (62). In the same cohort, Na/H antiport activity in cultured skin fibroblasts, known to be associated with DN risk (63), was strongly correlated among sibling pairs (64). These data support a strong genetic basis for DN and pathogenesis and risk.
Several candidate genes for diabetic nephropathy risk or protection have been proposed including genes involved in glucose metabolism, extracellular matrix synthesis and degradation the renin-angiotensin system and other pathways (65). Polymorphism of genes related to the renin-angiotensin system have been suggested in many studies to be involved in conferring susceptibility for both onset and progression of DN; the D allele of angiotensin converting enzyme-1 is associated with diabetic nephropathy in both T1DM and T2DM patients (66). We studied the relationships between the I/D polymorphism of the ACE gene and diabetic glomerulopathy in a large group of T2DM patients with abnormal AER (67). Although renal function was not significantly different among patients with II, ID or DD genotype, diabetic glomerulopathy was more severe in DD patients. Moreover, subdivided in tertiles of increasing values of GBM width and mesangial matrix fractional volume, the DD carriers had an OR of 6.11 (CI: 1.84–20.3) and 10.67 (CI: 2.51–45.36) of being in the highest vs. lowest tertile for GBM width and mesangial matrix fractional volume (67). Thus, among patients with diabetes and abnormal AER, the presence of the DD genotype is associated with a high risk for the development of advanced diabetic glomerulopathy lesions (67).
Also, we analyzed also the relationships between glomerular structure and polymorphism of PC-1 K121Q, a gene associated with insulin resistance, in T2DM patients with MA or proteinuria (68). The degree of glomerulopathy was similar among XQ and KK patients. Moreover, despite that patients carrying the Q PC-1 genotype had lower GFR, the decline of kidney function was similar among the two groups suggesting that this polymorphism is involved in regulation of renal hemodynamics rather than in the development of glomerular structural abnormalities (68).
The inconsistent results obtained to date with the candidate gene approach (65) may in large part be due to the genetic complexities of DN risk. Multiple genes are probably involved in conferring susceptibility to and/or protection from diabetic renal disease and it is important to take in account not only gene-gene interactions, but also the relationships between genetic and environmental factors. Among environmental factors, other than metabolic control, there is increasing interest on smoking as risk factor for DN. Smoking is an independent risk factor for the development of MA, the rate of progression from MA to proteinuria and subsequent renal failure both in T1DM and T2DM diabetes (69). We found that smokers had higher values for AER, GFR and GBM width than nonsmokers (70). The increase in GBM width among smokers was consistent with a dose dependent effect (70).
Reversibility of diabetic nephropathy lesions
Pancreas transplantation offers the opportunity to test the effects of long-term normoglycemia to prevent, halt or reverse DN lesions. Pancreas transplantation, performed at the time of renal transplant or within a few years after kidney transplant, prevents or slows the development of early diabetic glomerulopathy lesions in the renal allograft (71–73).
The possibility of diabetic renal lesion reversal was addressed by long-term studies of the native kidneys of T1DM recipients of pancreas transplantation alone (PTA). We found, that despite 5 years of normoglycemia there was no amelioration of the lesions of DN in 13 PTA recipients (74). GBM width, abnormal before PTA, was unchanged after 5 years. Vv(Mes/glom) was increased compared to the baseline, due to a decrease in glomerular volume (GV), while the total mesangial volume per glomerulus remained unchanged (74). Eight of the 13 PTA recipients were available for studies after 10 years of normoglycemia (75). These patients were 33±3 (mean±SD) years old, had diabetes for 22±5 years, and HbA1c of 8.7±1.5% at the time of PTA. GFR was significantly decreased (by ≈25%) at 5 years post PTA but did not change thereafter. AER was decreased at 10 years, in those patients with elevated baseline values (75). These renal functional data, however, are difficult to interpret, given the confounding effects of cyclosporine (76). Indeed, there was a significant correlation between the changes in GFR and cyclosporine dose and blood levels in these patients in the post-transplant first year (76). Unlike the 5 year post-PTA results, obvious reversal of diabetic glomerular and tubular lesions was observed in all 8 patients 10 years after PTA (75). Thus, GBM and TBM widths, unchanged at 5 years, decreased at 10-year follow-up, returning to normal values in most patients. Vv(Mes/glom) and mesangial matrix fractional volume (Vv(MM/glom) which had increased from baseline to 5 years, were lower at 10 years than at baseline or 5 years. GV decreased from baseline to 5 years and was stable thereafter. Total mesangial and total mesangial matrix volumes per glomerulus were consequently unchanged at 5 years and markedly decreased at 10 years. Light microscopic observations revealed a remarkable amelioration of glomerular structure in these patients, including the total disappearance of Kimmelstiel-Wilson nodular lesions and reopening of glomerular capillaries previously compressed by mesangial expansion (Figures 6–9) (75). The reasons for the long delay in reversal of DN lesions are unknown; nevertheless the long time necessary for these diabetic lesions to disappear is consistent with their slow development.
Figure 6.
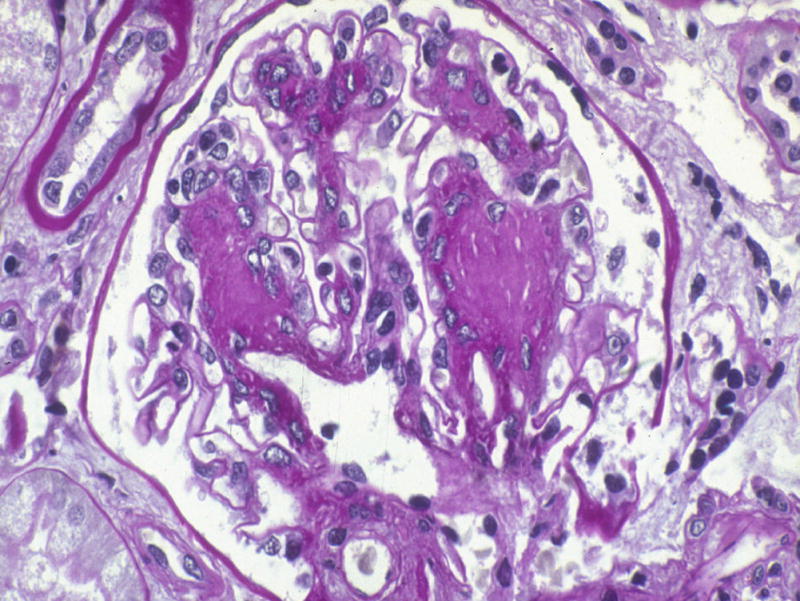
Diffuse and nodular mesangial expansion in a T1DM patient prior to pancreas transplantation alone (PTA) (PAS). Reprinted with permission from N Engl J Med 339:69–75, 1998.
Figure 9.
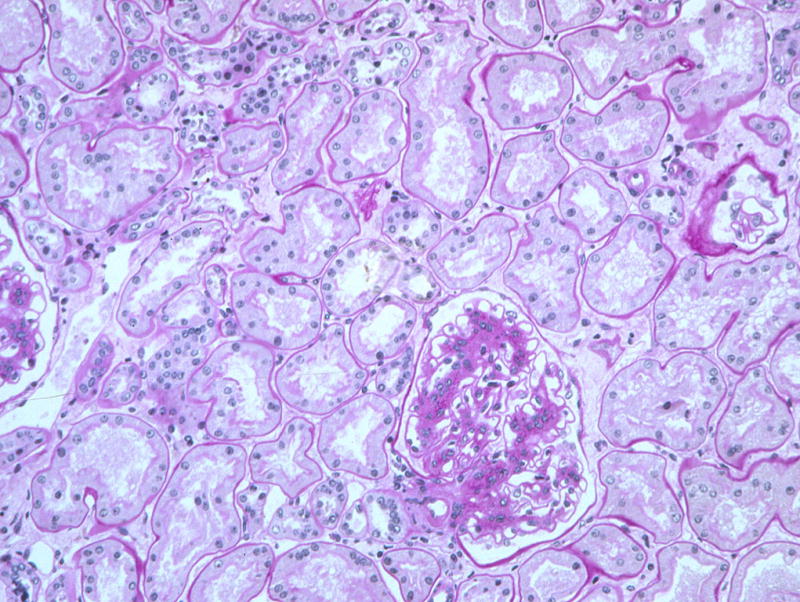
Moderate to advanced diabetic glomerulopathy despite near normal tubules and interstitium in this T1DM patient prior to PTA (PAS).
More recently we have reported remodelling of interstitial and tubular lesions in these same patients (77). The worsening of interstitial fibrosis and tubular atrophy observed at 5 years post-PTA, likely consequent to cyclosporine therapy (76) reversed at 10 years after PTA (76). We documented remodelling of the tubulo-interstitial lesions, with decrease of cortical interstitial fractional volume, the fractional volume of tubules which were atrophic and an overall decrease in renal interstitial fibrillar collagen (Figures 10–12) (77). Whether these structural improvements were consequent to prolonged normoglycemia, decreased cyclosporine dose or both, was unknown. Regardless of the mechanisms involved, at some point after PTA, glomerular, tubular and interstitial cells changed their behaviour towards extracellular matrix removal and architectural remodelling in remarkable demonstrations of the recooperative capacity of the kidney. These findings call for further studies aimed at identifying the molecular and cellular mechanisms involved in these healing processes could provide new directions in the treatment of DN.
Figure 10.
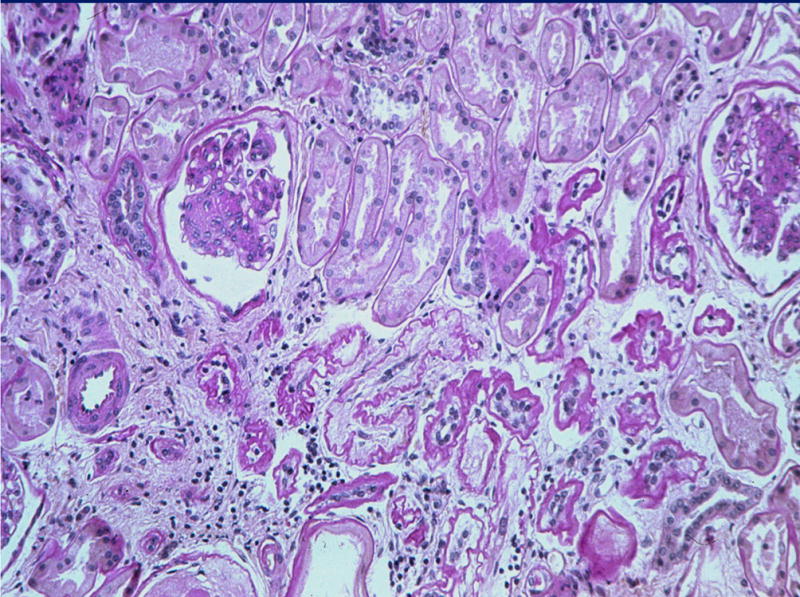
Persistence of the diabetic glomerulopathy changes and de novo interstitial fibrosis and tubular atrophy 5 years after PTA in the same patient as in Figure 9 (PAS). Reprinted with permission from Kidney Int 69:907–912, 2006.
Figure 7.
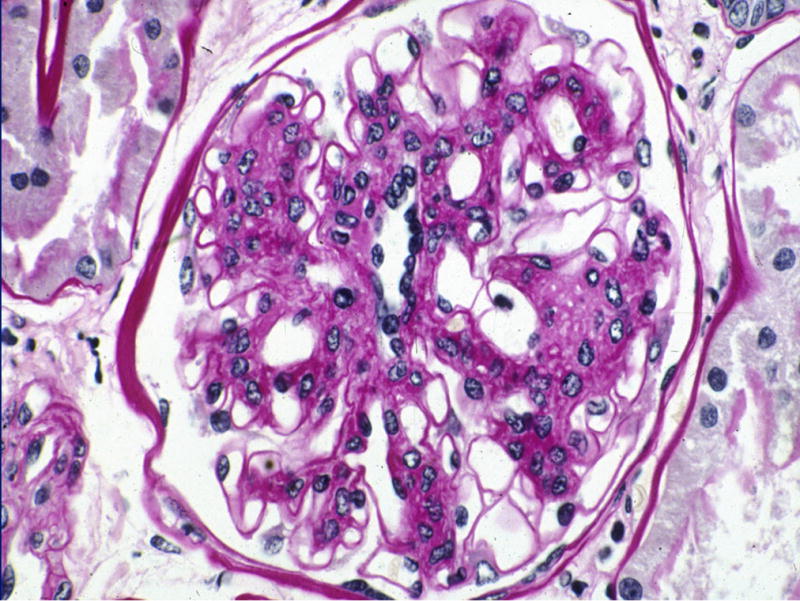
Persistence of diffuse and nodular mesangial expansion 5 years after successful PTA in the same patient as in Figure 6. Reprinted with permission from N Engl J Med 339:69–75, 1998.
Figure 8.
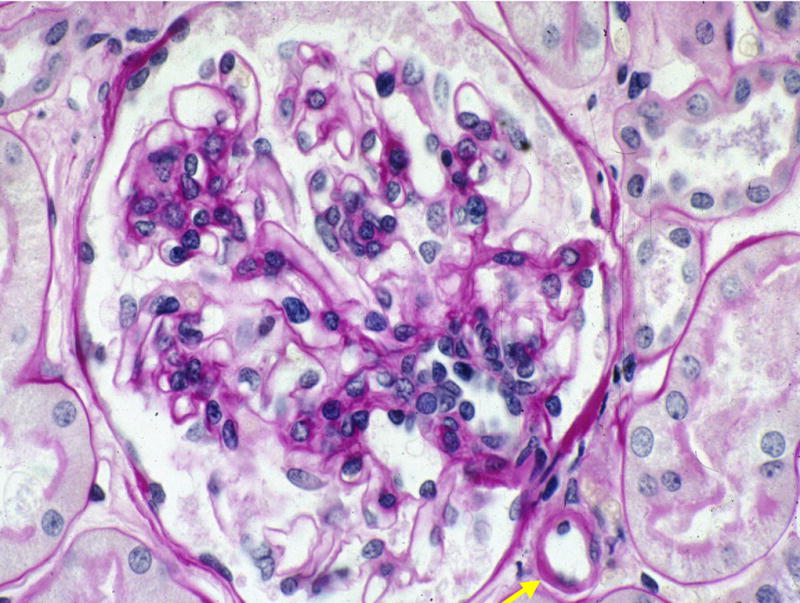
Marked reduction in mesangial expansion 10 years after successful PTA in the same patient as in Figures 6 and 7. Note the persistence (arrow) of arteriolar hyalinosis, a common finding in these cases (PAS). Reprinted with permission from N Engl J Med 339:69–75, 1998.
Figure 11.
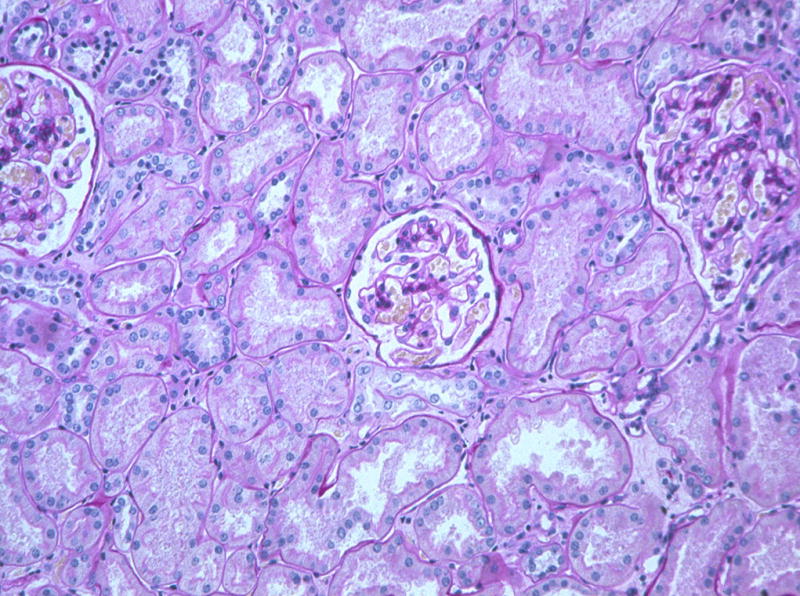
Near normalization of glomerular structure, marked resolution of interstitial fibrosis and presumed resorbtion of atrophic tubules 10 years after PTA in the same patient as in Figures 9 and 10.
Acknowledgments
We thank Patricia L. Erickson for assistance in manuscript preparation. Dr. Fioretto was a Juvenile Diabetes Research Foundation (JDRF) Fellow and Career Development Award recipient while performing some of the research reviewed herein. The Natural history studies discussed here were also supported by the JDRF. Many of the other studies reported here were supported by National Institutes of Health grant awards (PO1 DK13083, RO1 DK054638 and RO1-DK51975).
Footnotes
Publisher's Disclaimer: This is a PDF file of an unedited manuscript that has been accepted for publication. As a service to our customers we are providing this early version of the manuscript. The manuscript will undergo copyediting, typesetting, and review of the resulting proof before it is published in its final citable form. Please note that during the production process errors may be discovered which could affect the content, and all legal disclaimers that apply to the journal pertain.
References
- 1.Mauer M, Fioretto P, Woredekal Y, et al. Diabetic nephropathy. In: Schrier RW, editor. Disease of the Kidney and Urinary Tract. Philadelphia: Lippincott Williams and Wilkins; 2001. pp. 2083–2127. [Google Scholar]
- 2.Bell ET. Renal vascular disease in diabetes mellitus. Diabetes. 1953;2:376–389. doi: 10.2337/diab.2.5.376. [DOI] [PubMed] [Google Scholar]
- 3.Brito P, Fioretto P, Drummund K, et al. Proximal tubular basement membrane width in insulin-dependent diabetes mellitus. Kidney Int. 1998;53:754–761. doi: 10.1046/j.1523-1755.1998.00809.x. [DOI] [PubMed] [Google Scholar]
- 4.Lane PH, Steffes MW, Fioretto P, et al. Renal interstitial expansion in insulin-dependent diabetes mellitus. Kidney Int. 1993;43:661–667. doi: 10.1038/ki.1993.95. [DOI] [PubMed] [Google Scholar]
- 5.Harris RD, Steffes MW, Bilous RW, et al. Global glomerular sclerosis and glomerular arteriolar hyalinosis in insulin-dependent diabetes. Kidney Int. 1991;40:107–114. doi: 10.1038/ki.1991.187. [DOI] [PubMed] [Google Scholar]
- 6.Østerby R. Early phases in the development of diabetic glomerulopathy. Acta Med Scand. 1975;475:1–7. [PubMed] [Google Scholar]
- 7.Østerby R. Morphometric studies of the peripheral glomerular basement membrane in early juvenile diabetes I. Development of initial basement membrane thickening. Diabetologia. 1972;8:84–92. doi: 10.1007/BF01235631. [DOI] [PubMed] [Google Scholar]
- 8.Fioretto P, Steffes MW, Mauer SM. Glomerular structure in non-proteinuric insulin-dependent diabetic patients with various levels of albuminuria. Diabetes. 1994;43:1358–1364. doi: 10.2337/diab.43.11.1358. [DOI] [PubMed] [Google Scholar]
- 9.Mauer SM, Steffes MW, Ellis EN, et al. Structural functional relationships in diabetic nephropathy. J Clin Invest. 1984;74:1143–1155. doi: 10.1172/JCI111523. [DOI] [PMC free article] [PubMed] [Google Scholar]
- 10.Østerby R, Andersen AR, Gundersen HJ. Quantitative studies of glomerular ultrastructure in type 1 diabetics with incipient nephropathy. Diabet Nephropathy. 1984;3:95. [Google Scholar]
- 11.Fioretto P, Steffes MW, Sutherland DER, et al. Sequential renal biopsies in IDDM patients: Structural factors associated with clinical progression. Kidney Int. 1995;48:1929–1935. doi: 10.1038/ki.1995.493. [DOI] [PubMed] [Google Scholar]
- 12.Falk RJ, Scheinman Jl, Mauer SM, et al. Polyantigenic expansion of basement membrane constituents in diabetic nephropathy. Diabetes. 1983;32:34. doi: 10.2337/diab.32.2.s34. [DOI] [PubMed] [Google Scholar]
- 13.Kim Y, Kleppel MM, Butkowski R, et al. Differential expression of basement membrane collagen chains in diabetic nephropathy. Am J Pathol. 1991;138:413. [PMC free article] [PubMed] [Google Scholar]
- 14.Katz A, Caramori ML, Sisson-Ross S, et al. An increase in the cell component of the cortical interstitium antedates interstitial fibrosis in type 1 diabetic patients. Kidney Int. 2002;61:2058–2066. doi: 10.1046/j.1523-1755.2002.00370.x. [DOI] [PubMed] [Google Scholar]
- 15.Najafian B, Kim Y, Crosson JT, et al. Atubular glomeruli and glomerulotubular junction abnormalities in diabetic nephropathy. J Am Soc Nephrol. 2003;14:908–917. doi: 10.1097/01.asn.0000057854.32413.81. [DOI] [PubMed] [Google Scholar]
- 16.Najafian B, Crosson JT, Kim Y, et al. Glomerulotubular junction abnormalities are associated with proteinuria in type 1 diabetes. J Am Soc Nephrol. 2006;17:S53–S60. doi: 10.1681/ASN.2005121342. [DOI] [PubMed] [Google Scholar]
- 17.Caramori ML, Kim Y, Huang C, et al. Cellular basis of diabetic nephropathy: 1. Study design and renal structural-functional relationships in patients with long-standing diabetes. Diabetes. 2002;51:506–513. doi: 10.2337/diabetes.51.2.506. [DOI] [PubMed] [Google Scholar]
- 18.Bader R, Bader H, Grund KE, et al. Structure and function of the kidney in diabetic glomerulosclerosis. Correlations between morphological and functional parameters. Pathol Res Pract. 1980;167:204–216. doi: 10.1016/S0344-0338(80)80051-3. [DOI] [PubMed] [Google Scholar]
- 19.Parving H-H, Gall M-A, Skøtt P, et al. Prevalence and causes of albuminuria in non-insulin-dependent diabetic patients. Kidney Int. 1992;41:758–762. doi: 10.1038/ki.1992.118. [DOI] [PubMed] [Google Scholar]
- 20.Lipkin GW. More than one kind of type 2 diabetes with renal disease do not have diabetic nephropathy. J Am Soc Nephrol. 1994;5:37. [Google Scholar]
- 21.Gambara V, Mecca G, Remuzzi G, et al. Heterogeneous nature of renal lesions in type II diabetes. J Am Soc Nephrol. 1993;3:1458–1466. doi: 10.1681/ASN.V381458. [DOI] [PubMed] [Google Scholar]
- 22.Ruggenenti P, Gambara V, Perna A, et al. The nephropathy of non-insulin dependent diabetes: predictors of outcome relative to diverse patters of renal injury. J Am Soc Nephrol. 1998;9:2336–2343. doi: 10.1681/ASN.V9122336. [DOI] [PubMed] [Google Scholar]
- 23.Olsen S, Mogensen CE. Non-diabetic renal disease in NIDDM proteinuric patients may be rare in biopsies from clinical practice. Diabetologia. 1996;39:1638–1645. doi: 10.1007/s001250050628. [DOI] [PubMed] [Google Scholar]
- 24.Mazzucco G, Bertani T, Fortunato M. Different patterns of renal damage in type 2 diabetes mellitus: a multicentric study on 393 biopsies. Am J Kid Dis. 2002;39:713–720. doi: 10.1053/ajkd.2002.31988. [DOI] [PubMed] [Google Scholar]
- 25.Fioretto P, Mauer M, Brocco E, et al. Patterns of renal injury in type 2 (non-insulin dependent) diabetic patients with microalbuminuria. Diabetologia. 1996;39:1569–1576. doi: 10.1007/s001250050616. [DOI] [PubMed] [Google Scholar]
- 26.Najafian B, Caramori ML, Mauer M, et al. Clustering of type 1 and type 2 diabetic patients based on diabetic nephropathy structural-functional relationships. J Am Soc Nephrol. 2005;16:679A. (abstr) [Google Scholar]
- 27.Nosadini R, Velussi M, Brocco E, et al. Course of renal function in type 2 diabetic patients with abnormalities of albumin excretion rate. Diabetes. 2000;49:476–484. doi: 10.2337/diabetes.49.3.476. [DOI] [PubMed] [Google Scholar]
- 28.Ellis EN, Steffes MW, Goetz FC, et al. Glomerular filtration surface in type 1 diabetes mellitus. Kidney Int. 1986;29:889. doi: 10.1038/ki.1986.82. [DOI] [PubMed] [Google Scholar]
- 29.Chavers BM, Bilous RW, Ellis EN, et al. Glomerular lesions and urinary albumin excretion rate in type 1 diabetic patients without overt proteinuria. N Engl J Med. 1989;320:966–970. doi: 10.1056/NEJM198904133201503. [DOI] [PubMed] [Google Scholar]
- 30.Mauer SM, Sutherland DER, Steffes MW. Relationships of systemic blood pressure to nephropathy in insulin-dependent diabetes mellitus. Kidney Int. 1992;41:736. doi: 10.1038/ki.1992.115. [DOI] [PubMed] [Google Scholar]
- 31.Bangstad HJ, Østerby R, Hartmann A, et al. Severity of glomerulopathy predicts long-term urinary albumin excretion rate in patients with type 1 diabetes and microalbuminuria. Diabetes Care. 1999;22:314–319. doi: 10.2337/diacare.22.2.314. [DOI] [PubMed] [Google Scholar]
- 32.Steinke JM, Sinaiko AR, Kramer MS, et al. The early natural history of nephropathy in type 1 diabetes. III. Predictors of five-year urinary albumin excretion rate patterns in initially normoalbuminuric patients. Diabetes. 2005;54(7):2164–2171. doi: 10.2337/diabetes.54.7.2164. [DOI] [PubMed] [Google Scholar]
- 33.Caramori ML, Fioretto P, Mauer M. Low glomerular filtration rate in normoalbuminuric type 1 diabetic patients. an indicator of more advanced glomerular lesions. Diabetes. 2003;52:1036–1040. doi: 10.2337/diabetes.52.4.1036. [DOI] [PubMed] [Google Scholar]
- 34.MacIsaac RJ, Tsalamandris C, Panagiotopoulos S, et al. Normoalbuminuric renal insufficiency in type 2 diabetes. Diabetes Care. 2004;27:195–200. doi: 10.2337/diacare.27.1.195. [DOI] [PubMed] [Google Scholar]
- 35.Pagtalunan ME, Miller PL, Jumping-Eagle S, et al. Podocyte loss and progressive glomerular injury in type 2 diabetes. J Clin Invest. 1997;99:342–348. doi: 10.1172/JCI119163. [DOI] [PMC free article] [PubMed] [Google Scholar]
- 36.Hayashi H, Karasawa R, Inn H, et al. An electron microscopic study of glomeruli in Japanese patients with non-insulin dependent diabetes mellitus. Kidney Int. 1992;41:749–757. doi: 10.1038/ki.1992.117. [DOI] [PubMed] [Google Scholar]
- 37.Østerby R, Gall MA, Schmitz A, et al. Glomerular structure and function in proteinuric type 2 (non-insulin dependent) diabetic patients. Diabetologia. 1993;36:1064–1070. doi: 10.1007/BF02374500. [DOI] [PubMed] [Google Scholar]
- 38.Lewis EJ, Hunsicker LG, Clarke WR, et al. Collaborative Study Group. Renoprotective effect of the angiotensin-receptor antagonist irbesartan in patients with nephropathy due to type 2 diabetes. N Engl J Med. 2001;345(12):851–860. doi: 10.1056/NEJMoa011303. [DOI] [PubMed] [Google Scholar]
- 39.Brenner BM, Cooper ME, de Zeeuw D, et al. RENAAL Study Investigators. Effects of losartan on renal and cardiovascular outcomes in patients with type 2 diabetes and nephropathy. N Engl J Med. 2001;345(12):861–869. doi: 10.1056/NEJMoa011161. [DOI] [PubMed] [Google Scholar]
- 40.Lewis EJ, Hunsicker LG, Bain RP, et al. The effect of angiotensin-converting-enzyme inhibition on diabetic nephropathy. The Collaborative Study Group. N Engl J Med. 1993;329(20):1456–1462. doi: 10.1056/NEJM199311113292004. [DOI] [PubMed] [Google Scholar]
- 41.Kalluri R. Proteinuria with and without renal glomerular podocyte effacement. J Am Soc Nephrol. 2006;17(9):2383–2389. doi: 10.1681/ASN.2006060628. [DOI] [PubMed] [Google Scholar]
- 42.Barisoni L, Mundel P. Podocyte biology and the emerging understanding of podocyte diseases. Am J Nephrol. 2003;23:353–360. doi: 10.1159/000072917. [DOI] [PubMed] [Google Scholar]
- 43.Kriz W, Gretz N, Lemley KV. Progression of glomerular disease: Is the podocyte the culprit? Kidney Int. 1998;54:687–697. doi: 10.1046/j.1523-1755.1998.00044.x. [DOI] [PubMed] [Google Scholar]
- 44.Toyoda M, Najafian B, Groppoli T, et al. Podocyte detachment is associated with less fenestration in glomerular endothelial cells in type 1 diabetes mellitus. J Am Soc Nephrol. 2004;15:265A. (abstr) [Google Scholar]
- 45.Ellis EN, Steffes MW, Chavers BM, et al. Observation of glomerular epithelial cell structure in patients with type I diabetes mellitus. Kidney Int. 1987;32:736–741. doi: 10.1038/ki.1987.268. [DOI] [PubMed] [Google Scholar]
- 46.Bjorn SF, Bangstad H-J, Hanssen KF, et al. Glomerular epithelial foot process and filtration slits in IDDM patients. Diabetologia. 1995;38:1197–1204. doi: 10.1007/BF00422369. [DOI] [PubMed] [Google Scholar]
- 47.Torbjornsdotter TB, Perrin NE, Jaremko GA, et al. Widening of foot processes in normoalbuminuric adolescents with type 1 diabetes. Pediatr Nephrol. 2005;20(6):750–758. doi: 10.1007/s00467-005-1829-5. [DOI] [PubMed] [Google Scholar]
- 48.White KE, Bilous RW, Marshall SM, et al. Podocyte number in normotensive type 1 diabetic patients with albuminuria. Diabetes. 2002;51:3083–3089. doi: 10.2337/diabetes.51.10.3083. [DOI] [PubMed] [Google Scholar]
- 49.Steffes MW, Schmidt D, McCrery R, et al. Glomerular cell number in normal subjects and in type 1 diabetic patients. Kidney Int. 2001;59:2104–2113. doi: 10.1046/j.1523-1755.2001.00725.x. [DOI] [PubMed] [Google Scholar]
- 50.Meyer TW, Bennett PH, Nelson RG. Podocyte number predicts long-term urinary albumin excretion in Pima Indians with Type II diabetes and microalbuminuria. Diabetologia. 1999;42:1341–1344. doi: 10.1007/s001250051447. [DOI] [PubMed] [Google Scholar]
- 51.Dalla Vestra M, Masiero A, Roiter AM, et al. Is podocyte injury relevant in diabetic nephropathy? Studies in patients with type 2 diabetes. Diabetes. 2003;52:1031–1035. doi: 10.2337/diabetes.52.4.1031. [DOI] [PubMed] [Google Scholar]
- 52.Steffes MW, Sutherland DER, Goetz FC, et al. Studies of kidney and muscle biopsy specimens from identical twins discordant for type I diabetes mellitus. N Engl J Med. 1985;312:1282–1287. doi: 10.1056/NEJM198505163122003. [DOI] [PubMed] [Google Scholar]
- 53.Mauer SM, Goetz FC, McHugh LE, et al. Long-term study of normal kidneys transplanted into patients with type I diabetes. Diabetes. 1989;38:516–523. doi: 10.2337/diab.38.4.516. [DOI] [PubMed] [Google Scholar]
- 54.Bilous RW, Mauer SM, Sutherland DER, et al. Mean glomerular volume and rate of development of diabetic nephropathy. Diabetes. 1989;38:1142–1147. doi: 10.2337/diab.38.9.1142. [DOI] [PubMed] [Google Scholar]
- 55.Bendtsen TF, Nyengaard JR. The number of glomeruli in type 1 (insulin-dependent) and type 2 (non-insulin-dependent) diabetic patients. Diabetologia. 1992;35(9):844–850. doi: 10.1007/BF00399930. [DOI] [PubMed] [Google Scholar]
- 56.Luyckx VA, Brenner BM. Low birth weight, nephron number and kidney disease. Kidney Int. 2005;97:S68–S77. doi: 10.1111/j.1523-1755.2005.09712.x. (suppl) [DOI] [PubMed] [Google Scholar]
- 57.Seaquist ER, Goetz FC, Rich S, et al. Familial clustering of diabetic kidney disease: evidence for genetic susceptibility to diabetic nephropathy. N Engl J Med. 1989;320:1161–1165. doi: 10.1056/NEJM198905043201801. [DOI] [PubMed] [Google Scholar]
- 58.Borch-Johnsen K, Norgaard K, Hommel E, et al. Is diabetic nephropathy an inherited complication? Kidney Int. 1992;41:719–722. doi: 10.1038/ki.1992.112. [DOI] [PubMed] [Google Scholar]
- 59.Quinn M, Angelico MC, Warram JH, et al. Familial factors determine the development of diabetic nephropathy in patients with IDDM. Diabetologia. 1996;39:940–945. doi: 10.1007/BF00403913. [DOI] [PubMed] [Google Scholar]
- 60.Freedman BI, Tuttle AB, Spray BJ. Familial predisposition to nephropathy in African-Americans with non-insulin-dependent diabetes mellitus. Am J Kidney Dis. 1995;5:710–713. doi: 10.1016/0272-6386(95)90546-4. [DOI] [PubMed] [Google Scholar]
- 61.Pettitt DJ, Saad MF, Bennett PH, et al. Familial predisposition to renal disease in two generations of Pima Indians with type 2 (non-insulin-dependent) diabetes mellitus. Diabetologia. 1990;33:438–443. doi: 10.1007/BF00404096. [DOI] [PubMed] [Google Scholar]
- 62.Fioretto P, Steffes MW, Rich SS, et al. Is diabetic nephropathy inherited? Studies of glomerular structure in type 1 diabetic sibling pairs. Diabetes. 1999;48:865–869. doi: 10.2337/diabetes.48.4.865. [DOI] [PubMed] [Google Scholar]
- 63.Trevisan R, Viberti G. Sodium-hydrogen antiporter: Its possible role in the genesis of diabetic nephropathy. Nephrol Dial Transplant. 1997;12(4):643–645. doi: 10.1093/ndt/12.4.643. [DOI] [PubMed] [Google Scholar]
- 64.Trevisan R, Fioretto P, Barbosa J, et al. Insulin-dependent diabetic sibling pairs are concordant for sodium-hydrogen antiport activity. Kidney Int. 1999;55:2383–2389. doi: 10.1046/j.1523-1755.1999.00478.x. [DOI] [PubMed] [Google Scholar]
- 65.Caramori MLA, Mauer M. Pathophysiology of renal complications. In: Porte D Jr, Sherwin RS, Baron A, editors. Ellenberg and Rifkin’s Diabetes Mellitus. 6. NY: McGraw-Hill; 2003. pp. 697–722. [Google Scholar]
- 66.Fujisawa T, Ikegami H, Kawaguchi Y, et al. Meta-analysis of association of insertion/deletion polymorphism of angiotensin I-converting enzyme gene with diabetic nephropathy and retinopathy. Diabetologia. 1998;41:47–53. doi: 10.1007/s001250050865. [DOI] [PubMed] [Google Scholar]
- 67.Solini A, Dalla Vestra M, Saller A, et al. The angiotensin-converting enzyme DD genotype is associated with glomerulopathy lesions in type 2 diabetes. Diabetes. 2002;51:251–255. doi: 10.2337/diabetes.51.1.251. [DOI] [PubMed] [Google Scholar]
- 68.De Cosmo S, Trevisan R, Dalla Vestra M, et al. PC-1 amino acid variant Q121 is associated with a lower glomerular filtration rate in type 2 diabetic patients with abnormal albumin excretion rates. Diabetes Care. 2003;26:28982–28902. doi: 10.2337/diacare.26.10.2898. [DOI] [PubMed] [Google Scholar]
- 69.Orth SR. Smoking--A renal risk factor. Nephron. 2000;86:12–26. doi: 10.1159/000045708. [DOI] [PubMed] [Google Scholar]
- 70.Baggio B, Budakovic A, Dalla Vestra M, et al. Effects of cigarette smoking on glomerular structure and function in type 2 diabetic patients. J Am Soc Nephrol. 2002;13:2730–2736. doi: 10.1097/01.asn.0000032422.81130.68. [DOI] [PubMed] [Google Scholar]
- 71.Bohman S-O, Tyden G, Wilczek H, et al. Prevention of kidney graft diabetic nephropathy by pancreas transplantation in man. Diabetes. 1985;34:306–308. doi: 10.2337/diab.34.3.306. [DOI] [PubMed] [Google Scholar]
- 72.Wilczek HE, Jaremko G, Tyden G, et al. Pancreatic graft protects a simultaneously transplanted kidney from developing diabetic nephropathy: A 1 to 6 year follow-up study. Transplant Proc. 1993;1:1314–1315. [PubMed] [Google Scholar]
- 73.Bilous RW, Mauer SM, Sutherland DER, et al. The effects of pancreas transplantation on the glomerular structure of renal allografts in patients with insulin-dependent diabetes. N Engl J Med. 1989;32:80–85. doi: 10.1056/NEJM198907133210204. [DOI] [PubMed] [Google Scholar]
- 74.Fioretto P, Mauer SM, Bilous RW, et al. Effects of pancreas transplantation on glomerular structure in insulin-dependent diabetic patients with their own kidneys. Lancet. 1993;342:1193–1196. doi: 10.1016/0140-6736(93)92183-t. [DOI] [PubMed] [Google Scholar]
- 75.Fioretto P, Steffes MW, Sutherland DER, et al. Reversal of lesions of diabetic nephropathy after pancreas transplantation. N Engl J Med. 1998;339:69–75. doi: 10.1056/NEJM199807093390202. [DOI] [PubMed] [Google Scholar]
- 76.Fioretto P, Steffes MW, Mihach MJ, et al. Cyclosporine associated lesions in native kidneys of diabetic pancreas transplant recipients. Kidney Int. 1995;48:489–495. doi: 10.1038/ki.1995.318. [DOI] [PubMed] [Google Scholar]
- 77.Fioretto P, Sutherland DER, Najafian B, et al. Remodeling of renal interstitial and tubular lesions in pancreas transplant recipients. Kidney Int. 2006;69:907–912. doi: 10.1038/sj.ki.5000153. [DOI] [PubMed] [Google Scholar]


