

Abstract
MicroRNAs regulate diverse cellular processes and play an integral role in cancer pathogenesis. Genomic variation within miRNA target sites may therefore be important sources for genetic differences in cancer risk. To investigate this possibility, we mapped HapMap SNPs to putative miRNA recognition sites within genes dysregulated in estrogen receptor stratified breast tumors and used local linkage disequilibirum (LD) patterns to identify high-ranking SNPs in the Cancer Genetic Markers of Susceptibility (CGEMS) breast cancer genome wide association study (GWAS) for further testing. Two SNPs, rs1970801 and rs11097457, scoring in the top 100 from the CGEMS study, were in strong LD with rs1434536 – a SNP that resides within a miR-125b target site in the 3'UTR of the Bone Morphogenic Receptor Type 1B (BMPR1B) gene encoding a transmembrane serine/threonine kinase. We validated the CGEMS association findings for rs1970801 in an independent cohort of admixture corrected cases identified from families with multiple case histories. Subsequent association testing of rs1434536 for these cases and CGEMS controls with imputed genotypes supported the association. Furthermore, luciferase reporter assays and overexpression of miR-125b-mimics combined with quantitative RT-PCR showed that BMPR1B transcript is a direct target of miR-125b and that miR-125b differentially regulates the C and T alleles of rs1434536. These results suggest that allele-specific regulation of BMPR1B by miR-125b explains the observed disease risk. Our approach is general and can help identify and explain the mechanisms behind disease-association for alleles that affect miRNA regulation.
Keywords: microRNA, breast cancer, single nucleotide polymorphism, data integration, GWAS
INTRODUCTION
MicroRNAs (miRNAs) are a recently discovered class of short non-coding RNA genes that act post-transcriptionally as negative regulators of gene expression and play fundamental roles in cell growth, apoptosis, hematopoietic lineage differentiation, and differentiation [1] [2]. Functional studies indicate that changes in miRNA expression patterns might underlie human pathologies, including malignancies [3] [4]. In addition, variations in miRNA target sites mediated by single nucleotide polymorphisms (SNPs) may be associated with human cancers [5, 6].
Gene expression profiling studies have identified specific signatures for breast cancer (BrCa) and are employed to guide patient treatment with both the Oncotype Dx and Mammaprint tests in use clinically [7, 8]. We previously described a meta-analysis of multiple independent BrCa RNA expression studies whereby a unified set of dysregulated genes was identified in ER+ and ER− tumors. The identification of germline variations in elements controlling RNA expression (i.e. transcription factor or miRNA recognition sites) may provide clues as to the mechanistic basis for the observed variations in gene expression patterns.
Genome wide association studies have been employed in many common diseases to identify SNPs associated with disease [9, 10]. To date, four independent studies examining BrCa patients have identified multiple SNPs associated with disease [10–13]. While some association signals appear universal in multiple studies (ie. several SNPs within FGFR2) often these studies also yield vastly differing collections of SNPs associated with disease perhaps owing to differences in study design. While many disease-associated SNPs are nongenic, and thus their contribution to disease pathogenesis is unclear, many are likely to reside in gene regulatory elements that may influence gene expression patterns observed in tumors.
We describe an integrative genomic approach leveraging gene expression patterns, miRNA targeting, BrCa GWAS data, and biological testing to identify a disease-associated SNP in the 3' untranslated region of BMPR1B gene. To identify this SNP we mapped a set of reference SNPs from the HapMap project to prospective miRNA target sites located in the 3'UTRs of a previously identified set of dysregulated ER+ and ER− genes [14]. An analysis of local linkage disequilibrium (LD) patterns surrounding these SNPs identified one SNP (rs1434536) in strong LD with two SNPs showing a high degree of association in the CGEMS study. We replicated this association in an independent set of cases identified from families with multiple case histories and common CGEMS controls after controlling for population stratification with ancestry informative markers (AIMs). We provide strong support that allelic variation at rs1434536 influences interactions with miR-125b leading to differences in BMPR1B expression levels. The approach described is generally applicable and provides clues to the role cis-acting allelic variation plays in tumor gene expression patterns via interactions with the miRNA machinery in disease pathogenesis.
MATERIALS AND METHODS
Mapping SNPs to miRNA Targets
Our input data consisted of 275 candidate genes previously identified as constituting the Top 1% of genes dysregulated in ER+ and ER− (130 and 145 genes respectively) BrCa tumors [14] and their annotated 3'UTR sequences from the UCSC Table Browser (NCBI Build 36.1); mature human miRNA sequences from miRBase1 and SNPs from HapMap2. Using custom python scripts, we (1) identified all unique 7mer seeds (nucleotides 2–8) within the mature miRNA sequences; (2) identified all seed sites - that is, locations with perfect reverse complementarity to a 7mer seed – within the candidate genes' 3'UTRs; (3) identified all HapMap SNPs that mapped to one of the seed site locations; and (4) removed all SNPs that had no reported minor allele in any HapMap population.
Description of Study Populations
Four hundred fifty-nine probands from a BrCa affected sibling pair cohort were recruited from a multi-institutional study (Eastern Cooperative Oncology Group Cancer in Sibling Study, E1Y97) under protocols approved by the respective Institutional Review Boards at each institution. The mean age of diagnosis for probands was 55 years (range 16–87) and disease status was verified by pathology reports for 96.5% of cases (443 of 459) (Supplementary Methods). We collected self-reported ethnicity data for both maternal and paternal grandparents from 78% (356) of our cases. CGEMS patients consisted of 1,142 controls and 1,145 cases of post-menopausal BrCa and were gathered from the Nurses Health Study as described previously [10, 15]. Self-reported ethnicity information was unavailable for these individuals.
Genotyping and Quality Control
DNA samples were prepared as previously described from peripheral leukocytes [16]. SNP genotyping was performed using Sequenom MassARRAY genotyping technology and iPLEX chemistry according to manufacturer's instructions [17]. Ancestry informative markers (AIM) were developed into 2 multiplex assays (Supplementary Table S1) as defined by the 64 In4 AIMs described by Kosoy et al.[18]. Genotyping success ranged from 95.9 to 97.8% for the 3 association SNP in our cases. Patient samples were genotyped and samples demonstrating <80% completion rate (46/459) were subjected to a second round of genotyping. Quality control metrics for our cases included a minimum of 80% genotyping success while SNPs with completion rates <90% were discarded. After 2 rounds of genotyping, four cases and nine AIMs were discarded from further analysis, having not met quality control metrics.
Population Structure Analysis and Association Testing
For admixture analysis we utilized 45 AIMs and combined our cases (455), the CGEMS controls (1,142) and seeded the analysis with a training set of 270 HapMap reference samples (CEU, YRI and CHB+JTP) to perform STRUCTURE analysis with k=3 populations (Supplementary Figure S1). We observed general agreement between our patient's self-reported ethnicity and genetic ancestry as determined by our AIMs although rarely a patient's self-identified ancestry was at odds with the calculated CEU ancestral component. In these instances we relied on STRUCTURE results to determine genetic ancestry. For association testing, each SNP was analyzed using a logistic regression model where odds ratios are estimated for homozygous and heterozygous states of the indicated cases and CGEMS controls. For the causative SNPs rs1434536 we directly genotyped our cases and imputed genotypes from CGEMS controls using HapMap CEU reference individuals (Supplementary Methods). IMPUTE and SNPTEST were used for genotype determination and association testing of rs1434536 as described [19].
Cell Lines, Cloning and Dual Luciferase Reporter Assays
Cell lines were maintained in F12/DMEM respectively supplemented with 10% FBS, and 1% Pen/Strep. Luciferase reporter targets were generated for the miR-125b target region of BMPR1B by cloning PCR products from HapMap NA18505 (rs1434536-C/T) into the 3'-untranslated region of the Renilla luciferase gene in the psiCheck2.2 dual reporter vector (Promega). Clones containing T or the C alleles at rs1434536 were verified by ABI fluorescent dideoxy sequencing and transiently transfected into MCF-7 and MD-MBA-231 cell lines. Renilla luciferase (hRluc) activity was measured 48hr post-transfection. Cells were lysed with 120 μl Passive Lysis Buffer (Promega), and luciferase levels were analyzed from 10 μl lysates using the dual luciferase reporter assay (50 μl of each substrate reagent, Promega) on a Veritas Microplate Luminometer (Turner Biosystems, Sunnyvale, CA). Changes in expression of Renilla luciferase (target) were normalized relative to Firefly luciferase.
Transfection of miR-125b Duplexes and qRT-PCR of BMPR1B
siRNAs (IDT) were transfected into MCF-7 or MDA-MB-231 cells using RNAiMax (Invitrogen) utilizing the manufacturers recommendations. Twenty-five pmol of each strand of the siRNA target were annealed by heating to 94°C for 2 min to form duplexes in buffer supplied by the manufacturer then allowed to cool to room temperature. Transfection efficiencies were monitored by transfecting in parallel a Cy3 labeled DS scrambled control siRNA duplex (IDT). Cells were harvested 24 hr after transfection and RNAs purified. cDNA was synthesized from 25ng RNA using random hexamers and M-MLV reverse transcriptase and was subsequently amplified with BMPR1B specific primers (Supplementary Methods). We calculated the SQ values and normalized BMPR1B transcript to GAPDH. RNA quantitation experiments were performed in triplicate from two independent transfection experiments.
RESULTS
Multiple HapMap SNPs map to putative miRNA target sites in ER+ and ER− dysregulated genes
Since allelic variations in miRNA binding sites have been shown to influence transcript levels [20] we examined if commonly occurring SNPs present in miRNA binding sites could be identified from the HapMap Consortium. Using a previously described set of genes dysregulated in ER+ and ER− breast tumors [14], we identified all HapMap SNPs residing within putative miRNA target sites in the genes' 3'UTRs (see Materials and Methods). We focused our search on the miRNA seed region, as the seed nucleates the miRNA to the complementary mRNA target region and is the main determinant for miRNA targeting [21]. More specifically, we based our miRNA target site predictions on 7mer seed sites as we expected these would give an acceptable tradeoff between the number of false negative and false positive predictions [21]. Our search identified 63 unique SNPs. Thirty-seven and 26 SNPs mapped to genes dysregulated in ER+ and ER− tumors respectively (Supplementary Table S2). This collection of SNPs was considered for further analysis.
A miR-125b target site SNP in BMPR1B is in strong LD with breast cancer-associated SNPs
To prioritize the 63 SNPs for further biological testing, we mapped each to the publically available CGEMS BrCa GWAS3 dataset looking for SNPs that had signals of association. However, only seven mapped directly to this dataset – none of which demonstrated a statistically significant association. Twenty of the 63 target SNPs were either monomorphic (14 SNPs) in CEU samples or exhibited minor allele frequencies <0.05 (6 SNPs) and were therefore not expected to be represented on the GWAS array as rare SNPs (typically <5% minor allele frequency in CEU samples) are often excluded from these arrays. Moreover, the arrays typically contain only subsets of SNPs within haplotype blocks, but these SNPs can be used as proxies for the missing SNPs within blocks. To prioritize the remaining 43 SNPs, we therefore first used local linkage disequilibrium (LD) structure from HapMap to identify proxy SNPs in the CGEMS dataset and second observed such proxies' genome-wide association rank in the CGEMS set.
One SNP, rs1434536, demonstrated high LD to rs1970801 and rs11097457 (r2=0.81) in the HapMap CEU reference samples (Fig. 1). rs1970801 and rs11097457 ranked 79th and 67th in the CGEMS GWAS association data (p=0.00017 and p=0.00014 respectively, unadjusted score test). These SNPs exhibit extensive pairwise LD (r2=0.93) in the CEU HapMap reference samples. We conclude that they likely represent the same association signal. The target site SNP rs1434536 lies 5.4kb downstream of rs1970801 and 0.85kb upstream of rs11097457 in the 3'UTR of the Bone Morphogenetic Protein Receptor 1B (BMPR1B) gene. The SNP's C→T change alters a 7mer seed site for miR-125b to a 6mer site – a change expected to reduce miR-125b's binding affinity to the site (Fig. 2). Moreover, miR-125b is differentially expressed in normal vs. breast cancer in general, and in ER+ vs. ER− tumors in particular [22–24]. The combined observations that miR-125b and BMPR1B are differentially expressed in breast cancer, that allelic variation of rs1434536 likely disrupts miR-125b's regulation of BMPR1B, and that the SNP is in LD with two BrCa-associated SNPs, suggest that rs1434536 has a pathogenic role in breast cancer.
Figure 1. Regional CGEMS association data and linkage disequilibrium structure in BMPR1B region.

(A) Localized association data for CGEMS breast cancer dataset (Chr 4: 95.3–96.8Mb). Transcripts from the RefSeq database are shown in the upper third part of the graph; selected SNPs are shown in black. (B) Linkage disequilibrium (LD) structure of BMPR1B (NM_001203) 3'UTR Region. An ~19kb interval of the BMPR1B gene (black boxes and white arrow-box are coding sequence and 3' UTR exons) and the surrounding region is depicted with select SNPs shown across the top. rs1434536 (solid box), located in 3'UTR of BMPR1B, is flanked by rs1970801 centromerically and rs11097457 telomerically (dashed boxes). Shaded boxes indicate pairwise LD values measured as r2 with values listed; black boxes indicate perfect correlations (r2=1). The direction of BMPR1B transcription, relative to the genome assembly is from left to right. Panel adapted from Haploview4. (C) Haplotype structure of 3 selected SNPs (boxed in B) with frequencies from HapMap CEU population where rs1970801 has been converted to + strand of UCSC assembly.
Figure 2. Predicted effect of allelic variation at rs1434536 on miR-125b recognition.
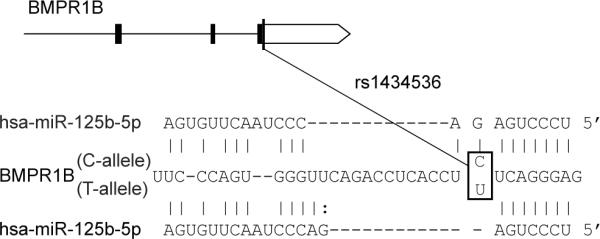
Top, BMPR1B gene as described in Figure 1 (white box, 3'UTR). Bottom, partial sequence of BMPR1B 3'UTR and SNP rs1434536 (boxed). Bottom, seed pairing of miR125-b (nucleotides 2–8 at 5' end) with C (top sequence) and T(U)(bottom sequence) alleles of rs1434536.
Independent cohort confirms BMPR1B SNP's association with breast cancer
Although the CGEMS results did not reach genome-wide significance for either rs1970801 or rs11097457 we elected to replicate the CGEMS results by screening rs1970801 in an independent cohort of genetically enriched BrCa cases. In parallel, we screened two additional SNPs for association with disease: rs1219648 and rs6831418 which ranked 2 and 52 respectively in the unadjusted CGEMS genomewide rankings (Supplementary Table S3). SNP rs6831418 resides within an intron of BMPR1B, approximately 320kb upstream of rs1970801 (r2=0.118 with rs1970801) and a regional association plot of the CGEMS data (Fig. 1A) also indicated potential disease association. SNP rs1219648, present in intron 2 of FGFR2, was previously shown to be the most strongly associated SNP with BrCa in multiple GWAS studies including the CGEMS, Wellcome Trust (rs2981582, r2=1.0 with rs1219648), and MSKCC Ashkenazi Jewish (rs1078806, r2=0.96 with rs1219648) studies [10, 11, 13]. We employed rs1219648/FGFR2 as a positive control for association in our cases, as the three previous studies indicated this SNP is a universal marker for disease. Our BrCa cases consisted of probands ascertained by virtue of a living, affected full sibling with disease while we employed admixture-corrected, shared disease free controls from the CGEMS study. The use of cases ascertained by virtue of family history served to enrich for alleles with a strong genetic etiology. In addition, the use of shared controls has recently been described for multiple common disease scenarios [9, 25, 26].
Prior to comparing allele frequencies between our cases and CGEMS controls for the 3 SNPs, we sought to eliminate two potential biases: population differences between cases and controls and technical artifacts (e.g. errors in genotype scoring). To reduce the likelihood that any observed associations could be mediated by differences in the genetic ancestry of our cases and the controls we elected to employ ancestry informative markers (AIMs) and only analyze cases and controls with a high percentage (>90%) of Caucasian ancestry as defined by HapMap CEU reference samples. Recently AIMs useful for determining intercontinental admixture have been described to facilitate structured association testing in case-control studies [27]. We selected 59 AIMs (Supplementary Table S2) based upon the 64 most informative In4 markers as described by Kosoy, et al. for population structure analysis [18]. These markers have a high discriminatory power to distinguish CEU, YRI, CHB+JPT, AMI (American Indian) continental populations. After STRUCTURE analysis (Supplementary Methods) we observed 94.1% (428/455) of our cases exhibited >90% CEU ancestry while CGEMS controls showed 93.3% (1,064/1,142) CEU ancestry (Supplementary Fig. S1).
We next utilized logistic regression and calculated odds ratios (OR) testing independently for both heterozygotes and homozygotes carrier states omitting both ECOG cases and CGEMS controls not exhibiting >90% CEU class membership (Table 1). rs1219648/FGFR2 showed association in the ECOG cases exhibiting a heterozygote and homozygote OR of 1.29 and 1.72 (p=0.0052) for the minor allele (G). These ORs are similar to those observed for the original CGEMS findings of 1.25 and 1.81 for heterozygotes and homozygotes. rs1970801-T also exhibited association in the ECOG cases with an OR of 1.24 and 1.84 for heterozygotes and homozygotes (p=0.00048). These OR's are comparable to those previously observed in the CGEMS study (1.21 for T/G and 1.65 for T/T). In contrast, rs6831418 did not exhibit significant association (p=0.177) in our cases. One explanation for the lack of confirmatory association with rs6831418 may stem from departure from Hardy Weinberg equilibrium (HWE) in both CGEMS cases and controls while all 3 SNPs were in HWE for our ECOG cases (Supplementary Table S3). As final verification of association we genotyped rs1434536 in our cases and, utilizing the CEU HapMap LD structure, imputed genotypes for rs1434536 in admixture-corrected CGEMS controls. We observed association in our cases with OR = 1.29 for T/C heterozygotes and OR = 1.94 for major allele homozygote T/T (Table 1). Based on the replication of association in our BrCa cases for rs1219648/FGFR2, rs1970801-T and rs1434536-T we concluded that rs1434536 was indeed associated with disease risk.
Table 1. Association Testing in ECOG Breast Cancer Cases and Common CGEMS Controls.
Top, association testing with ECOG breast cancer cases (n=455) and common CGEMS controls (n=1064) which have been corrected for genetic admixture with Ancestry Informative Markers (see Materials and Methods). Bottom, original CGEMS association data (Hunter, et al.) [10]. HWE, Hardy Weinberg equilibrium.
| ECOG cases (n = 428) (admixture adjusted) | CGEMS controls (n = 1064) (admixture adjusted) | ECOG cases + CGEMS controls | ||||||||
|---|---|---|---|---|---|---|---|---|---|---|
| SNP | GT | Count | Prop | HWE | Count | Prop | HWE | OR | 95% CI | P-value1 |
| rs1219648 | A/A | 129 | 0.31 | 0.694 | 405 | 0.38 | 0.698 | 1.00 | 5.2E-3 | |
| Het | A/G | 204 | 0.48 | 497 | 0.47 | 1.29 | 1.00–1.67 | |||
| Minor | G/G | 88 | 0.21 | 161 | 0.15 | 1.72 | 1.24–2.38 | |||
| rs1970801 | G/G | 58 | 0.14 | 0.834 | 203 | 0.19 | 0.292 | 1.00 | ||
| Het | T/G | 192 | 0.46 | 543 | 0.51 | 1.24 | 0.88–1.73 | 4.8E-4 | ||
| Major | T/T | 167 | 0.40 | 317 | 0.30 | 1.84 | 1.30–2.61 | |||
| rs6831418 | C/C | 121 | 0.29 | 0.427 | 349 | 0.33 | 0.037 | 1.00 | 1.8E-1 | |
| Het | C/T | 213 | 0.52 | 549 | 0.52 | 1.12 | 0.86–1.45 | |||
| Minor | T/T | 79 | 0.19 | 165 | 0.16 | 1.38 | 0.98–1.94 | |||
| rs14345362 | C/C | 67 | 0.16 | 1.000 | 203 | 0.19 | 0.320 | 1.00 | 1.6E-43 | |
| Het | T/C | 200 | 0.48 | 543 | 0.51 | 1.29 | 0.95–1.74 | |||
| Major | T/T | 148 | 0.36 | 318 | 0.30 | 1.94 | 1.40–2.71 | |||
Unadjusted p-value from the score test with df=2 in Logistic regression
Genotypes in CGEMS controls imputed by IMPUTE
Score test with df=2 (performed by SNPTEST) and considering imputation uncertainty
miR-125b differentially regulates the allelic variants of rs1434536
Next we tested a biological model where miR-125b differentially regulates the C/T allelic variants of rs1434536 in BMPR1B. In this model, rs1434536-T results in increased BMPR1B transcript levels which gives an increased BrCa risk as demonstrated by the association testing. Computational models of miRNA target interactions predicted that miR-125b would downregulate the C allele more strongly than the T allele, as the T allele forms a weaker 6mer seed site for miR-125b binding (Fig. 2) [21]. The PITA thermodynamic model of miRNA binding supports this allelic difference. The algorithm models miRNA targeting as a competition between the free energy gained by miRNA binding and the energetic cost of displacing existing RNA secondary structure at the target site [28]. PITA summarizes this model in the ΔΔG score, where smaller values indicate stronger miRNA binding. Inputting the 200 nucleotides centered on rs1434536-C/T alleles to PITA gave ΔΔG values of −0.53 and 3.09, which suggested reduced binding of miR-125b to BMPR1B for the T allele.
To test our model, we cloned partial BMPR1B 3'UTR fragments from a rs1434536 heterozygote into the luciferase 3'UTR reporter vector psiCHECK-2 to compare the luciferase activities between the two alleles at rs1434536. Vectors containing either C or T alleles were transiently transfected into ER+ and ER− cell lines and Renilla luciferase activity was measured. When transfected into MCF-7 (ER+) cells the C-allele gave a 38% reduced luciferase activity relative to the T allele consistent with our model (Fig. 3b). However, when we tested luciferase activity in MD-MBA-231 (ER−) cells; we observed no difference between the C and T alleles. Additionally, the overall luciferase activities observed were lower in MDA-MB-231 cells relative to MCF-7 cells which may reflect the higher levels of miR-125b in this cell line [22].
Figure 3. Allelic variation of rs1434536 influences luciferase reporter activity and miR-125b targeting.
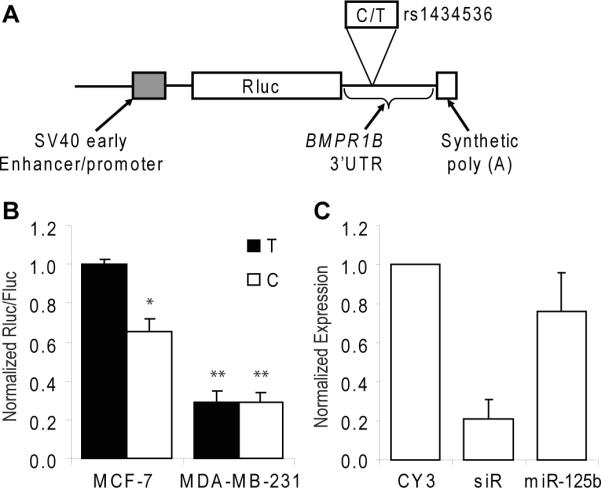
(A), structure of luc allelic reporter constructs depicting psiCheck-2.2 (Promega) dual luciferase reporter constructs. (B), luciferase reporter assays to measure C→T allele differences at rs1434536. Cells were transiently transfected with C or T bearing reporters into MCF-7 or MDA-MB-213 cells which is predicted to influence the recognition of the miR-125b seed sequence in the BMPR1B 3'UTR. After 48 h Renilla luciferase (hRluc) activity was measured and normalized to Firefly luciferase. Results are shown as percentage relative to luciferase activity. Data are from four independent transfection experiments with assays performed in triplicate (n=4). *, P<0.05; **, P >0.05. (C), miR-125b weakly downregulates BMPR1B. MCF-7 cells were transfected with siRNA duplexes and RNAs were harvested 24 h post transfection. cDNA was synthesized and used for real-time qRT-PCR analysis of BMPR1B expression normalized to a GAPDH standard. CY3, scrambled negative control siRNA; siR, siRNA duplex targeting position 867 in BRPR1B; miR-125b, duplex mimicking hsa-miR-125b and targeting the C allele at rs1434536. Expression levels are relative to the CY3 control (n=3).
As an additional test of our model, we transiently transfected synthetic miR-125b oligos into MCF-7 and MDA-MB-231 cells, and quantitated endogenous BMPR1B transcript levels by qRT-PCR. Prior genotyping MCF-7 and MDA-MB-231 cells revealed homozygous T and C genotypes at rs1434536 respectively. The oligonucleotides, which mimicked the annotated hsa-miR-125b:hsa-miR-125b-1* duplex, only weakly downregulated BMPR1B in MCF-7 (Fig. 3c), which is consistent with our model. In contrast, transfection with a miRNA mimic (siR), not targeting the miR-125b site, resulted in an 80% reduction in BMPR1B transcript levels. When we tested these duplexes in MDA-MB-231 cells, BMPR1B levels were less than 1/50 of the levels in MCF-7 and below the assay's detection limit (data not shown). The low levels of BMPR1B levels in ER− MDA-MB-231 cells were consistent with our prior meta-analysis from ER+ and ER− tumors and with increased levels of endogenous miR-125b in 231 cells [22].
DISCUSSION
Both rs1434536-T and rs1970801-T were shown to be associated with increased risk in an independent cohort of admixture-corrected cases and controls. We have demonstrated that miR-125b negatively regulates BMPR1B and that C/T allelic variation (rs1434536) within the target site disrupts miR-125b's regulation. The presence of rs1434536-T leads to loss of miR-125b regulation, increased BMPR1B expression and ultimately elevated disease risk. Consistent with this, increased BMPRIB expression is associated with high tumor grade, proliferation, cytogenetic instability, and a poor prognosis in ER+ breast carcinomas [29]. Moreover, breast cancers in general and ER+ tumors in particular seem to have reduced levels of miR-125b [22–24], which in the light of these results, at least partly explain why ER+ tumors have increased BMPR1B expression [14].
BMPR1B binds bone morphogenetic proteins (BMP) and are multifunctional signaling molecules that belong to the transforming growth factor beta (TGF-β) superfamily and were first identified based on their ability to form bone at extraskeletal sites [30]. Once activated, BMP/receptor complexes phosphorylate cytosolic SMAD proteins which translocate to nucleus and regulate target genes [31]. Our findings indicate that ER+ patients harboring elevated BMPR1B transcript levels may have poorer outcomes when carrying the risk-associated rs1434536-T allele. While not only identifying a new target for further study, these results demonstrate the importance of combining tumor expression profiles and genotype data in determining a patients' clinical prognosis.
More generally, our methodology has identified a set of allelic variants present in miRNA recognition sites within a set of dysregulated ER responsive genes. Independent of our efforts, Adams et al identified rs9341070 in a miR-206 site in the ESR 3'UTR. Allelic variation at this SNP was shown to influence ESR expression over 3-fold in HeLa cells [20]. This SNP resides in a domain upstream of the miRNA seed targeting sequence (nucleotides 2–8) yet we identified this same SNP by virtue of it presence in a miR-122 seed region (Supplementary Table S1). However, due to the low frequency of rs9341070 in CEU samples (<0.01) this SNP is not represented in any GWAS array. This illustrates a common deficiency of GWAS datasets: the absence of low frequency/rare SNPs which may also play a role in disease risk [32]. One would anticipate that appropriately powered future association studies of these potential miRNA interacting rare variants may support their role in risk.
We found that T/T homozygotes at rs1970801 had slightly higher odds ratios in our ECOG cases (1.84) compared with the CGEMS cases (1.65) and this could be explained by differences in case ascertainment. CGEMS cases were recruited from a prospective cohort study where only 22% (274/1145) reported first degree family history as opposed to our cases whereby all cases exhibited first-degree family history, namely an affected sibling. Second, all CGEMS cases were of post-menopausal disease while only half of the ECOG cases indicated an age of diagnosis <50. These differences indicate that the genetic contribution to risk may have been underestimated for rs1970801-T in the CGEMS study reinforcing the importance of family history in confirmatory replication studies as this may be valuable for later risk-assessment predictions. We observed a higher OR for TT homozygotes at rs1434536 when we tested for association with imputed genotypes in the CGEMS controls compared to rs1970801 TT homozygotes (1.94 versus 1.84; Table 1). These results also highlight both the merits of the tagging SNPs utilized in the GWAS studies and the utility of imputation for deriving missing genotypes.
Our replication of prior disease associations for two SNPs (Table 1) relied on using a set of AIMs to correct for differences in genetic admixture between our cases and CGEMS controls. Approximately 6–7% of CGEMS controls and CGEMS cases (data not shown) demonstrated <90% CEU ancestry as defined by HapMap reference samples. This indicates that population substructure introduced by intercontinental admixture may have contributed to potential false positives or missed associations in the original CGEMS data. To rectify this it has been proposed that AIM panels should be employed prior to GWA tests [26]. More subtle levels of admixture within both European and Chinese populations have recently been described which will necessitate the continued use of extended AIM panels to discern finer levels of population substructure as a prelude to association testing and biological testing [33–35].
The usefulness of GWAS data for identifying BrCa susceptibility alleles is premised on the common disease-common variant hypothesis whereby SNPs (>5% frequency) may act as surrogates to identify causal variants. Replication studies of the very top tier signals in breast cancer have firmly established some associations; however, modest signals in first round GWAS screens may not be selected for rescreening [36]. Thus we feel it is likely that future meta-analyses of multiple GWAS datasets will provide additional candidates for examination [37].
These findings have implicated a germline variant in BrCa susceptibility and provided a strong model for biological causality via miRNAs. Our approach relies on integrating association data, expression profiles and testable biological models to evaluate potential disease alleles in pathogenesis [38]. As GWAS have identified only common SNPs as genetic risk factors, it is likely that many rare alleles present within motifs for miRNAs and additional trans-acting regulators (i.e. transcription factors) remain to be identified. In addition, approaches such as whole genome sequencing and the identification of common recurrent somatic mutations in breast tumors may provide a large collection of potential disease alleles for exploration [39, 40].
Supplementary Material
Acknowledgments
Grant Support This study was supported by Susan G. Komen for the Cure Basic, Clinical and Translational Research Grant BCTR0504486 (GPL). PS received support from the Norwegian Functional Genomics Program (FUGE) of the Norwegian Research Council. LFT received support from the Norwegian Research Council. JB was a participant in the Southern California Bioinformatics Institute Summer Academy (NSF-NIH EEC-0609454). JJR is funded by (HL074704). We thank the ECOG study subjects in E1Y97 for their participation.
Glossary
List of abbreviations
- BrCa
breast cancer
- ER+ and ER−
estrogen receptor positive and negative
- 3'UTR
3' untranslated region
- MSKCC
Memorial Sloan Kettering Cancer Center
- ECOG
Eastern Cooperative Oncology Group
Footnotes
http://microrna.sanger.ac.uk/; Release 9.1
http://www.hapmap.org/; Release #21
References
- 1.Ambros V. The functions of animal microRNAs. Nature. 2004;431(7006):350–5. doi: 10.1038/nature02871. [DOI] [PubMed] [Google Scholar]
- 2.Kloosterman WP, Plasterk RH. The diverse functions of microRNAs in animal development and disease. Dev Cell. 2006;11(4):441–50. doi: 10.1016/j.devcel.2006.09.009. [DOI] [PubMed] [Google Scholar]
- 3.Esquela-Kerscher A, Slack FJ. Oncomirs - microRNAs with a role in cancer. Nat Rev Cancer. 2006;6(4):259–69. doi: 10.1038/nrc1840. [DOI] [PubMed] [Google Scholar]
- 4.Kumar MS, et al. Impaired microRNA processing enhances cellular transformation and tumorigenesis. Nat Genet. 2007;39(5):673–7. doi: 10.1038/ng2003. [DOI] [PubMed] [Google Scholar]
- 5.Yu Z, et al. Aberrant allele frequencies of the SNPs located in microRNA target sites are potentially associated with human cancers. Nucleic Acids Res. 2007;35(13):4535–41. doi: 10.1093/nar/gkm480. [DOI] [PMC free article] [PubMed] [Google Scholar]
- 6.Landi D, et al. Polymorphisms within micro-RNA-binding sites and risk of sporadic colorectal cancer. Carcinogenesis. 2008;29(3):579–84. doi: 10.1093/carcin/bgm304. [DOI] [PubMed] [Google Scholar]
- 7.Loi S, Piccart M, Sotiriou C. The use of gene-expression profiling to better understand the clinical heterogeneity of estrogen receptor positive breast cancers and tamoxifen response. Crit Rev Oncol Hematol. 2007;61(3):187–194. doi: 10.1016/j.critrevonc.2006.09.005. [DOI] [PubMed] [Google Scholar]
- 8.Dobbe E, et al. Gene-expression assays: new tools to individualize treatment of early-stage breast cancer. Am J Health Syst Pharm. 2008;65(1):23–8. doi: 10.2146/ajhp060352. [DOI] [PubMed] [Google Scholar]
- 9.Consortium WTCC. Genome-wide association study of 14,000 cases of seven common diseases and 3,000 shared controls. Nature. 2007;447(7145):661–78. doi: 10.1038/nature05911. [DOI] [PMC free article] [PubMed] [Google Scholar]
- 10.Hunter DJ, et al. A genome-wide association study identifies alleles in FGFR2 associated with risk of sporadic postmenopausal breast cancer. Nat Genet. 2007;39(7):870–4. doi: 10.1038/ng2075. [DOI] [PMC free article] [PubMed] [Google Scholar]
- 11.Easton DF, et al. Genome-wide association study identifies novel breast cancer susceptibility loci. Nature. 2007;447:1087–93. doi: 10.1038/nature05887. [DOI] [PMC free article] [PubMed] [Google Scholar]
- 12.Stacey SN, et al. Common variants on chromosomes 2q35 and 16q12 confer susceptibility to estrogen receptor-positive breast cancer. Nat Genet. 2007;39(7):865–9. doi: 10.1038/ng2064. [DOI] [PubMed] [Google Scholar]
- 13.Gold B, et al. Genome-wide association study provides evidence for a breast cancer risk locus at 6q22.33. Proc Natl Acad Sci U S A. 2008 doi: 10.1073/pnas.0800441105. [DOI] [PMC free article] [PubMed] [Google Scholar]
- 14.Smith DD, et al. Meta-analysis of breast cancer microarray studies in conjunction with conserved cis-elements suggest patterns for coordinate regulation. BMC Bioinformatics. 2008;9:63. doi: 10.1186/1471-2105-9-63. [DOI] [PMC free article] [PubMed] [Google Scholar]
- 15.Tworoger SS, et al. A prospective study of plasma prolactin concentrations and risk of premenopausal and postmenopausal breast cancer. J Clin Oncol. 2007;25(12):1482–8. doi: 10.1200/JCO.2006.07.6356. [DOI] [PubMed] [Google Scholar]
- 16.Larson GP, et al. An allelic variant at the ATM locus is implicated in breast cancer susceptibility. Genet Test. 1997;1(3):165–70. doi: 10.1089/gte.1997.1.165. [DOI] [PubMed] [Google Scholar]
- 17.Rioux JD, et al. Genome-wide association study identifies new susceptibility loci for Crohn disease and implicates autophagy in disease pathogenesis. Nat Genet. 2007;39(5):596–604. doi: 10.1038/ng2032. [DOI] [PMC free article] [PubMed] [Google Scholar]
- 18.Kosoy R, et al. Ancestry informative marker sets for determining continental origin and admixture proportions in common populations in America. Hum Mutat. 2008;30(1):69–78. doi: 10.1002/humu.20822. [DOI] [PMC free article] [PubMed] [Google Scholar]
- 19.Marchini J, et al. A new multipoint method for genome-wide association studies by imputation of genotypes. Nat Genet. 2007;39(7):906–13. doi: 10.1038/ng2088. [DOI] [PubMed] [Google Scholar]
- 20.Adams BD, Furneaux H, White BA. The micro-ribonucleic acid (miRNA) miR-206 targets the human estrogen receptor-alpha (ERalpha) and represses ERalpha messenger RNA and protein expression in breast cancer cell lines. Mol Endocrinol. 2007;21(5):1132–47. doi: 10.1210/me.2007-0022. [DOI] [PubMed] [Google Scholar]
- 21.Grimson A, et al. MicroRNA targeting specificity in mammals: determinants beyond seed pairing. Mol Cell. 2007;27(1):91–105. doi: 10.1016/j.molcel.2007.06.017. [DOI] [PMC free article] [PubMed] [Google Scholar]
- 22.Iorio MV, et al. MicroRNA gene expression deregulation in human breast cancer. Cancer Res. 2005;65(16):7065–70. doi: 10.1158/0008-5472.CAN-05-1783. [DOI] [PubMed] [Google Scholar]
- 23.Blenkiron C, et al. MicroRNA expression profiling of human breast cancer identifies new markers of tumor subtype. Genome Biol. 2007;8(10):R214. doi: 10.1186/gb-2007-8-10-r214. [DOI] [PMC free article] [PubMed] [Google Scholar]
- 24.Mattie MD, et al. Optimized high-throughput microRNA expression profiling provides novel biomarker assessment of clinical prostate and breast cancer biopsies. Mol Cancer. 2006;5:24. doi: 10.1186/1476-4598-5-24. [DOI] [PMC free article] [PubMed] [Google Scholar]
- 25.Plenge RM, et al. Two independent alleles at 6q23 associated with risk of rheumatoid arthritis. Nat Genet. 2007;39(12):1477–82. doi: 10.1038/ng.2007.27. [DOI] [PMC free article] [PubMed] [Google Scholar]
- 26.Tian C, Gregersen PK, Seldin MF. Accounting for ancestry: population substructure and genome-wide association studies. Hum Mol Genet. 2008;17(R2):R143–50. doi: 10.1093/hmg/ddn268. [DOI] [PMC free article] [PubMed] [Google Scholar]
- 27.Halder I, et al. A panel of ancestry informative markers for estimating individual biogeographical ancestry and admixture from four continents: utility and applications. Hum Mutat. 2008;29(5):648–58. doi: 10.1002/humu.20695. [DOI] [PubMed] [Google Scholar]
- 28.Kertesz M, et al. The role of site accessibility in microRNA target recognition. Nat Genet. 2007;39(10):1278–84. doi: 10.1038/ng2135. [DOI] [PubMed] [Google Scholar]
- 29.Helms MW, et al. First evidence supporting a potential role for the BMP/SMAD pathway in the progression of oestrogen receptor-positive breast cancer. J Pathol. 2005;206(3):366–76. doi: 10.1002/path.1785. [DOI] [PubMed] [Google Scholar]
- 30.Wozney JM. Overview of bone morphogenetic proteins. Spine. 2002;27(16 Suppl 1):S2–8. doi: 10.1097/00007632-200208151-00002. [DOI] [PubMed] [Google Scholar]
- 31.Kawabata M, Imamura T, Miyazono K. Signal transduction by bone morphogenetic proteins. Cytokine Growth Factor Rev. 1998;9(1):49–61. doi: 10.1016/s1359-6101(97)00036-1. [DOI] [PubMed] [Google Scholar]
- 32.McCarthy MI, et al. Genome-wide association studies for complex traits: consensus, uncertainty and challenges. Nat Rev Genet. 2008;9(5):356–69. doi: 10.1038/nrg2344. [DOI] [PubMed] [Google Scholar]
- 33.Novembre J, et al. Genes mirror geography within Europe. Nature. 2008 August; doi: 10.1038/nature07331. [DOI] [PMC free article] [PubMed] [Google Scholar]
- 34.Tian C, et al. Analysis of East Asia genetic substructure using genome-wide SNP arrays. PLoS ONE. 2008;3(12):e3862. doi: 10.1371/journal.pone.0003862. [DOI] [PMC free article] [PubMed] [Google Scholar]
- 35.Seldin MF, Price AL. Application of ancestry informative markers to association studies in European Americans. PLoS Genet. 2008;4(1):e5. doi: 10.1371/journal.pgen.0040005. [DOI] [PMC free article] [PubMed] [Google Scholar]
- 36.Garcia-Closas M, et al. Heterogeneity of breast cancer associations with five susceptibility Loci by clinical and pathological characteristics. PLoS Genet. 2008;4(4):e1000054. doi: 10.1371/journal.pgen.1000054. [DOI] [PMC free article] [PubMed] [Google Scholar]
- 37.Zintzaras E, Lau J. Trends in meta-analysis of genetic association studies. J Hum Genet. 2008;53(1):1–9. doi: 10.1007/s10038-007-0223-5. [DOI] [PubMed] [Google Scholar]
- 38.McCarthy MI, Hirschhorn JN. Genome-wide association studies: potential next steps on a genetic journey. Hum Mol Genet. 2008;17(R2):R156–65. doi: 10.1093/hmg/ddn289. [DOI] [PMC free article] [PubMed] [Google Scholar]
- 39.Wood LD, et al. The genomic landscapes of human breast and colorectal cancers. Science. 2007;318(5853):1108–13. doi: 10.1126/science.1145720. [DOI] [PubMed] [Google Scholar]
- 40.Bentley DR, et al. Accurate whole human genome sequencing using reversible terminator chemistry. Nature. 2008;456(7218):53–9. doi: 10.1038/nature07517. [DOI] [PMC free article] [PubMed] [Google Scholar]
Associated Data
This section collects any data citations, data availability statements, or supplementary materials included in this article.