Abstract
Analysis of formalin-fixed and paraffin-embedded tissues (FFPE) is increasingly recognized as a strategy for the discovery and validation of clinically useful biomarker candidates. Large tissue collections including tissue microarrays (TMA) are available but current analytical strategies for their characterization have limited throughput. In this report, we describe a workflow for rapid analysis of hundreds of FFPE tissue specimens. The strategy combines parallel sample processing and on-chip electrophoresis with automated MALDI MS analysis. The method is optimized for small quantities of clinically valuable tissues allowing detection of hundreds of peptides from a single core in a TMA section. We describe results from the optimization of the method and apply it for the analysis of tissue microarrays containing formalin fixed tissue specimens from human kidney.
Keywords: Formalin-fixed and paraffin-embedded tissues, mass spectrometry, biomarker discovery, Matrix-assisted laser desorption/ionization, electrophoresis, LC MALDI, proteomics
INTRODUCTION
Vast archival collections of formalin-fixed paraffin embedded (FFPE) tissue samples are a valuable discovery source for biomarker discovery since in many cases patient outcomes are known. FFPE procedures are routinely used to prepare surgical specimens for histological analysis and to render the tissue suitable for long-term storage. Unfortunately, direct protein analysis from FFPE specimens are not directly amenable to MS analysis as the chemical fixation with formalin creates a network of insoluble cross linked proteins 1. Recovery of proteins from FFPE tissue can be achieved through a procedure known as antigen retrieval (AR), a process developed to restore antigen-antibody reactivity in immunohistochemistry 2. Antigen retrieval has been successfully adapted for analysis of FFPE tissue using MS3, 4 but can introduce MS incompatible reagents such as detergents and buffers, making time consuming sample clean-up necessary prior to mass spectrometric analysis. In turn, sample clean-up and fractionation steps severely limits throughput.
A new device for parallel electrophoretic sample processing for proteins and peptides has been developed 5 and we have employed it in our FFPE tissue analysis strategy as a clean-up stage. Using native electrophoresis as the separation principle, up to 96 samples can be processed in parallel with typical run times of less than an hour. The charge and electrophoretic mobility of analytes is controlled by the sample buffer, the polarity of the electric potential applied and the pore size of the polyacrylamide gel plug in each separation well. Keeping the running buffer constant and using multiple individual wells, separation into distinct fractions can be achieved. Compounds such as proteins and peptides are then captured on a monolithic reverse phase capture chip directly below the electrophoresis gel. The capture chip is removed, mounted into an extraction device and analytes are eluted with the MALDI matrix solution or solvent into microvials for direct MALDI MS or ESI MS analysis. MALDI MS is especially useful if large numbers of samples need to be analyzed as it offers extremely high throughput.
This paper describes the protocol and its optimization for high-throughput analysis of FFPE tissues using parallel electrophoresis and analysis by MALDI-FTICR. Uniquely, after completion of the dissection phase, the optimized workflow is capable of analyzing several hundred samples per day, permitting rapid screening of vast FFPE tissue depositories for markers in disease of clinically relevant queries.
MATERIALS AND METHODS
Reagents
All chemicals were purchased from Sigma-Aldrich (St. Louis, MO, USA) and were of highest purity available. HPLC grade acetonitrile (ACN) and ethanol, enzyme grade tween-20 detergent, histological grade xylenes, diammonium citrate and parafilm M were purchased from Fisher Scientific (Air Lawn, NJ). Trifluoroacetic acid (TFA) and α-cyano-4-hydroxycinnamic acid (CHCA) were purchased from Fluka (Buchs, Switzerland). The CHCA matrix was 2x recristallized from ethanol and water. Ammonium bicarbonate (AMBIC), iodoacetamide (IAA), 1,4-Dithioerythritol (DTE) and neutral buffered formalin solution 10 % were obtained from Sigma-Aldrich. Sequencing grade modified trypsin was purchased from Promega (Madison, WI, USA). Peptide standard mix and protein standard mix for MALDI-TOF-(TOF) calibration were from Bruker-Daltonics (Billerica, MA).
Tissue processing
Adult CD-1 mice were scarified and dissected organs were immediately snap- frozen in liquid nitrogen or subjected to fixation in 10 % neutral buffered formalin. Sectioning of the fresh frozen tissue was described in detail elsewhere6. Formalin fixation was performed on tissue specimens not thicker than 500 μm to allow rapid penetration of the fixative. Fixation was carried out for 41.5 h at room temperature and tissue was transferred into 70 % ethanol. Further tissue processing including paraffin embedding and sectioning was carried out at the Vanderbilt Human Tissue Acquisition Core. Sections were cut with a microtome with section thicknesses of 5–40 μm. The tissue was mounted onto 1–8 layers of laboratory Parafilm M for punching experiments or standard glass slides for H&E staining. The tissue micropunch consisted of a 21.5 gauge guide wire assembly (Small Parts, Inc, Miramar, FL) or commercially available 0.35 and 2 mm diameter Harris uni-core punches (Ted Pella Inc, Redding, CA). Punching was carried out on a self-healing punching mat from the same manufacturer and the punch was carefully cleaned between punching to prevent cross contamination.
Antigen retrieval and digestion
Tissue punches corresponding to roughly 60,000 cells or up to 15 μg of FFPE tissue were collected in a 150 μl well of an Eppendorf (Hamburg, Germany) 96 well twin.tec PCR plate. Twenty μl of the antigen retrieval solution consisting of 10 mM TRIS, 1 mM EDTA, 10 mM DTE and detergent (see results section for details) was added. Antigen retrieval was carried out in a sand bath at 95 °C or in a STERIS (Mentor, OH) model SV120 laboratory autoclave operated with the standard liquid cycle. In this case, samples were covered with aluminum foil allowing pressure exchange and preventing sample spill during autoclaving. The reaction was allowed to cool for 15 minutes and 2 μl of a 300 mM IAA(aq.) was added. Alkylation was carried out for 15 minutes in the dark. Excess IAA was quenched by adding 5 μl of 100 mM DTE(aq.). Finally, 20 μl 100 mM AMBIC (pH=8.0, 20°C) and trypsin was added and digestion was carried out at 37°C for 15 h. Note that the protein to enzyme ratio was 20:1 but enzyme concentration was at least 1 μg/100 μl if the protein concentration was low. The sample was taken to dryness in a vacuum centrifuge operated at 60°C. It is noted that this protocol scales well for processing of up to 500 μg tissue.
Electrophoresis
Electrophoresis was carried out on a Passport 1200 instrument from Protein Discovery (Knoxville, TN) using Passport RP sample prep cartridges. A detailed description of this instrument can be found somewhere else 5. Briefly, a sample cartridge comprised of 96 individually controlled wells was filled with the running buffer consisting of 689 mM MES pH 5.35 (20°C). Peptides were reconstituted in 40 μl of the sample buffer, 30 % (w/v) sucrose and 45 mM octyl β-D-glucopyranoside prepared in running buffer, and aliquots of this mixture were transferred into the sample cartridge. Electrophoresis was carried out at 1 mA with a total of 2 coulombs passed-charge for cation and anion capture mode respectively. Cation and anion capture experiments were performed in series using a single sample cartridge. Sample buffer (350 μl) was exchanged at 0.5 coulomb for cation capture and 1 coulomb for anion capture experiments. The cartridge was disassembled and the capture chip located beneath the gel plug and the sample well was removed. All 96 capture surfaces were washed simultaneously by immersing the capture chip for 4–6 h in 0.1 % TFA. The capture chip was allowed to dry and mounted into the extraction device provided with the instrument. Peptides were extracted with 3 μl of the matrix solution consisting of 12 mg/ml CHCA and 10 mM diammonium hydrogen citrate prepared in 1:1 acetonitrile/0.2 % TFA (aq.). The extraction was carried out for 60 s prior to 5 aspiration/dispensing cycles with a mechanical pipette for mixing the well content. Finally, 1.5 μl of the well content was directly spotted onto a Bruker MTP 384 polished steel target for MALDI MS analysis. Calculation of peptide pI values was carried out using GPMAW software ver. 8.1 (Lighthouse Data, Denmark) with the Skoog-Wichman algorithm.
Mass Spectrometry
MALDI-FTICR MS was carried out on a 9.4 T Bruker Apex Qe equipped with an Apollo 2 ion source and a modulated Nd : YAG laser7 operated at 100 Hz. External calibration was performed using a custom peptide mixture consisting of Bradykinin 1–7, Angiotensin II, [Glu1]-Fibrinopepdide β, ACTH fragment 18–39 and Insulin chain B oxidized with theoretical m/z ratios of 757.39915, 1046.54179, 1570.67684, 2465.19833 and 3494.65077 respectively. Typical mass accuracy was better than 5 ppm over the observed mass range from 600–4000 Da. The external storage quadrupole was used to accumulate 250 laser shots from a single sample position prior to FTICR analysis. A total of twenty scans were accumulated from each sample spot and saved into a file. Data acquisition was automated using custom software tools written to generate sequences files for the Hystar software (ver. 3.4) supplied with the instrument. Spectra were processed using customized scripts for Bruker DataAnalyis version 4.0 which performed peak picking and export of the peak lists and raw spectra in ASCII format for further processing in OriginPro 7 and Matlab. Monoisotopic peaks were determined using the SNAP-2 algorithm with a minimal S/N of 3:1 and a quality factor of 0.4
LC MALDI for peptide identification
LC-MALDI was carried out on a Agilent 1100 binary pump attached to a flow splitter, manual injection valve with 2 μl sample loop and a 125 μm ID capillary column packed with 8.5 cm 3 μm Monitor C18 resin (Column Engineering. Ontario, CA). The column was attached to an Accuspot spotter (Shimadzu Biotech) for eluent deposition onto a 384 well, 600 μm stainless steel anchor chip from Bruker Daltonics. The chip was prepared with CHCA according to the instructions provided by the manufacturer. The fraction collection interval was set to 30 s and a sheath flow of 0.1 % TFA at 2.8 μl/min was delivered with the matrix pump to assist deposition of the eluting peptides. Peptide separation took place at a flow rate of 1 μl/min using water and acetonitrile with 0.1 % TFA as the eluent. The gradient was ramped from 2–45 % acetonitrile in a 45 minute time window resulting in collection of 90 fractions. MALDI-FTICR MS was performed to determine the accurate mass of the peptides and peptides were automatically sequenced from the same target using an Ultraflex II MALDI TOF/TOF instrument from Bruker Daltonics equipped with Warp LC v 1.1. Finally, database searching was performed using Myrimatch8 and search results were filtered using IdPicker9 software ver. 2.2.2 with a peptide false discovery rate of 5 % Detailed information about the software parameters used for peptide identifications can be found in the supplemental section (Table S-1).
RESULTS AND DISCUSSION
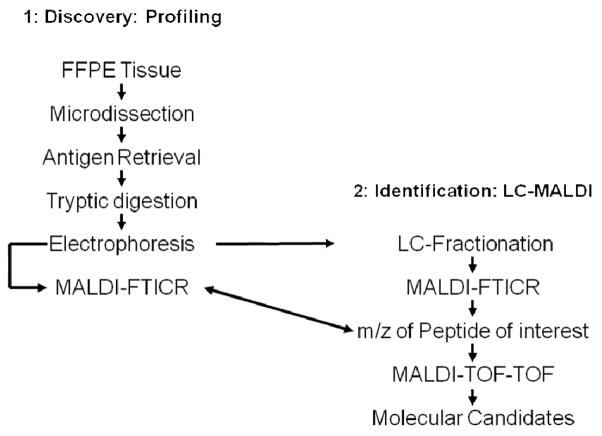
A new workflow for protein biomarker discovery in FFPE tissues is presented (Scheme 1). The strategy combines parallel sample processing and on-chip electrophoresis with MALDI-FTICR to enable high sample throughput. Differentially expressed peptides can be sequenced and identified using LC MALDI MS/MS. In this case, peaks from the profiles are linked to the sequence of the peptide using accurate precursor ion mass measurements on the FTICR instrument. Here we present this protocol and its optimization and apply it for the analysis of small FFPE tissue biopsies and TMA’s.
Scheme 1.
Workflow for high-throughput molecular discovery from FFPE tissue.
Tissue microdissection
Microdissection with a tissue micropunch was used for tissue isolation from selected regions of the specimen determined from histology. Previous work used sections of 200–300 μm thickness mounted on glass slides and a tissue micropunch is used for dissection10. In the current paper, we modified this protocol to allow use of thinner sections, typically 5–40 μm thick. Tissue is placed onto a layer of laboratory parafilm and the membrane is mounted onto a self-healing punching mat. Stained serial sections can be used as a guide for dissection. Punching accuracy and the size of the punch, typically 0.35 to 4 mm defines the spatial resolution. The ability to rapidly obtain relatively large amounts of tissue combined with the possibility to visually track the dissected material during sample handling make this approach a valuable tool for tissue collection in high throughput applications.
Antigen retrieval and tryptic digestion
Optimization of the antigen retrieval protocol was performed using a TRIS buffer which is commonly used for antigen retrieval in immunohistochemistry. The basic composition of the buffer before optimization, was 10 mM TRIS, 1 mM EDTA 10 mM DTE and 0.05 % (6.7 × CMC) tween-20 and the pH of this solution was 8.6 (20°C). TRIS18 and EDTA19 are common AR buffer components and their efficiency has been discussed extensively. DTE was added for reduction of cysteines reducing the number of steps in the workflow. Optimization of antigen retrieval conditions was carried out using a FFPE mouse liver tissue that was dewaxed and then homogenized in a mortar. Particle size analysis of this homogenized material was carried out by microscopic analysis of 50 randomly selected particles. The average particle size was 2 μm ± 1 μm rendering this material useful for all subsequent optimization experiments. The first set of experiments investigated the effect of temperature and incubation time on tissue solubility. FFPE standard tissue was mixed with the antigen retrieval buffer and subjected to antigen retrieval at 95°C in a sand bath or in a laboratory autoclave operated at 121°C. Visual inspection of the samples showed that tissue treated for 1 or 2 h in the sand bath was mostly intact while a single 50 minute autoclave treatment successfully dissolved most of the tissue. Hence, AR in the autoclave was used for all further experiments. The effect of sample pH and detergent was also investigated. Lowering the pH from 8.6 to 4.0 did not improve tissue solubility as judged by visual inspection of the reaction and analysis of peptides after subsequent digestion. These results support evidence that the pH of the antigen solution may be optimized for different tissue types11. The effect of the detergent was studied by varying the concentration of tween-20 (CMC = 0.06 mM) and octyl-β-D-maltoside (CMC = 0.17 mM). Detergent concentrations of 0, 6.7, 27 and 270 × the detergent CMC were investigated. Improved tissue solubility was observed in the presence of the detergent compared with control experiments conducted without. No improvement of tissue solubility was observed above 27 × the CMC of the detergent. Follow up experiments studying digestion of BSA in the presence of the detergents were performed. Improved sequence coverage was observed for tween-20 compared with octyl-β-D-maltoside which showed lower performance at all detergent concentrations tested probably due to interference with the digestion. Hence, tween-20 at a concentration of 27x its CMC was selected as the detergent. The final composition of the antigen retrieval solution was 10 mM TRIS, 1 mM EDTA 10 mM DTE and 0.2 % (27 × CMC) tween-20 prepared at pH 8.6. The advantage of this buffer is that it is compatible with downstream sample processing including tryptic digestion and electrophoresis. This eliminates potential sample loss and improves the speed of the analysis.
Detergent removal and peptide fractionation with parallel on-chip electrophoresis
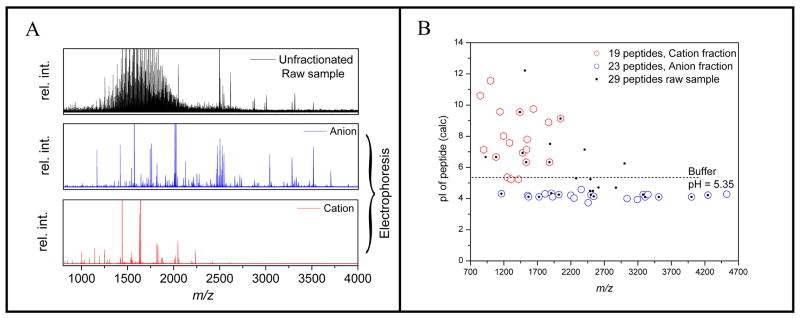
Tolerance of MALDI MS toward salts and detergents is limited and efficient sample clean-up can increase sensitivity and remove spectral interferences. Direct MALDI MS of peptides obtained from antigen retrieved and digested FFPE tissue showed poor matrix crystallization and the mass spectra were dominated by detergent related peaks. Removal of the detergent together with peptide fractionation was initially attempted using SCX chromatography. Peptides were distributed between several fractions and the approach was difficult to automate, resulting in limited throughput. Therefore, electrophoretic on-chip sample preparation5 was investigated as an alternative. For this purpose, samples are mixed with a pH 5.35 running buffer and loaded into wells of an electrophoresis cartridge consisting of 96 individually controlled wells. Electrophoresis is carried out under constant current control (1 mA). Charged molecules are separated on a short acryl amide gel plug and captured on a hydrophobic monolithic capture column for subsequent extraction with the MALDI matrix solution. Fractionation of the peptides can be controlled by the duration of electrophoresis and the polarity and potential applied to the sample reservoir; positive for cation capture and negative for anion capture. Initial optimization of the process was carried out using a tryptic digest of BSA mixed with the antigen retrieval solution. Figure 1A shows successful removal of the detergent and fractionation of the peptides into two complementary fractions. It is noted that detergent related peaks were completely absent after electrophoresis. Detailed analysis of the data (Figure 1B) revealed that peptide fractionation can be predicted by the theoretical pI of a peptide. Importantly, detergent removal and fractionation allowed detection of 42 peptides from BSA while only 19 peptides were identified in the detergent containing raw sample.
Figure 1.
Electrophoretic fractionation of a BSA raw digest containing tween-20 detergent. A) The raw sample shows a strong interference in the mass spectra from the detergent which is completely absent after electrophoresis. B) BSA peptides are fractionated into two complementary fractions defined by the pH of the electrophoresis running buffer. The total number of detected BSA peptides increases from 29 in the detergent containing raw sample to 42 after fractionation.
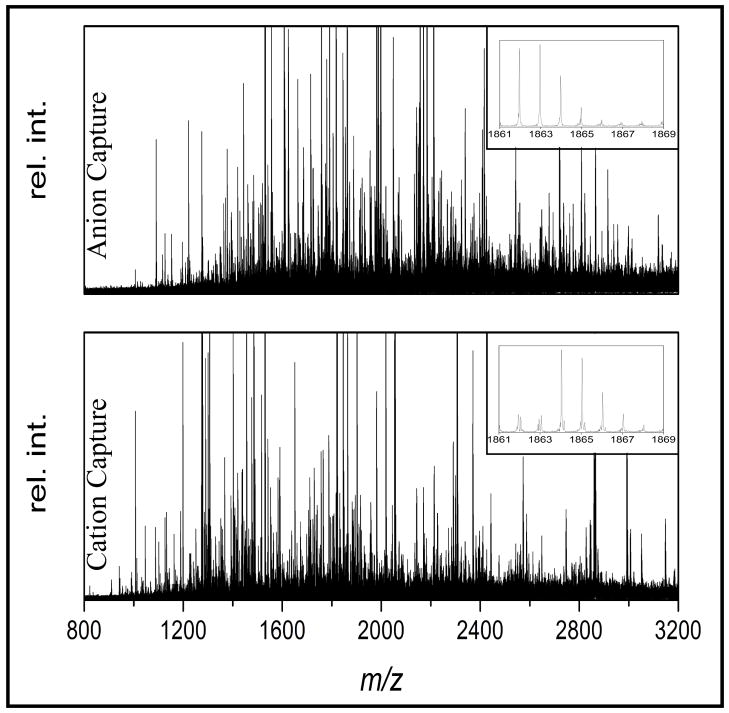
Electrophoresis running conditions were further optimized for the analysis of a tissue digest from antigen retrieved FFPE tissue. Aliquots corresponding to 5 μg FFPE tissue digests were loaded into each well and the charge applied for electrophoresis was varied between 1 and 3 coulombs. The number of detectable monoisotopic ions for each polarity is reported in Table 1. Sample processing time and reproducibility of the data were used as criteria for selection of optimized running conditions; 1 coulomb for cation and 2 coulombs for anion capture respectively. Under these conditions, 588 ions could be detected from the combined cation and anion fractions. Importantly, the spectra showed that most of the peptides in the individual fractions were unique (Figure 2) thereby maximizing peak capacity of the mass spectrometer.
Table 1.
Optimization of running conditions for electrophoresis of 5 μg of FFPE mouse liver tissue.
| Mode | Cation | Anion | ||||
|---|---|---|---|---|---|---|
| Charge C | # peaks | Confidence Interval N=4 | Confidence Interval % | # peaks | Confidence Interval N=4 | Confidence Interval % |
| 1 | 319 | 36 | 11 | 289 | 53 | 19 |
| 2 | 282 | 33 | 12 | 269 | 30 | 11 |
| 3 | 285 | 60 | 21 | 245 | 42 | 17 |
Figure 2.
Complementary peptide patterns are observed from the analysis of 5 μg FFPE mouse liver in both anion and cation capture mode maximizing peak capacity in the mass spectrometer. The total number of detected monoisotopic peptides was 588.
Performance evaluation
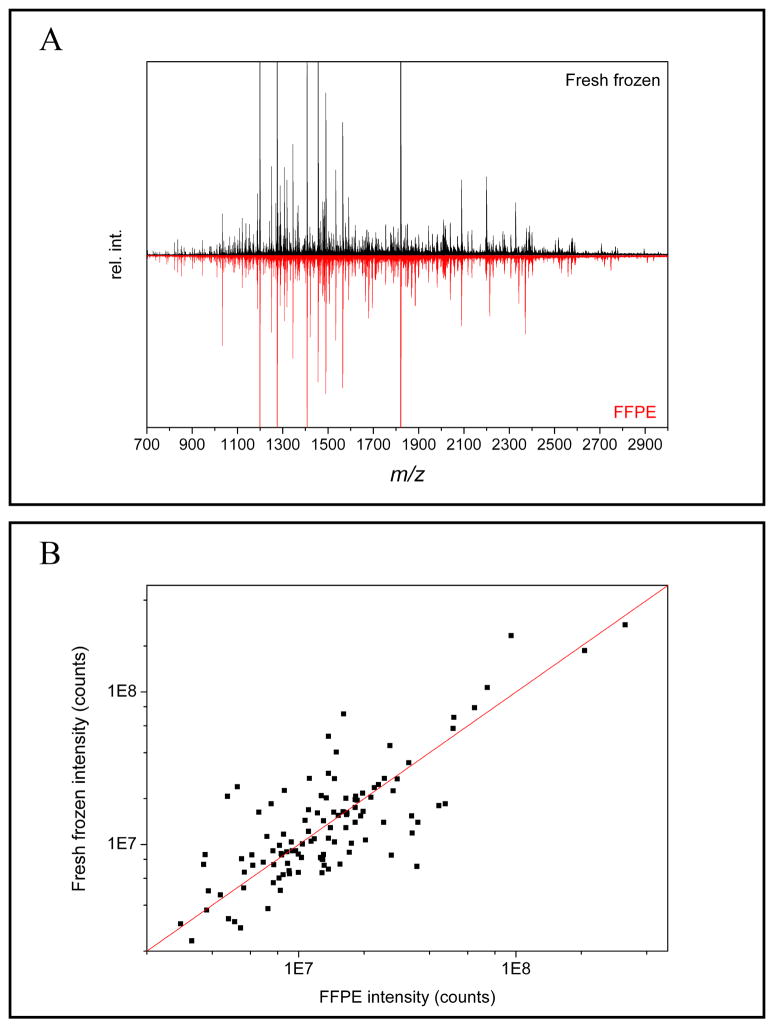
The performance of the method was assessed by comparing fresh frozen and FFPE mouse liver tissue. It is reasonable to expect that similar peptide profiles should be obtained assuming that the antigen retrieval step is optimized. Sections of 30 μm thickness were subjected to microdissection using a 600 μm diameter punch. Six punches from each tissue were combined and processed using the workflow described above. The protein concentration and cell numbers for this experiment were estimated by assuming that 18 %12 of the total mass of a cell is protein and the average diameter of a cell is 10 μm. In this case, 97,200 cells corresponding to 9.2 μg of protein were used in each experiment. Electrophoresis was performed in cation capture mode and spectra from 3 technical repeats were averaged (Figure 3A). Automatic peak picking using the SNAP-2 algorithm resulted in detection of 422 ions from fresh frozen and 366 ions for FFPE tissue. A total of 114 common peaks were detected by binning of the peak lists with a 0.01 Da window and common bins were identified by filtering the data in Excel. It is understood that this approach may reduce the number of common peaks, as common peaks split between two bins may be lost. Nevertheless, the average peak intensity ratio of the selected peaks was evenly distributed around the expected value of 1 (Figure 3B). This indicates that this method can successfully generate peptide patterns from FFPE tissue that are similar the peak patterns from fresh frozen tissue.
Figure 3.
A) Comparison of MALDI FTICR spectra obtained after electrophoretic clean-up of fresh frozen and FFPE mouse liver tissue after antigen retrieval and digestion. Spectra from cation capture experiments are presented showing similar peak patterns. B) Distribution of the peak intensity ratios of common peaks are centered around the expected peak ratio of 1.
The sensitivity and reproducibility of the method was investigated using single tissue micropunches obtained from serial 10 μm thick FFPE mouse liver tissue. Micropunches with 500 μm and 2 mm diameter were used to isolate an estimated 15,000 or 60,000 cells corresponding to 1.4 and 5.7 μg of protein respectively. The sensitivity of the method permits detection of peptide signals from as little as 15,000 cells. Although the quality of the spectra was improved if 60,000 cells were used. In this case 423 and 303 peptides were detectable from cation and anion capture fractions respectively. Repeated analysis of single punches consisting of 60,000 cells generated spectra that were extremely similar. The 95 % confidence interval for the number of detected peaks was better than 12 % for both anion and cation capture mode (N=4).
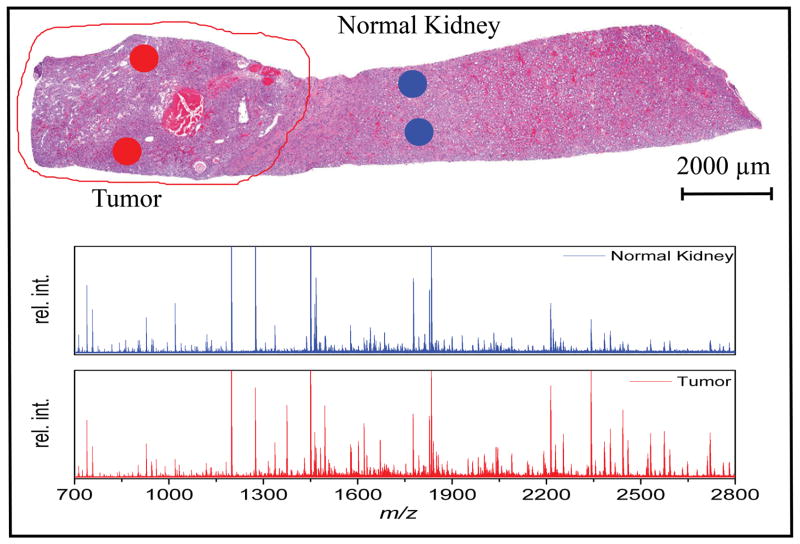
We also applied this protocol for the analysis of TMA specimens and tissue biopsies. For this purpose, a 3×3 TMA from FFPE mouse liver and kidney tissue with 1 mm diameter tissue cores was used. The TMA was cut at 10 um thickness and individual array spots were isolated using a 2 mm tissue micropunch resulting in isolation of an estimated 15000 cells. Mass spectra obtained from these samples showed organ specific peptide patterns indicating that the method has the potential to identify tissue specific peptides. FFPE tissue biopsies from the clinic were also investigated. Figure 4 shows the results from the analysis of a human clear cell renal cell carcinoma after microdissection with the micropunch. Spectra from the tumor and adjacent healthy control tissue show distinct peak patterns indicating that this method can discriminate pathologically relevant tissue regions.
Figure 4.
H&E stained section of a human clear cell renal cell carcinoma sample (Fuhrman grade III) obtained from a FFPE tissue repository with the punched regions marked. Representative spectra after electrophoresis in cation capture mode show distinctly different peak patters between tumor and healthy control tissue.
Identification of differentially expressed peptides
Identification of differentially expressed peptides was achieved using a modified LC MALDI workflow. Scheme 1 shows the overall process. Peptides are eluted from the electrophoresis chip and subjected to LC fractionation, spotting onto anchor chip and accurate mass measurement using MALDI-FTIRC followed by automated sequencing from the same target using MALDI TOF/TOF MS. A detailed summary of the identified peptides from a LC MALDI experiment of mouse liver tissue was included in supplemental section of this paper (table S-2) showing the identification of 240 peptides. The identified peptides can be linked to the profiling data using accurate mass measurement. . This process was tested using FFPE mouse liver. It was possible to identify nominally isobaric peptides as they were separated during the LC experiment. As an example, the peptides KHHLDGETEEER from glutathione S-transferase and LGEYGFQNAILVR and GLVLIAFSQYLQK, both from serum albumin, with calculated monoisotopic m/z of 1479.6823, 1479.7954 and 1479.8570 were identified.
CONCLUSION
A high-throughput workflow for the analysis of FFPE tissues is described. The method takes advantage of parallel on-chip electrophoresis and MALDI-FTICR allowing rapid sample processing. We estimate that several hundred samples can be processed per day making this method an ideal choice for screening of large tissue archives. Over 700 peptides were detected starting with only 60,000 cells but peptides could be detected from as few as 15,000 cells. Peptide profiles from FFPE tissue were similar to profiles obtained from fresh frozen tissue, allowing this technology to be used with large collections of FFPE tissues, having long term clinical data. A modified micropunching technique was developed allowing rapid microdissection from tissue sections as thin as 5 μm. Situations requiring higher dissection accuracy may require LCM, but this can lower throughput. Detergent removal and pI based fractionation using on-chip parallel electrophoresis was critical for efficient sample preparation prior to MALDI MS analysis. Electrophoresis generates peptide fractions that are complementary which reduces spectra complexity, maximizes peak capacity and simplifies downstream data interpretation. Mass spectrometers that provide high mass accuracy and resolving power like FTICR, QTOF and Orbitraps are ideally suited for this application. Identification of the differentially expressed peptides is an important part of overall process as it enables linking of the data to underlying biological processes.
Supplementary Material
Acknowledgments
This work was supported by NIH/NIGMS 5R01GM058008 and DOD W81XWH-05-1-0179. The authors like to thank Dr. Jeremy Norris and Dr. Issa Issac from Protein Discovery (Knoxville, TN) for assistance and support of the Passport 1200 instrument. Anthony Frazier from the Vanderbilt Human Tissue Acquisition Core (supported by NCI grant number P30 CA68485) is recognized for his kind support of this project.
Footnotes
Supporting Information Available: This material is available free of charge via the Internet at http://pubs.acs.org.”
References
- 1.Sompuram SR, Vani K, Bogen SA. American Journal of Clinical Pathology. 2006;125:91–98. [PubMed] [Google Scholar]
- 2.Shi SR, Cote RJ, Taylor CR. J Histochem Cytochem. 2001;49:931–938. doi: 10.1177/002215540104900801. [DOI] [PubMed] [Google Scholar]
- 3.Hood BL, Darfler MM, Guiel TG, Furusato B, Lucas DA, Ringeisen BR, Sesterhenn IA, Conrads TP, Veenstra TD, Krizman DB. Mol Cell Proteomics. 2005;4:1741–1753. doi: 10.1074/mcp.M500102-MCP200. [DOI] [PubMed] [Google Scholar]
- 4.Jiang X, Jiang X, Feng S, Tian R, Ye M, Zou H. J Proteome Res. 2007;6:1038–1047. doi: 10.1021/pr0605318. [DOI] [PubMed] [Google Scholar]
- 5.Harkins JBt, Katz BB, Pastor SJ, Osucha P, Hafeman DG, Witkowski CE, 2nd, Norris JL. Anal Chem. 2008;80:2734–2743. doi: 10.1021/ac702214n. [DOI] [PubMed] [Google Scholar]
- 6.Schwartz SA, Reyzer ML, Caprioli RM. J Mass Spectrom. 2003;38:699–708. doi: 10.1002/jms.505. [DOI] [PubMed] [Google Scholar]
- 7.Holle A, Haase A, Kayser M, Hohndorf J. J MASS SPECTROM. 2006;41:705–716. doi: 10.1002/jms.1041. [DOI] [PubMed] [Google Scholar]
- 8.Tabb DL, Fernando CG, Chambers MC. J Proteome Res. 2007;6:654–661. doi: 10.1021/pr0604054. [DOI] [PMC free article] [PubMed] [Google Scholar]
- 9.Zhang B, Chambers MC, Tabb DL. J Proteome Res. 2007 doi: 10.1021/pr070230d. [DOI] [PMC free article] [PubMed] [Google Scholar]
- 10.Palkovits M. Brain Res. 1973;59:449–450. doi: 10.1016/0006-8993(73)90290-4. [DOI] [PubMed] [Google Scholar]
- 11.Fowler CB, Cunningham RE, O’Leary TJ, Mason JT. Lab Invest. 2007;87:836–846. doi: 10.1038/labinvest.3700596. [DOI] [PubMed] [Google Scholar]
- 12.Alberts B, Johnson A, Lewis J, Raff M, Roberts K, Walter P. Molecular biology of the cell. 4. Garland Science; New York: 2002. [Google Scholar]
Associated Data
This section collects any data citations, data availability statements, or supplementary materials included in this article.


