

Abstract
Background
High concentrations of enflurane will induce a characteristic electroencephalogram pattern consisting of periods of suppression alternating with large short paroxysmal epileptiform discharges (PEDs). In this study, we compared a theoretical computer model of this activity with real local field potential data obtained from anesthetized rats.
Methods
After implantation of a high-density 8x8 electrode array in the visual cortex, the patterns of local field potential and multiunit spike activity were recorded in rats during 0.5, 1.0, 1.5 and 2.0 minimum alveolar anesthetic concentration (MAC) enflurane anesthesia. These recordings were compared with computer simulations from a mean field model of neocortical dynamics. The neuronal effect of increasing enflurane concentration was simulated by prolonging the decay time constant of the inhibitory postsynaptic potential (IPSP). The amplitude of the excitatory postsynaptic potential (EPSP) was modulated, inverse to the neocortical firing rate.
Results
In the anesthetized rats, increasing enflurane concentrations consistently caused the appearance of suppression pattern (>1.5MAC) in the local field potential recordings. The mean rate of multiunit spike activity decreased from 2.54/s (0.5MAC) to 0.19/s (2.0MAC). At high MAC the majority of the multiunit action potential events became synchronous with the PED. In the theoretical model, prolongation of the IPSP decay time and activity-dependent EPSP modulation resulted in output that was similar in morphology to that obtained from the experimental data. The propensity for rhythmic seizure-like activity in the model could be determined by analysis of the eigenvalues of the equations.
Conclusion
It is possible to use a mean field theory of neocortical dynamics to replicate the PED pattern observed in local field potentials in rats under enflurane anesthesia. This pattern requires a combination of a moderately increased total area under the IPSP, prolonged IPSP decay time, and also activity-dependent modulation of EPSP amplitude.
Introduction
There have been a number of publications using theoretical continuum models to describe, in a semi-quantitative fashion, the electroencephalographic (EEG) effects of γ-amino-butyric-acid (GABA)-ergic general anesthetics.1–4 Because of its perceived proconvulsant effects, enflurane is not commonly used in clinical practice. Nevertheless, we have chosen to model enflurane because it is an archetypal epileptogenic volatile general anesthetic5–7 and its molecular mechanisms of action have been widely investigated.8–11 Sevoflurane produces similar EEG patterns, albeit to a lesser degree.12,13 At concentrations of less than ~0.7 minimum alveolar anesthetic concentration (MAC), enflurane will result in slowing and increasing amplitude of the scalp EEG, the cortical depression pattern that is seen with many anesthetic drugs.2,14 At higher concentrations, enflurane produces a different EEG pattern, consisting of episodic high-amplitude sharp waves usually lasting <70ms, within the background EEG activity (Figure 3). These are commonly termed “paroxysmal epileptiform discharges” (PEDs). In this paper we will use this term in preference to the older term, “epileptiform spikes,” because of the potential for confusion with single neuron action potentials, which are also often called spikes. PEDs are sudden synchronous short-lived neuronal depolarizations occurring within a localized area of cerebral cortex. PEDs are not themselves usually associated with any motor manifestations, but may occasionally progress to generalized rhythmic seizure activity. As the concentration of enflurane increases to >1.5MAC, the pattern becomes one of PEDs interspersed with periods of electrical silence (Figure 1b and Figure 3c). Enflurane (and to a lesser extent sevoflurane) thus displays an extreme form of the burst suppression pattern that is seen with high concentrations of all volatile general anesthetics. In contrast, isoflurane is a relatively anticonvulsant volatile anesthetic drug and tends not to produce PEDs12, but instead a more slowly modulated burst pattern. The difference between enflurane and isoflurane burst suppression patterns is shown in Figure 1. Clearly, at high doses, there are substantial differences between the 2 drugs. Burst suppression has been described as a paradoxical state of neuronal suppression coexisting with neuronal hyperexcitability.15 The neuropharmacological mechanisms involved in the production of the burst suppression pattern are not clear at the present time. In a neocortical slice preparation Lukatch, Kiddoo, and MacIver have shown that GABAergic mechanisms alone arenot sufficient to produce a burst suppression pattern – but that additional modulation of excitatory postsynaptic potential(EPSP) activity was required.15 Similarly, the causes of enflurane-induced seizure activity are not well understood. In previous work we, and others, have postulated that the tendency for the cortex to transition to large amplitude oscillations (typical of generalized seizures) results from dynamical instabilities between populations of neurons, 16,17 generated by the fact that enflurane causes the inhibitory input to become very prolonged.18 In effect, we claimed that the observed extreme oscillations in cortical activity could be a consequence of “pathological” interactions between populations of neurons (induced by an excessive lag in the inhibitory neuronal circuits). In the previous paper, we modeled full-blown seizures and did not attempt to model the more common PED/burst suppression EEG pattern, which is seen almost every time the enflurane concentration exceeds ~1.5MAC.
Figure 3.
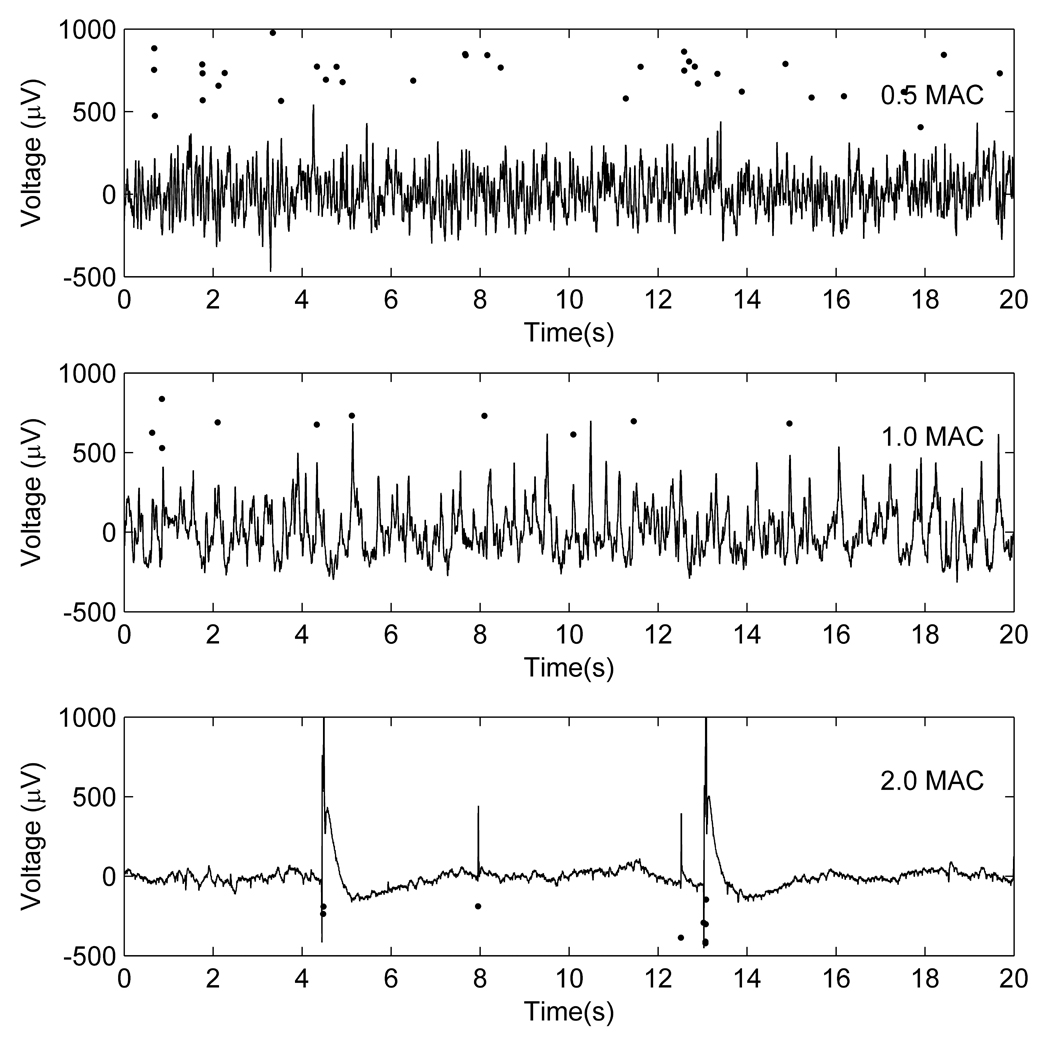
Examples of changes in local field potential patterns with increasing enflurane concentrations. The solid black circles are a raster plot of extracellularly recorded action potentials showing the timing of the action potentials relative to the local field potentials at (a) 0.5, (b) 1.0 and (c) 2.0 MAC.
Figure 1.
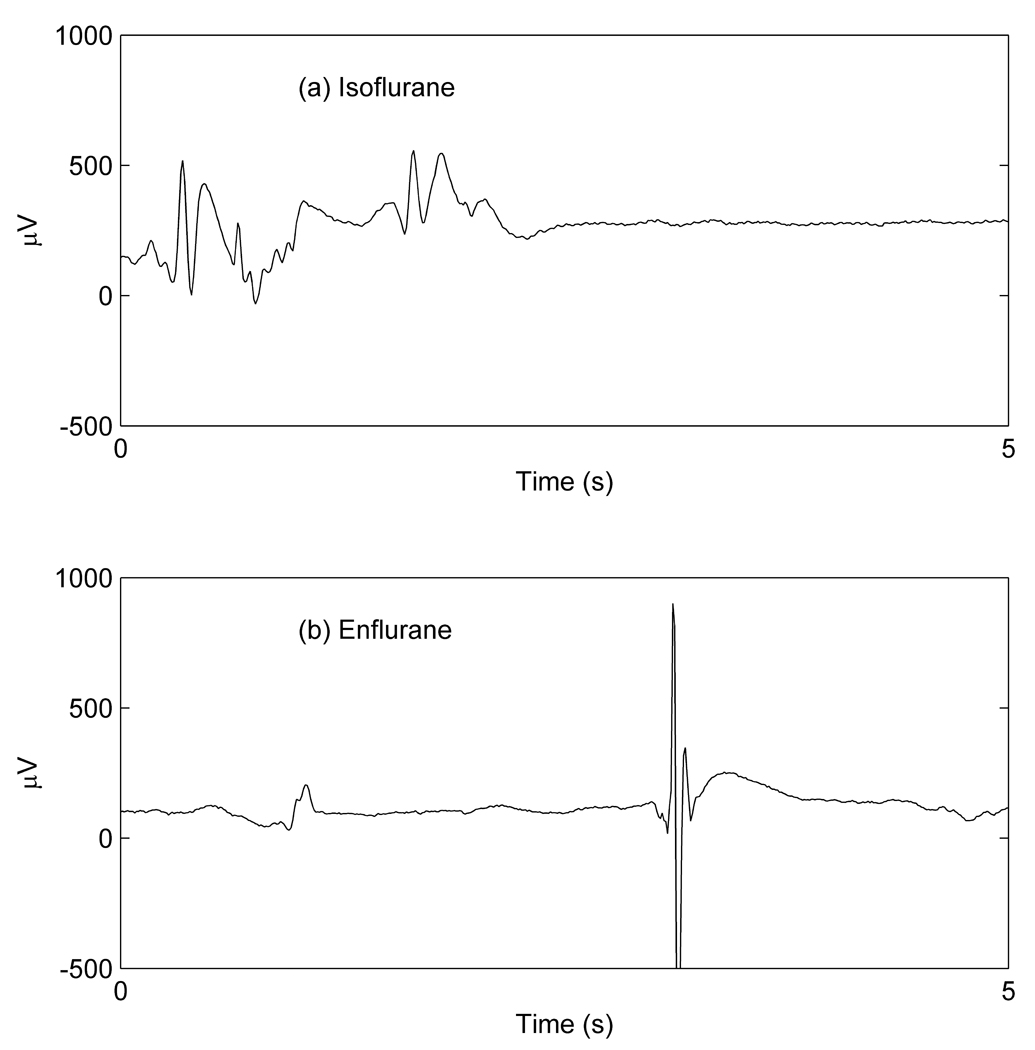
Typical burst suppression/paroxysmal epileptiform discharge patterns in recordings of cortical local field potentials from animals receiving >1.5MAC concentrations of (a) isoflurane and (b) enflurane.
The aim of the present study was to obtain local field potential (LFP) and extracellularly recorded multiunit action potential (MUA) data from a dense 2-dimensional array of electrodes in the visual cortex of rats which had been exposed to a range of different concentrations of enflurane. This would enable us to compare (in some detail) these data with output from the previously described, theoretical continuum model. For almost 10 years, we and others have explored the ability of continuum models to describe EEG patterns in anesthesia, sleep, and seizures.1–4,16,19–23 We refer the reader to an excellent recent review of general anesthesia models by Foster et al.24 There are 2 components to our model: (i) the burst suppression EEG pattern is modeled using slow activity-dependent fluctuations in EPSP amplitude, and (ii) the destabilizing effects of enflurane on cortical activity is modeled as a prolongation of the inhibitory postsynaptic potentials (IPSP) that is out of proportion to the peak amplitude of the IPSP. If the theoretical model is valid, if Lukatch et al's observations are correct, and if we use parameter values that correctly reflect a prolonged IPSP decay time and fluctuating EPSP amplitude, the model should replicate the experimentally observed enflurane-induced PEDs.
Methods
In vivo experimental methods
The experimental procedures and protocols used in this investigation were reviewed and approved by the Institutional Animal Care and Use Committee of the Medical College of Wisconsin, Milwaukee, Wisconsin. All procedures conformed to the Guiding Principles in the Care and Use of Animals of the American Physiologic Society and were in accordance with the Guide for the Care and Use of Laboratory Animals (National Academy Press, Washington, D.C., 1996). Adult male Sprague-Dawley rats were kept in reverse light-dark cycle housing for 10 days before the experiments. Rats of 270–330 gm weight were anesthetized for surgery with desflurane, chosen for its property to allow rapid emergence and in order to avoid an exposure of the animal to enflurane at epileptogenic concentrations before setting up the electrophysiological recording. After tracheostomy and muscle paralysis with 200 mg/kg gallamine, the animals’ lungs were artificially ventilated with oxygen-enriched (30%) air. Inspiratory and expiratory gas concentrations (oxygen, anesthetic, carbon dioxide) were monitored using a clinical anesthesia monitor (POET II, Criticare Systems, Waukesha, WI). Body temperature was thermostatically controlled at 37°C. One femoral artery was cannulated for the measurement of arterial blood pressure and the femoral vein on the other side was cannulated for drug infusion. The head was secured in a stereotaxic apparatus. A craniotomy in a rectangular area of 4× mm was prepared over the occipital cortex of the right hemisphere. The dura was left intact. A square array of 64 microelectrodes (Cyberkinetics, Salt Lake City, UT) for the simultaneous recording of MUA and LFP was inserted into the cortex (Figure 2). The spacing of electrodes in the 8×8 array was 400 µm, the length of each electrode from base to tip was 1.5 mm. The array was inserted through the dura using a pneumatic device (Cyberkinetics, Salt Lake City, UT).
Figure 2.

Diagram of the electrode array in relation to the visual cortex, viewed from the top.
The inserter was angled laterally at 10 degrees from vertical to accommodate the curvature of the cortex. Pneumatic insertion drove the electrode tips to a nominal depth of 0.3 mm below surface. The depth of penetration was then advanced using a fine micromanipulator to approximately 1 mm below dura, targeting layer V pyramidal cells. Mineral oil was applied to the cranial vault to prevent drying of the tissues. A platinum wire serving as a reference electrode was placed into the ipsilateral scalp. After surgery, desflurane anesthesia was discontinued and enflurane administration was started at 2.2 %, corresponding to 1.0 MAC.
Electrical signals from the 64 electrodes were amplified and recorded using a Cerebus data acquisition system (Cyberkinetics/I2S, Salt Lake City, UT). To obtain LFP, the raw analog signal was bandpass-filtered for 1 to 250 Hz, sampled at 500 Hz and stored continuously. For MUA, the signal was bandpass-filtered for 250 Hz to 7.5 kHz and sampled at 30 kHz. Here only were the waveforms of spike events that passed a set threshold saved. Spike thresholding was first performed using a fixed RMS multiplier (part of the Cerebus software) and then manually adjusted for each of the 64 channels, as necessary. Thresholding was performed once, in the enflurane condition. All electrical signals were then recorded for 5 minutes at 4 enflurane concentrations of 0.5, 1.0, 1.5 and 2.0 MAC in increasing order. This protocol was chosen because equilibration times are shorter with cumulative administration. Fifteen minutes was allowed at each enflurane level before the recording was commenced. Arterial hypertension associated with the decreasing of anesthetic concentration was prevented by an infusion of the adrenergic receptor blocker, labetalol (5 mg/ml, 2–10 ml/hr).
Spike sorting
The activities of individual units from the chosen channels were distinguished using the offline spike sorter software PowerNAP (OSTG, Inc., Fremont, CA). The software applies principal component analysis and cluster analysis methods to sort the spikes. In essence, principal component analysis defines the linearly independent factors in the spike data and transforms them to an ordered set of orthogonal basis vectors that capture the directions of largest variation. A scatterplot is then created using the first 2 principal components and various clustering methods (T-distribution, K-means, Manual) are applied to define the boundaries for the separation of clusters into their individual units. In the first step, T-distribution is applied to remove noise artifacts from data. K-means clustering is then applied to separate the data into a predefined number of clusters. We have allowed 2 or 3 clusters per channel. In the final step, remaining outliers are removed through manual clustering as necessary. Synchronous artifacts related to external noise were also removed using PowerNAP. This was based on the detection of spike events that occurred on at least half of units within an interval of 0.5 ms. Once the spikes were sorted and artifact-free, peristimulus raster plots were examined using the software NeuroExplorer (Nex Technologies, Littleton, MA). Units with very low overall activity were eliminated. Since the number of spikes on all channels decreased as the anesthetic concentration was increased, qualifying units were selected at the lowest anesthetic concentration only and this selection was applied for all other anesthetic levels.
Theoretical Modeling
We used a neuronal mass model similar to that previously described in detail by Wilson et al.17 The specific formulation of the equations and parameter values that we have used in the present paper are described in the Supplementary Materials (this will be online only) section. The advantage of this model is that its output (the mean soma potential) can be directly compared with experimentally measured local field potentials.25,26 In brief, the model consists of a set of partial differential equations that describe the time evolution of the mean soma potentials of a 2-dimensional homogeneous system of coupled inhibitory and excitatory neurons. This system represents an unlayered cortical sheet. In the model we are able to specify the magnitude and duration of excitatory and inhibitory synaptic potentials, the effects of reversal potentials, the form of the sigmoid relationship between probability of firing and soma potential and the effect of leak currents on the resting membrane potential. Therefore we can model a variety of synaptic and intrinsic influences on inhibitory and excitatory neuronal function. The population of neurons, over which we average, is termed a “macrocolumn.” It consists of ~0.5mm2 of cortex (about 50 000 neurons), corresponding roughly to the size of typical excitatory neuronal dendritic arborisation. Each macrocolumn also receives excitatory input from surrounding cortex and nonspecific white noise input from subcortical structures. We have slightly altered the parameters to approximate the smaller size (and more tightly packed) rat cortex, compared with the human cortex of our previous models. Based on previous published experimental work, we have constrained our possible range of parameter values. The effects of enflurane were quantitatively modeled based on experimental work studying the effects of volatile anesthetics on the hippocampus by Banks and Pearce18, and Nishikawa and MacIver.27 These studies are broadly in agreement and suggest that enflurane acts to: (i) cause a relative increase IPSP decay time-constant, from a starting value of 1.0 to a value in excess of 3.0 at >1MAC; and to (ii) initially increase the relative total area under the IPSP from 1.0 to ~2.0 at 1MAC. At higher concentrations (~2MAC) the blocking effect of enflurane on the chloride channel predominates and the IPSP area decreases slightly to a value of about 1.8 times the starting area. The blocking effect of isoflurane is much less than enflurane, and therefore, at 2MAC isoflurane, the relative area of the IPSP (a measure of the total charge/synaptic event) is about 3.5 times the starting value. Previously, the particular proconvulsant properties of enflurane and sevoflurane have been explained on the basis of their increased blockade of the peak IPSP amplitude alone.18,27 The problem with this explanation is that the total inhibitory charge engendered by the synaptic IPSPs was at least double that found, when there was no anesthetic drug present, i.e., seizures, were occurring when the cortex was in a state of marked net increased inhibition. Our explanation is a bit more subtle. We suggest that the peak amplitude is not in itself important in destabilizing the cortex, but rather the ratio of the amplitude to the decay time. In our simulation of neocortex we have used a conservative starting value of IPSP decay time ≌11.1ms, that is prolonged to ≌33ms by enflurane, and to ≌22ms by isoflurane. This might correspond to a MAC value of between 1.5 and 2.0 (see Discussion and Supplementary Materials). Enflurane clearly has many other molecular and neuronal effects, such as neuronal membrane hyperpolarization8,28–31, but inclusion of these effects into the model did not significantly change the model dynamics, and we have therefore only included a slight hyperpolarization of the resting membrane potential (0.5mV).
Fitting PEDs and burst suppression patterns
In previous versions of our model, we were able to generate single traveling waves, but we were unable to generate burst suppression patterns purely from alteration of IPSP amplitude and shape. In this respect, the model agreed with Lukatch et al's experimental observations. However, it must be noted that Lukatch et al studied burst suppression patterns with thiopental, propofol, and isoflurane, not enflurane. We have therefore used the information from this study and incorporated a slow, activity-mediated, modulation of EPSP gain (ρe) into the model (Supplementary Material provides further explanation of the mathematical basis of the model). If the firing-rate of the excitatory neurons was low (<10/s), ρe was set to increase 25% over a time course of 10 seconds. If the firing-rate was high (>10/s), the EPSP gain decreased to its starting value. The neurobiological reasoning behind the introduction of this addition to the theoretical model, is that: (i) increasing fluctuations of EPSPs just before PEDs have been observed in Lukatch et al’s experiments (Figure 5 in their paper), and (ii) the burst suppression pattern disappeared when glutamate blockers were added to their experimental preparation. There is increasing evidence of a general principle that hyperpolarization (and synaptic quiescence) tend to activate currents that increase neuronal excitability by a variety of known and unknown mechanisms. These effects may manifest as extreme sensitivity to sensory stimulus during the burst suppression EEG pattern and enlargement of primary cortical activation area.32–34 The simplest plausible mechanism is that synaptic inactivity markedly increases neuronal membrane resistance and increases the gap between the resting membrane potential and the EPSP reversal potential.35,36 However, there is a growing body of evidence which suggests that neuronal hyperpolarization and quiescence also increase excitability by activating hyperpolarization-induced depolarizing cation currents and calcium-induced burst firing.37–45
Figure 5.

Typical examples of computer simulated paroxysmal epileptiform discharges (left), and real paroxysmal epileptiform discharges (right, recorded at an enflurane concentration of 2MAC). The dashed line shows the time course of the excitatory postsynaptic potential (EPSP) amplitude in the simulations. For ease of display its units are relative to a baseline value of 1.0. For comparison, the insert into 5A is an example of a simulation that incorporates a transient calcium current which causes an after-discharge depolarization.
Whether these excitatory effects quantitatively exceed the enflurane and isoflurane-induced presynaptic reduction of EPSP amplitude is unknown. Conveniently, addition of this phenomenon easily and robustly causes a burst suppression pattern to appear in the “pseudoEEG” output of simulations run using the theoretical model.
Results
Experimental patterns of LFP and MUA
Figure 3 shows typical examples of changes in the LFP and MUA recorded with increasing enflurane concentrations. The mean(SD) rate of MUA decreased with increasing enflurane concentration (2.45(1.96)/s at 0.5MAC, 1.31(1.27)/s at 1.0MAC, 0.50(0.62)/s at 1.5MAC and 0.19(0.14)/s at 2.0MAC).
The relationship of the MUA to the LFP changed markedly when the cortex entered the burst suppression/PED pattern. At 0.5MAC enflurane, the MUA activity occurred across the whole range of the LFP. As shown in Figure 4, the probability distribution of the LFP at the time points at which the MUA occurred (solid line) is almost coincident with the overall LFP probability distribution (shaded area). At 1.0MAC enflurane, the probability distribution of the LFPs when the MUA occurred starts to become bimodal. At 2.0MAC enflurane, 52% of the area of the MUA probability distribution lies to the extreme right of the overall LFP distribution (>500 µV). This implies that the majority of the MUA events occur in that small percentage of time corresponding to the PED. It can be seen that the overall probability distribution of the LFP narrows as the enflurane concentration increases. This reflects the increasing periods of suppression in the LFP.
Figure 4.
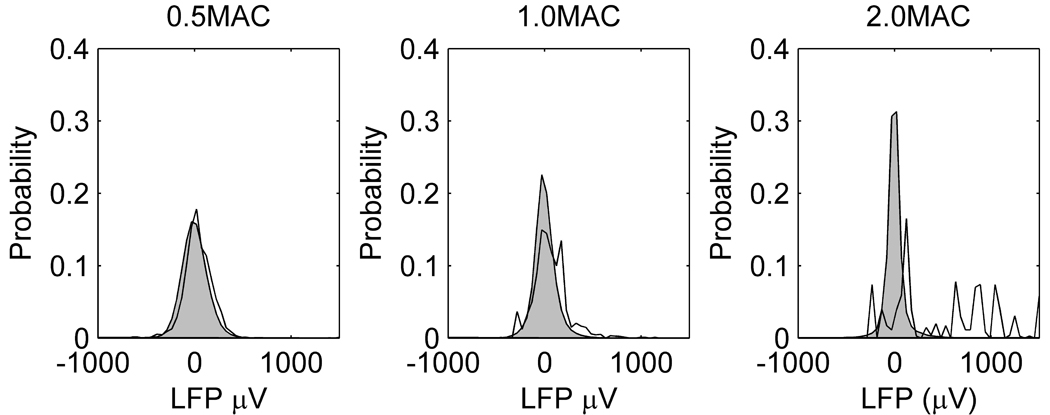
Probability distributions of the local field potential (LFP) at different concentrations of enflurane. The shaded grey area is the overall frequency distribution of LFP combined from all animals. The solid line is the frequency distribution of LFPs at the time points at which action potentials were detected.
Experimental PED morphology
As can be seen in Figure 3–Figure 5, the distinctive characteristics of experimentally observed PEDs are that: (i) They occur singly, or in small bursts, separated by suppression patterns lasting at least a few seconds. The right-hand column of Figure 5 shows examples of close-ups of experimentally recorded single (Figure 5B) or multiple (Figure 5D) PEDs. (ii) They show a sharp upstroke, often crowned with a burst of action potentials (lower graph in Figure 3). (iii) They show an initial fast downstroke followed by a slowing (or even small oscillations) and sometimes a small rebound hyperpolarization. (iv) The PED usually involves the whole section of the cortex that is being measured, but about 20% were more localized in space, spreading only over 3–7 electrodes (~1mm2). The peak depolarization among the different channels was achieved within 5 to 15ms of each other. This corresponds to effective conduction velocities across the cortex of between 0.1 to 0.6 m/s. Movies of typical changes in local field potential can be found in the Supplementary Material (Video 1 and 2). For all the PEDs the mean(SD) amplitude was 1414(1535) µV. The time taken for the spike to decrease to a half the maximum amplitude was 15(19)ms and the time to return to <50 µV from the baseline = 91(158) ms. There is a very wide variation in the time to return to the baseline, because (as can be seen in Figure 1, Figure 3, and Figure 5) some PEDs show a rebound hyperpolarization, whereas others show a lingering depolarization wave that is probably the result of a slowly inactivating calcium current.45 An example is seen in Figure 5D.
Model fitting
Spike and burst suppression fitting
The left-hand column of Figure 5 shows examples of the “pseudo-LFP” output from simulations of the model using parameters that are comparable to those of between 1.5 and 2MAC enflurane anesthesia (the IPSP decay time constant = 33ms and the total magnitude of the IPSP area = 1.8 relative to the starting value). Through the course of the simulation, the excitatory neurons of the model cortex were continuously stimulated by a low level of band-limited white noise (with statistically constant mean and variance). The dashed line indicates the time course of the changes in total area under the EPSP. It can be seen that subcortical noisy input causes small fluctuations in mean soma potential while the relative EPSP amplitude lies below about 1.3. Around this point the EPSP amplitude and soma potential fluctuations increase in amplitude and, depending on the random nature of the noise, sometimes result in small, localized PEDs that fail to recruit a significant area of the model cortex (Figure 5C). A further small increase in the EPSP amplitude precipitates the model cortex into a widespread PED. However, for the aforementioned reasons, this activity now causes the EPSP amplitude to decrease, the seizure oscillation is aborted, and the cycle repeats.
The time taken for the simulated PED to decrease to one-half the maximum amplitude = 14(11) ms, and the time to return to <50 µV from the baseline = 20(31) ms. Following Crunelli et al.45, if a low threshold transient, but inactivating, calcium current is incorporated into the model, a post-PED depolarizing wave is seen in the pseudo-LFP output from the simulations (Figure 5A insert for an example,).
Of note, the model shows increased magnitude of oscillation in the lead-up to the main PED as described (at a neuronal level) by Lukatch et al.15 This is reflected in the fact that the dominant eigenvalue of the equations are negative but close to zero (see below) and indicates a cortex that is displaying marginal stability. (It shows large amplitude responses to the same size input, i.e., the cortex is “jittery.”)
In the model cortex we are also able to input known (non-noisy) inputs and measure the size of the response of the soma potential, thus deriving an input-output function for the model. This was done in 500 simulation runs using the same “1.5-2MAC enflurane” parameter values. The input consisted of depolarizing 5 macrocolumns in the center of the model cortex to −55mV for a single (0.1ms) time step (repeated every 0.4s). The response was quantified by the total area under the mean soma potential depolarization for 0.38s after the stimulus (measured in a macrocolumn adjacent to the stimulated ones). Figure 6 shows how the size of this response increases as the area under the EPSP increases. For enflurane there are 3 possible dynamic states: (i) low firing, (ii) oscillatory, and (iii) high firing. There is almost no increase in the size of the response until EPSP=1.15, at which point there is a sudden jump in response corresponding to the induction of PEDs.
Figure 6.
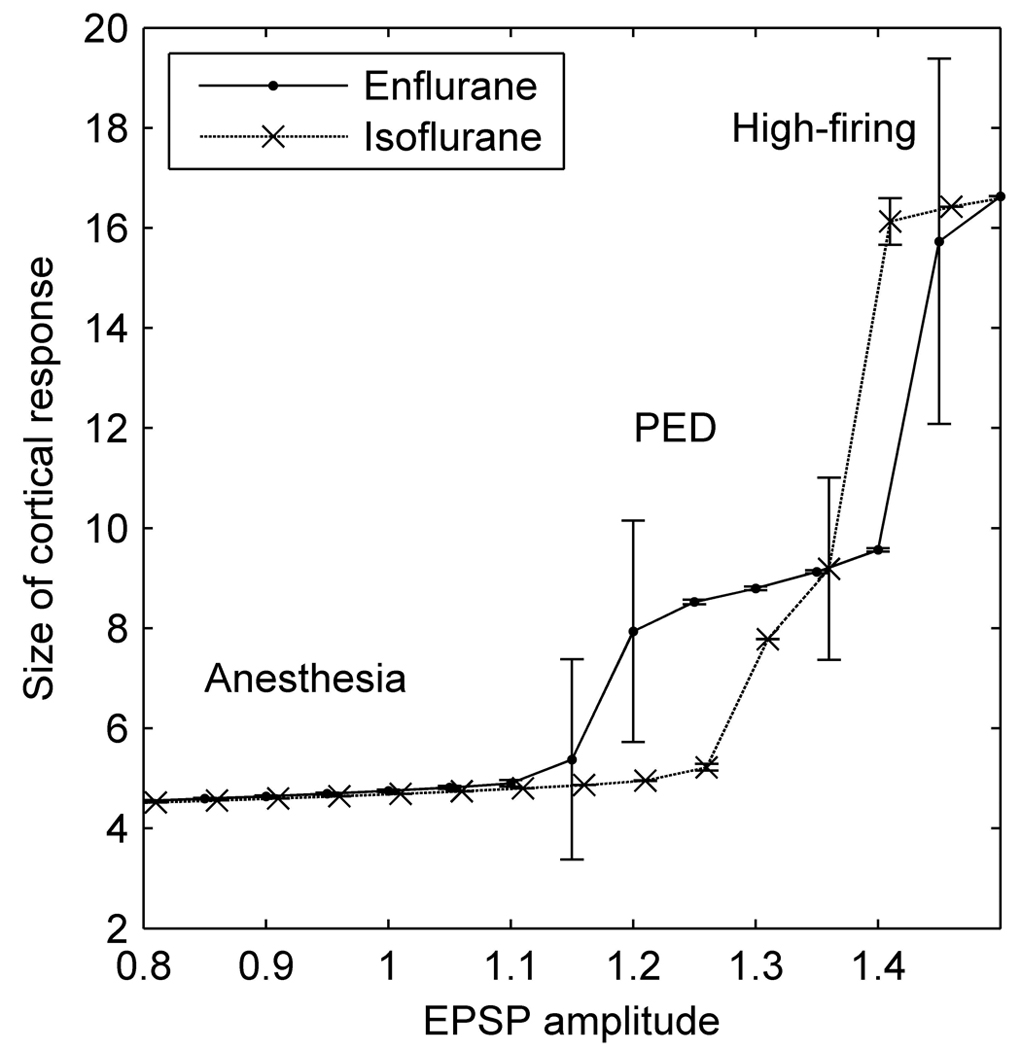
Size of modeled cortical response (measured as the mean area under depolarization (mV×ms) in response to standardized input pulses), as a function of excitatory postsynaptic potential (EPSP) amplitude for 2MAC enflurane (solid line) and 2MAC isoflurane (dashed line) parameter values. Errorbars are 1 standard deviation. “Anesthesia” denotes a low firing state when the model cortex is unreceptive to input, “PED” (paroxysmal epileptiform discharge) denotes a state where the modeled cortex responds with a transient jump to a high firing state that occurs over much of the whole modeled cortex. “High firing” denotes a state where the whole cortex jumps to a state of self-sustained continuous maximal firing, perhaps analogous to the tonic phase of a generalized seizure.
The second jump in response (at EPSP ~ 1.42) corresponds to the model cortex shifting to a stable state of continuous maximal firing, a state presumably analogous to the tonic phase of a generalized seizure. In contrast, if we simulate 1.5–2MAC isoflurane (using a shorter IPSP decay time constant =16ms), the cortex moves, with increasing EPSP area, directly from a quiescent low-firing state (the anesthetized state) to maximal firing, with almost no intermediate oscillatory PED state. This underscores the importance of inhibitory-loop delays as a mechanism of precipitating rhythmic activity in the cortex
Stability analysis of the theoretical cortex
The dynamic behavior of the system can be predicted via a linearized stability analysis. In this way the behavior of the simulations can be formally confirmed. The differential equations are linearized about the stationary state (found by setting all derivatives equal to zero). The eigenvalues of the resulting Jacobian matrix determine the stability of the system with respect to small perturbations. When the real part of all the eigenvalues is negative, the homogenous stationary state is stable, and the system will rapidly settle to its stationary value (termed a “fixed point attractor”). When the dominant eigenvalue is complex and its real part vanishes, the system will undergo a Hopf bifurcation, and the state parameter (the soma voltage in this case) will exhibit unstable oscillatory behavior. From the sudden onset of large amplitude oscillatory behavior, we assume that it is a subcritical Hopf bifurcation. The frequency of the oscillation is determined by the imaginary part of the eigenvalues, and lay typically between 1 and 8Hz. Because of the constraining effects of the reversal potentials that are incorporated into our model, the exponential instability takes the form of a large amplitude oscillation. We can therefore examine the dominant eigenvalue at different parameter values to determine if the model cortex will show settled activity or extreme (seizure-like) oscillatory activity, ranging from zero firing to supramaximal firing rates. Figure 7 is a diagram of the stability of the theoretical model, as estimated by the dominant eigenvalues, at different values of EPSP amplitude and subcortical input. The real parts of the eigenvalues are closer to zero (less negative) in the low-firing (anesthetized) state than in the high-firing state. There is an area between the 2 states in which the eigenvalues are positive, indicating the presence of unstable cortical activity; indeed, a regime in which linear methods of analysis may no longer be applicable. If parameter values consonant with those found at 2MAC isoflurane are used, there are no points at which the cortex is unstable (Figure 7 - lower). The numbers (#) show a plausible trajectory that might be followed during the course of a burst suppression cycle. Initially (position #1) the EPSP gain is small, and thus any excitatory input does not alter the LFP. Over the course of a few seconds, the hyperpolarization-induced increase in EPSP occurs, and the state of the cortex shifts to position #2. At this point, it can be seen that even small excitatory input can push the cortex into the area of instability (position #3, or even #4), and an abrupt depolarization to either an oscillation (#3) or a high firing state (#4) occurs. Because this activity reduces the EPSP amplitude, the PED activity is terminated and the cortex returns to the first position (#1), ready for the cycle to repeat itself. Because of the apparently random background activity occurring at various scales in the brain, these cycles are not completely regular. This anesthetic “burst suppression” cycle is slightly different to that which might be envisioned to occur during a typical grand mal seizure, which presumably reflects failure of normal neuronal homeostatic mechanisms that usually act to abort full seizures. In this case, the cortical dynamics at position #3 would correspond to the early “recruitment” phase of a tonic-clonic seizure. Failure of containment would allow the cortex to progress to the high-firing state (#4 – tonic phase), which then reverts after a few seconds to into a rhythmic state (#3 – hypersynchronous, clonic phase), until the unknown factors that terminate seizures cause the cortex to move back to position #1.
Figure 7.
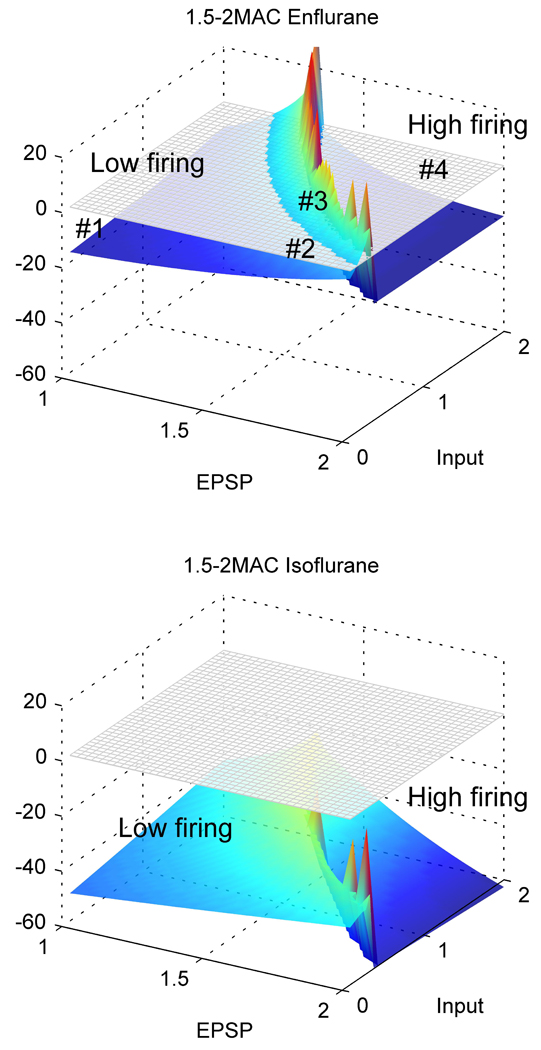
Diagram of stability of the cortical model, at different values of excitatory postsynaptic potential (EPSP) and subcortical excitation, for parameter values that are compatible with 1.5 to 2MAC enflurane (upper) or isoflurane (lower) anesthesia (see text). The grey grid is the level at which the real part of the dominant eigenvalue exceeds zero. Regions above this grid are unstable, and the linearization technique is no longer able to accurately characterize the dynamics of the system. The plot is included for display purposes only. Conversely, regions below the grid indicate a stable steady-state in cortical activity.
Discussion
The theoretical cortical model is sufficient to produce PED-like dynamics that are similar to those observed in experimentally obtained data. We are proposing that the experimental EEG observations can be explained by a 2-stage process involving coexistence of both inhibitory and excitatory neural mechanisms. The anesthetic-induced increased IPSP amplitude and prolongation has set the context in which subsequent slow fluctuations in the EPSP amplitude tip the dynamics of the cortex into an intermittent synchronous bursting mode of behavior (PEDs). This model provides a plausible explanation of how increased neuronal inhibition can sensitize the cortex so that even small amounts of excitation can precipitate PEDs. The relationship between PEDs and full-blown seizures is complex. In this study, we specifically allowed the EPSP amplitude to be modified by neuronal firing rate, which has the effect of making the PEDs self-limiting. If we removed the activity-dependent modulation of the EPSP, and allowed the EPSP amplitude to be maintained, the rhythmic activity would continue indefinitely in the model as described by Wilson et al,17 which is analogous to generalized clonic seizure activity. In practice, true seizures occur only very rarely with the use of enflurane. Our modeling would therefore suggest that even high concentrations of enflurane do not often obtund the normal neuronal homeostatic mechanisms that suppress EPSP amplitude in the presence of high firing states: namely alpha-amino-3-hydroxyl-5-methyl-4-isoxazole-propionate (AMPA) internalization, presynaptic calcium-dependent decrease on vesicle quanta and activity-induced increase in neuronal membrane conductance.
We observed a special case in which we altered synaptic gain (the EPSP amplitude), but the real clinical importance of the enflurane model is that it could be generalized to explain a variety of other seizure-related phenomena. For example, simulated closure of intrinsic neuronal potassium channels or opening of persistent sodium channels (causing slight but sustained depolarization of the resting membrane potential) will also precipitate PEDs and seizure-like oscillations, both in our model and other models.46,47 An important effect of acetylcholine and catecholamines is to close potassium channels.48,49 Cholinergic- and catecholaminergic-induced seizures are occasionally observed in comatose critically ill patients.50 Our framework could therefore explain this counterintuitive coexistence of coma (usually associated with suppression of neuronal activity) and seizures.
Problems with the explanation
The main problem with all efforts of modeling biological phenomena is that they provide a possible explanation of a phenomenon, but the question of whether it is a true explanation always depends on subsequent confirmatory evidence. In the words of Richard Feynmann: “Did the theory prove more than it set out to prove?” We see this paper as one step in this process. Initially we sought to model the transition from the awake state to the anesthetized state.4 Using the same model, we have then been able to describe many EEG features of slow wave sleep and anesthetic-induced seizures.17 Now using the same model, we are able to describe burst suppression/PED EEG patterns in terms of interactions between IPSP and EPSP synaptic dynamics. Deriving the correct parameter values for the model is not a trivial problem. As described in the Supplementary Material, our parameters are constrained by extensive searches of available neurophysiological and neuropharmacological literature. In particular there is substantial variation in values for IPSP amplitudes and decay times, depending on various experimental conditions, such as hippocampus versus neocortex and differing resting membrane potentials. We have therefore somewhat minimized the effects of enflurane and isoflurane on prolongation of the IPSP decay times in the model in order to be biased towards underestimation of the enflurane effects. Increased prolongation of the decay time to ~100ms exaggerates the sensitivity of the model to produce PEDs, but does not result in any qualitative change in the model output.
Benefits of using the theoretical model
The main advantage of our approach is that it is able to explain how the combination of moderate levels of excitation combined with increased inhibition could precipitate pre-seizure states. It also explains why these events are usually spatially synchronous. To do this we are able to apply the extensive formalism and language of dynamics. Although the language of dynamical theory is unfamiliar jargon to practicing clinicians, it allows us to very accurately determine oscillatory activity in terms of the eigenvalue structure of the system of equations. Does all this suggest any practical treatments? From the results in this paper, to stabilize the cortex we would need to:
Reduce excitation even more, involving both synaptic and intrinsic mechanisms.
Reduce inhibitory delay. This would also include reducing the variation in the time course of summation of inhibitory dendritic input onto the neuronal trigger area.
Augment the natural homeostatic mechanisms that limit seizure formation. A review into possible mechanisms which stop seizures has been recently done by Lado and Moshe.51
It is difficult to see how it would be possible to shorten the IPSP once it has been prolonged by the enflurane (apart from withdrawing the drug or giving bicuculline). Therefore, we would need to concentrate on treatments that might suppress the processes that modulate the EPSP amplitude or intrinsic neuronal depolarizing currents. These could be drugs that suppress the quiescence-induced EPSP sensitivity or more simply drugs that either directly block AMPA and N-methyl-D-aspartate channels (often associated with unacceptable psychotic side effects), or those that could block AMPA expression and phosphorylation. The N-methyl-D-aspartate blocking actions of ketamine have been used successfully to control refractory seizures.52,53 There are also other parameter alterations that deserve further investigation. Desynchronization of the bursting patterns of firing in inhibitory neurons, less variation in firing threshold within the excitatory neuron population, and decrease in inhibitory-inhibitory connectivity are all parameter alterations that decrease the propensity for seizure-like oscillations in the model.
We have shown that it is possible to replicate experimentally observed PEDs using a mean field model, which may in turn provide some insights into the causation and treatment of these phenomena.
Supplementary Material
Acknowledgments
Financial Support:
This work was supported by the grant R01 GM-56398 from the Institute of General Medical Sciences, National Institutes of Health, Bethesda, Maryland, USA and grant 0710-PG from the Neurological Foundation of New Zealand. The authors express their gratitude to James D. Wood, RLAT, in memoriam, for his help in performing the experiments. They thank Dr. Olga A Imas for her assistance in data analysis and to Dr. Wim Van Drongelen for reviewing the manuscript.
Footnotes
Disclaimers:
None
Conflict of Interest: Nil
Contributor Information
James W Sleigh, Department of Anaesthesiology, Waikato Clinical School, University of Auckland.
Jeannette A. Vizuete, Department of Anesthesiology, Medical College of Wisconsin, Milwaukee, WI.
Logan Voss, Department of Anaesthesiology, Waikato Clinical School, University of Auckland.
Alistair Steyn-Ross, Department of Engineering, University of Waikato.
Moira Steyn-Ross, Department of Engineering, University of Waikato.
Charles J Marcuccilli, Department of Neurology, Medical College of Wisconsin, Milwaukee, WI.
Anthony G. Hudetz, Department of Anesthesiology, Medical College of Wisconsin, Milwaukee, WI.
References
- 1.Bojak I, Liley DTJ. Modeling the effects of anesthesia on the electroencephalogram. Phys Rev E. 2005;71:041902. doi: 10.1103/PhysRevE.71.041902. [DOI] [PubMed] [Google Scholar]
- 2.Sleigh JW, Steyn-Ross DA, Steyn-Ross ML, Grant C, Ludbrook G. Cortical entropy changes with general anaesthesia: theory and experiment. Physiol Meas. 2004;25:921–934. doi: 10.1088/0967-3334/25/4/011. [DOI] [PubMed] [Google Scholar]
- 3.Steyn-Ross ML, Steyn-Ross DA, Sleigh JW. Modelling general anaesthesia as a first-order phase transition in the cortex. Prog Biophys Mol Biol. 2004;85:369–385. doi: 10.1016/j.pbiomolbio.2004.02.001. [DOI] [PubMed] [Google Scholar]
- 4.Steyn-Ross ML, Steyn-Ross DA, Sleigh JW, Liley DT. Theoretical electroencephalogram stationary spectrum for a white-noise-driven cortex: evidence for a general anesthetic-induced phase transition. Phys Rev E Stat Phys Plasmas Fluids Relat Interdiscip Topics. 1999;60:7299–7311. doi: 10.1103/physreve.60.7299. [DOI] [PubMed] [Google Scholar]
- 5.Grant IS. Delayed convulsions following enflurane anaesthesia. Anaesthesia. 1986;41:1024–1025. doi: 10.1111/j.1365-2044.1986.tb12746.x. [DOI] [PubMed] [Google Scholar]
- 6.Ito BM, Sato S, Kufta CV, Tran D. Effect of isoflurane and enflurane on the electrocorticogram of epileptic patients. Neurology. 1988;38:924–928. doi: 10.1212/wnl.38.6.924. [DOI] [PubMed] [Google Scholar]
- 7.Kurata J, Nakao S, Murakawa M, Adachi T, Shichino T, Mori K. The cerebral cortex origin of enflurane-induced generalized seizure in cats. Anesthesia & Analgesia. 1994;79:713–718. doi: 10.1213/00000539-199410000-00017. [DOI] [PubMed] [Google Scholar]
- 8.Antkowiak B, Kirschfeld K. Enflurane is a potent inhibitor of high conductance Ca(2+)-activated K+ channels of Chara australis. FEBS Lett. 1992;313:281–284. doi: 10.1016/0014-5793(92)81209-5. [DOI] [PubMed] [Google Scholar]
- 9.Drexler B, Jurd R, Rudolph U, Antkowiak B. Dual actions of enflurane on postsynaptic currents abolished by the gamma-aminobutyric acid type A receptor beta3(N265M) point mutation. Anesthesiology. 2006;105:297–304. doi: 10.1097/00000542-200608000-00012. [DOI] [PubMed] [Google Scholar]
- 10.Grasshoff C, Antkowiak B. Effects of isoflurane and enflurane on GABAA and glycine receptors contribute equally to depressant actions on spinal ventral horn neurones in rats. Br J Anaesth. 2006;97:687–694. doi: 10.1093/bja/ael239. [DOI] [PubMed] [Google Scholar]
- 11.Hentschke H, Schwarz C, Antkowiak B. Neocortex is the major target of sedative concentrations of volatile anaesthetics: strong depression of firing rates and increase of GABAA receptor-mediated inhibition. Eur J Neurosci. 2005;21:93–102. doi: 10.1111/j.1460-9568.2004.03843.x. [DOI] [PubMed] [Google Scholar]
- 12.Voss LJ, Ludbrook G, Grant C, Sleigh JW, Barnard JP. Cerebral cortical effects of desflurane in sheep: comparison with isoflurane, sevoflurane and enflurane. Acta Anaesthesiol Scand. 2006;50:313–319. doi: 10.1111/j.1399-6576.2006.00914.x. [DOI] [PubMed] [Google Scholar]
- 13.Yli-Hankala A, Vakkuri A, Sarkela M, Lindgren L, Korttila K, Jantti V. Epileptiform electroencephalogram during mask induction of anesthesia with sevoflurane. Anesthesiology. 1999;91:1596–1603. doi: 10.1097/00000542-199912000-00009. [DOI] [PubMed] [Google Scholar]
- 14.Jameson LC, Sloan TB. Using EEG to monitor anesthesia drug effects during surgery. J Clin Monit Comput. 2006;20:445–472. doi: 10.1007/s10877-006-9044-x. [DOI] [PubMed] [Google Scholar]
- 15.Lukatch HS, Kiddoo CE, Maciver MB. Anesthetic-induced burst suppression EEG activity requires glutamate-mediated excitatory synaptic transmission. Cereb Cortex. 2005;15:1322–1331. doi: 10.1093/cercor/bhi015. [DOI] [PubMed] [Google Scholar]
- 16.Liley DTJ, Bojak I. Understanding the transition to seizure by modeling the epileptiform activity of general anaesthetic agents. Journal of Clinical Neurophysiology. 2005;22:300–313. [PubMed] [Google Scholar]
- 17.Wilson MT, Sleigh JW, Steyn-Ross DA, Steyn-Ross ML. General anesthetic-induced seizures can be explained by a mean-field model of cortical dynamics. Anesthesiology. 2006;104:588–593. doi: 10.1097/00000542-200603000-00026. [DOI] [PubMed] [Google Scholar]
- 18.Banks MI, Pearce RA. Dual actions of volatile anesthetics on GABA(A) IPSCs: dissociation of blocking and prolonging effects. Anesthesiology. 1999;90:120–134. doi: 10.1097/00000542-199901000-00018. [DOI] [PubMed] [Google Scholar]
- 19.Molaee-Ardekani B, Senhadji L, Shamsollahi MB, Vosoughi-Vahdat B, Wodey E. Brain activity modeling in general anesthesia: enhancing local mean-field models using a slow adaptive firing rate. Phys Rev E Stat Nonlin Soft Matter Phys. 2007;76:041911. doi: 10.1103/PhysRevE.76.041911. [DOI] [PMC free article] [PubMed] [Google Scholar]
- 20.Steyn-Ross ML, Steyn-Ross DA, Sleigh JW, Wilcocks LC. Toward a theory of the general-anesthetic-induced phase transition of the cerebral cortex. I. A thermodynamics analogy. Phys Rev E Stat Nonlin Soft Matter Phys. 2001;64:011917. doi: 10.1103/PhysRevE.64.011917. [DOI] [PubMed] [Google Scholar]
- 21.Steyn-Ross ML, Steyn-Ross DA, Sleigh JW, Wilson MT, Wilcocks LC. Proposed mechanism for learning and memory erasure in a white-noise-driven sleeping cortex. Phys Rev E Stat Nonlin Soft Matter Phys. 2005;72:061910. doi: 10.1103/PhysRevE.72.061910. [DOI] [PubMed] [Google Scholar]
- 22.Wilson MT, Steyn-Ross DA, Sleigh JW, Steyn-Ross ML, Wilcocks LC, Gillies IP. The K-complex and slow oscillation in terms of a mean-field cortical model. J Comput Neurosci. 2006;21:243–257. doi: 10.1007/s10827-006-7948-6. [DOI] [PubMed] [Google Scholar]
- 23.Wilson MT, Steyn-Ross ML, Steyn-Ross DA, Sleigh JW. Predictions and simulations of cortical dynamics during natural sleep using a continuum approach. Phys Rev E Stat Nonlin Soft Matter Phys. 2005;72:051910. doi: 10.1103/PhysRevE.72.051910. [DOI] [PubMed] [Google Scholar]
- 24.Foster BL, Bojak I, Liley DT. Population based models of cortical drug response: insights from anaesthesia. Cogn Neurodyn. 2008;2:283–296. doi: 10.1007/s11571-008-9063-z. [DOI] [PMC free article] [PubMed] [Google Scholar]
- 25.Liley DT, Alexander DM, Wright JJ, Aldous MD. Alpha rhythm emerges from large-scale networks of realistically coupled multicompartmental model cortical neurons. Network. 1999;10:79–92. [PubMed] [Google Scholar]
- 26.Wright JJ, Wright DT. Simulation of electrocortical waves. Biol Cybern. 1995;72:347–356. doi: 10.1007/BF00202790. [DOI] [PubMed] [Google Scholar]
- 27.Nishikawa K, MacIver MB. Agent-selective effects of volatile anesthetics on GABAA receptor-mediated synaptic inhibition in hippocampal interneurons. Anesthesiology. 2001;94:340–347. doi: 10.1097/00000542-200102000-00025. [DOI] [PubMed] [Google Scholar]
- 28.Daniell LC. Effect of volatile general anesthetics and n-alcohols on glutamate-stimulated increases in calcium ion flux in hippocampal membrane vesicles. Pharmacology. 1995;50:154–161. doi: 10.1159/000139277. [DOI] [PubMed] [Google Scholar]
- 29.Lin LH, Chen LL, Harris RA. Enflurane inhibits NMDA, AMPA, and kainate-induced currents in Xenopus oocytes expressing mouse and human brain mRNA. Faseb J. 1993;7:479–485. doi: 10.1096/fasebj.7.5.7681790. [DOI] [PubMed] [Google Scholar]
- 30.MacIver MB, Kendig JJ. Enflurane-induced burst discharge of hippocampal CA1 neurones is blocked by the NMDA receptor antagonist APV. Br J Anaesth. 1989;63:296–305. doi: 10.1093/bja/63.3.296. [DOI] [PubMed] [Google Scholar]
- 31.Miao N, Frazer MJ, Lynch C. Volatile anesthetics depress Ca2+ transients and glutamate release in isolated cerebral synaptosomes. Anesthesiology. 1995;83:593–603. doi: 10.1097/00000542-199509000-00019. [DOI] [PubMed] [Google Scholar]
- 32.Erchova IA, Lebedev MA, Diamond ME. Somatosensory cortical neuronal population activity across states of anaesthesia. Eur J Neurosci. 2002;15:744–752. doi: 10.1046/j.0953-816x.2002.01898.x. [DOI] [PubMed] [Google Scholar]
- 33.Kroeger D, Amzica F. Hypersensitivity of the anesthesia-induced comatose brain. J Neurosci. 2007;27:10597–10607. doi: 10.1523/JNEUROSCI.3440-07.2007. [DOI] [PMC free article] [PubMed] [Google Scholar]
- 34.Hudetz AG, Imas OA. Burst activation of the cerebral cortex by flash stimuli during isoflurane anesthesia in rats. Anesthesiology. 2007;107:983–991. doi: 10.1097/01.anes.0000291471.80659.55. [DOI] [PubMed] [Google Scholar]
- 35.Destexhe A, Pare D. Impact of network activity on the integrative properties of neocortical pyramidal neurons in vivo. J Neurophysiol. 1999;81:1531–1547. doi: 10.1152/jn.1999.81.4.1531. [DOI] [PubMed] [Google Scholar]
- 36.Rudolph M, Pelletier JG, Pare D, Destexhe A. Characterization of synaptic conductances and integrative properties during electrically induced EEG-activated states in neocortical neurons in vivo. J Neurophysiol. 2005;94:2805–2821. doi: 10.1152/jn.01313.2004. [DOI] [PubMed] [Google Scholar]
- 37.Funahashi M, Mitoh Y, Matsuo R. The sensitivity of hyperpolarization-activated cation current (Ih) to propofol in rat area postrema neurons. Brain Res. 2004;1015:198–201. doi: 10.1016/j.brainres.2004.04.043. [DOI] [PubMed] [Google Scholar]
- 38.Tokimasa T, Sugiyama K, Akasu T, Muteki T. Volatile anaesthetics inhibit a cyclic AMP-dependent sodium-potassium current in cultured sensory neurones of bullfrog. Br J Pharmacol. 1990;101:190–192. doi: 10.1111/j.1476-5381.1990.tb12111.x. [DOI] [PMC free article] [PubMed] [Google Scholar]
- 39.Blethyn KL, Hughes SW, Toth TI, Cope DW, Crunelli V. Neuronal basis of the slow (<1 Hz) oscillation in neurons of the nucleus reticularis thalami in vitro. J Neurosci. 2006;26:2474–2486. doi: 10.1523/JNEUROSCI.3607-05.2006. [DOI] [PMC free article] [PubMed] [Google Scholar]
- 40.Code WE, White HS, Hertz L. The effect of midazolam on calcium signaling in astrocytes. Ann N Y Acad Sci. 1991;625:430–432. doi: 10.1111/j.1749-6632.1991.tb33871.x. [DOI] [PubMed] [Google Scholar]
- 41.Crunelli V, Cope DW, Hughes SW. Thalamic T-type Ca2+ channels and NREM sleep. Cell Calcium. 2006;40:175–190. doi: 10.1016/j.ceca.2006.04.022. [DOI] [PMC free article] [PubMed] [Google Scholar]
- 42.Gomez RS, Guatimosim C, Barbosa J, Jr, Massensini AR, Gomez MV, Prado MA. Halothane-induced intracellular calcium release in cholinergic cells. Brain Res. 2001;921:106–114. doi: 10.1016/s0006-8993(01)03098-0. [DOI] [PubMed] [Google Scholar]
- 43.Hughes SW, Cope DW, Blethyn KL, Crunelli V. Cellular mechanisms of the slow (<1 Hz) oscillation in thalamocortical neurons in vitro. Neuron. 2002;33:947–958. doi: 10.1016/s0896-6273(02)00623-2. [DOI] [PubMed] [Google Scholar]
- 44.Winograd M, Destexhe A, Sanchez-Vives MV. Hyperpolarization-activated graded persistent activity in the prefrontal cortex. Proc Natl Acad Sci U S A. 2008;105:7298–7303. doi: 10.1073/pnas.0800360105. [DOI] [PMC free article] [PubMed] [Google Scholar]
- 45.Crunelli V, Toth TI, Cope DW, Blethyn K, Hughes SW. The 'window' T-type calcium current in brain dynamics of different behavioural states. J Physiol. 2005;562:121–129. doi: 10.1113/jphysiol.2004.076273. [DOI] [PMC free article] [PubMed] [Google Scholar]
- 46.van Drongelen W, Lee HC, Koch H, Elsen F, Carroll MS, Hereld M, Stevens RL. Interaction between cellular voltage-sensitive conductance and network parameters in a model of neocortex can generate epileptiform bursting. Conf Proc IEEE Eng Med Biol Soc. 2004;6:4003–4005a. doi: 10.1109/IEMBS.2004.1404118. [DOI] [PubMed] [Google Scholar]
- 47.van Drongelen W, Lee HC, Stevens RL, Hereld M. Propagation of seizure-like activity in a model of neocortex. J Clin Neurophysiol. 2007;24:182–188. doi: 10.1097/WNP.0b013e318039b4de. [DOI] [PubMed] [Google Scholar]
- 48.Brudzynski SM, Cruickshank JW, McLachlan RS. Cholinergic mechanisms in generalized seizures: importance of the zona incerta. Can J Neurol Sci. 1995;22:116–120. doi: 10.1017/s031716710004018x. [DOI] [PubMed] [Google Scholar]
- 49.Cruickshank JW, Brudzynski SM, McLachlan RS. Involvement of M1 muscarinic receptors in the initiation of cholinergically induced epileptic seizures in the rat brain. Brain Res. 1994;643:125–129. doi: 10.1016/0006-8993(94)90017-5. [DOI] [PubMed] [Google Scholar]
- 50.Mirski MA, Varelas PN. Seizures and status epilepticus in the critically ill. Crit Care Clin. 2008;24:115–147. doi: 10.1016/j.ccc.2007.11.005. [DOI] [PubMed] [Google Scholar]
- 51.Lado FA, Moshe SL. How do seizures stop? Epilepsia. 2008;49:1651–1664. doi: 10.1111/j.1528-1167.2008.01669.x. [DOI] [PMC free article] [PubMed] [Google Scholar]
- 52.Borris DJ, Bertram EH, Kapur J. Ketamine controls prolonged status epilepticus. Epilepsy Res. 2000;42:117–122. doi: 10.1016/s0920-1211(00)00175-3. [DOI] [PMC free article] [PubMed] [Google Scholar]
- 53.Martin BS, Kapur JA. A combination of ketamine and diazepam synergistically controls refractory status epilepticus induced by cholinergic stimulation. Epilepsia. 2008;49:248–255. doi: 10.1111/j.1528-1167.2007.01384.x. [DOI] [PMC free article] [PubMed] [Google Scholar]
Associated Data
This section collects any data citations, data availability statements, or supplementary materials included in this article.