

Abstract
Local protein backbone dynamics of the camphor hydroxylase cytochrome P450cam (CYP101) depend upon the oxidation and ligation state of the heme iron. 1H,15N correlation nuclear magnetic resonance experiments were used to compare backbone dynamics of oxidized and reduced forms of this 414-residue metalloenzyme via hydrogen-deuterium exchange kinetics (H/D exchange) and 15N relaxation measurements, and these results are compared with previously published results obtained by H/D exchange mass spectrometry. In general, the reduced enzyme shows lower amplitude motions of secondary structural features than the oxidized enzyme on all of the time scales accessible to these experiments, and these differences are more pronounced in regions of the enzyme involved in substrate access to the active site (B′ helix, β3 and β5 sheets) and binding of putidaredoxin (C and L helices) the iron-sulfur protein that acts as effector and reductant of CYP101 in vivo. These results are interpreted in terms of local structural effects of changes in the heme oxidation state, and relevance of the observed effects to the enzyme mechanism is discussed.
Keywords: CYP101, putidaredoxin, NMR, HSQC, electron transfer, TROSY, protein dynamics, redox, heme protein, mass spectrometry
The dynamics of any protein, be it structural, regulatory or enzymatic, must be taken into consideration when trying to understand biological function. Metalloproteins provide excellent models for the role of protein dynamics in function, particularly if discrete changes in oxidation state or the identity of the bound metal play a role in modulating function. We and others have described cases in which the identity of a bound metal is critical in determining protein structure and dynamics, and provides a mechanism for selective metal sensing (1, 2). Alternatively, a tightly bound metal cofactor (such as a heme or Fe-S co-factor) can change oxidation state as either a sensor (3) or as an integral step in redox chemistry. We have observed redox-dependent modulation of the structure and dynamics of the Cys4Fe2S2 ferredoxin putidaredoxin (Pdx), which serves as the electron transfer partner and effector of cytochrome P450cam (CYP101) from Pseudomonas putida (4). CYP101 catalyzes the 5-exo hydroxylation of the monoterpene camphor by molecular oxygen in the first step of camphor catabolism by P. putida. The process requires two electrons, both of which are obtained by oxidation of NADH. NADH oxidation is catalyzed by the flavoprotein putidaredoxin reductase (PdR), and the electrons generated thereby transferred in sequential 1-electron steps from PdR to CYP101 by Pdx. While the first electron transfer to CYP101 is non-specific, and can be accomplished by any reductant of suitable potential, productive electron transfer in the second step is tightly coupled to an effector-driven conformational change that generates the enzymatically competent conformation of CYP101. We have recently described evidence for a specific X-Pro cis-trans isomerization in reduced CYP101 that is triggered by the binding of reduced Pdx (Pdxr), and which appears to account for the structural perturbations observed upon complex formation (5).
It is clear that redox-dependent modulation of Pdx-CYP101 interactions takes place: the interaction between oxidized Pdx (Pdxo) and oxidized CYP101 is weaker than that of the reduced forms of proteins, and does not produce the conformational changes observed in the reduced-reduced complex as detected by NMR spectroscopy (6). It has been shown that, besides constraining protein dynamics, reduction of Pdx results in population of fewer conformational substates than the oxidized protein (7). We proposed that this is the mechanism by which binding affinity of Pdx and CYP101 is modulated: If the subset of conformational states occupied by reduced Pdx (Pdxr) is the same as that selected upon binding to CYP101, much of the entropic cost of binding Pdx to CYP101 is “pre-paid”, with concomitant lowering of the binding free energy.
We expect this mechanism to be a two-way street: If CYP101 is more conformationally constrained after one-electron reduction, this reduces conformational entropy, making a specific interaction between Pdx and CYP101 energetically more favorable prior to the second electron transfer. Furthermore, “stiffening” CYP101 would provide the mechanical coupling necessary to transmit the forces exerted by Pdx at the proximal binding interface to the relatively remote distal regions of CYP101 where changes are observed in the enzymatically competent complex (5). We have found evidence from hydrogen-deuterium (H/D) exchange mass spectrometry that a number of regions of CYP101 that are involved in binding Pdx and/or modulating substrate access and orientation in the active site in have lower amplitude motions in the reduced form than in oxidized CYP101 on the timescale of 101–103 s (8). We now show that 15N relaxation as well as H/D exchange as monitored by NMR provides a complement to the mass spectrometric data, and the combination of methodologies allows local comparison of dynamic behavior between two oxidation states of CYP101 on several time scales.
Materials and Methods
Expression and purification of CYP101
Over-expression and purification of CYP101 was conducted as previously described (6, 21). The plasmid for C334A CYP101 was transformed into chemically competent E. coli NCM533 cells. The C334A mutant of CYP101 is identical spectroscopically and enzymatically to WT CYP101, but does not dimerize in solution at high concentrations (22). Transformants were selected on the basis of chloroamphenicol and kanamycin resistance. Colonies were grown in M9 medium containing trace metals (M9+) at 37 °C with the sole nitrogen source being 15NH4Cl (Cambridge Isotope Laboratories; Andover, MA). The cells were grown to an optical density (O.D600) of 1.0, at which point they were induced with 1 mM IPTG. Additionally, 5 mM camphor and 70 mg of porphyrin precursor δ-aminolevulinic acid were added per liter of medium to improve the yield of folded CYP101. The cells were incubated for an additional 12 h after induction at 37 °C. Cells were harvested by centrifugation at 2700 × g at 4 °C and were stored frozen at −80 °C until purification. Perdeuterated [U-15N] CYP101 was used for the 15N relaxation experiments and was obtained using the procedure described above with the exception that 0.3% d8- glycerol (Cambridge Isotope Laboratories; Andover, MA) was used as the carbon source in D2O-based M9 medium. 15NH4Cl and all inorganic salts were added from stock solutions in D2O.
Cell paste containing CYP101 was thawed and sonicated in 50 mM Tris-HCl pH 7.4, 1 mM camphor, 50 mM KCl (buffer A). The extract was cleared by centrifugation at 20000 × g for 20 min and the pellet discarded. Protamine sulfate (10 mg/g cell pellet) was slowly added to the supernatant, followed by centrifugation at 20000 × g for an additional 20 minutes and the pellet again discarded. Ammonium sulfate was slowly added to the supernatant to 70% saturation. The solution was then centrifuged at 20000 × g for 30 min. The resulting pellet was re-suspended and dialyzed against buffer A overnight at 4 °C. The protein solution was diluted into 100 ml L-buffer and loaded to a DEAE sepharose 20 mL fast flow column (Amersham Biosciences, Piscataway, NJ) followed by size exclusion on a P100 gravity column (Bio-Rad, Hercules, CA). The purity of the enzyme was determined by measuring absorption ratios A391/A280 on a Hitachi U-2000 UV/visible spectrophotometer. The fractions with absorption ratio greater than 1.4 were concentrated using an Amicon Ultra centrifugal filter concentrator (Millipore, Billerica, MA) until protein concentration exceeded 500 μM. The yield of the protein following purification was approximately 13 mg per liter of cell culture. The purified sample was frozen immediately in liquid nitrogen until needed.
Buffer Exchange Procedure
Ideally, NMR H/D-exchange experiments make use of lyophilized protein that is re-hydrated in deuterated buffer immediately prior to the experiment. We could not use this method because CYP101 is not stable to lyophilization. Instead, buffer exchange was accomplished using a spin column packed with P2 gel (Biorad) pre-equilibrated with a buffer containing 100 mM KCl, 50 mM d-Tris, 2 mM camphor pH 7.4. It is important to pre-equilibrate the column multiple times before exchange, as camphor has a tendency to adhere to the gel, and can easily be removed from the sample by the exchange process. Furthermore, for CYP-S-CO, the buffer was degassed and saturated with carbon monoxide gas prior to equilibrating the spin column. For reference samples, the buffer was protonated with 10% D2O for locking purposes. For the H/D-exchanged experiments, the buffer was made using 99.9% D2O (Cambridge Isotope Laboratories, Andover, MA). 800 μL of pre-equilibrated resin was washed 9 times with equal parts buffer and spun for 1 minute at 4000 × g. Subsequently, the protein was applied to the column and the column spun for 15 seconds at 4000 × g. The sample was recovered and sealed in an NMR shigemi tube (Shigemi Inc., Allison Park, PA). The protein concentration prior to exchange was 0.6 mM. The concentration was not measured after exchange into D2O buffer in order to begin the NMR experiments immediately.
Reduction of CYP101
The CYP101 sample was placed under a carbon monoxide atmosphere. Aliquots of sodium dithionite solution (0.25 M Na2S2O4, 1M Tris-HCl, pH 8.0) were added slowly to the sample until a clear red color was observed. The reduced camphor and CO-bound CYP101 (CYP-S-CO) was transferred to an anaerobic chamber where it was either placed directly into an NMR tube (reference spectrum) or exchanged into deuterated buffer as described above and placed in an NMR tube.
H/D exchange NMR measurements
H/D exchange for both CYP-S and CYP-S-CO was initiated by exchange into deuterated buffer as described above. Typically, there was an unavoidable 10 min delay between the start of exchange and return of the sample to the spectrometer. Shims were adjusted if required prior to starting the experimental series. 15N TROSY-HSQC experiments were acquired in series for 33 hours, with each experiment taking ~ 36 min to complete, yielding a total of 53 time points. Time points were assumed to reflect to sample condition at the end of each experiment. All experiments were recorded at 25 °C on a Bruker Avance 800 MHz spectrometer, equipped with z-gradient TCI cryoprobe, operating at 800.13 MHz (1H) and 81.076 MHz (15N). 15N HSQC TROSY experiments were conducted using a standard TROSY based pulse sequence (23). Sixteen transients were acquired per t1 point with 64 complex t1 increments using an acquisition time of 0.07 seconds. Data was processed using Topspin (Bruker Biospin, Billerica, MA).
H/D exchange calculations
Correlations in the 15N TROSY-HSQC corresponding to amide protons in the protein backbone were assigned as described in previous publications (5, 6, 21). As amide protons exchange with deuterons, the intensity of the corresponding correlation decreases. Integrated peak intensities of each correlation were measured using Topspin (Bruker Biospin). Integrated peak intensities were then fitted using the LinearRegression package of Mathematica 6.0 (Wolfram Research) to the linear expression:
| (1) |
where I is the integrated signal intensity, Io is the initial intensity of the resonance (obtained from the y-intercept of the fit), Rex is the exchange rate and t is time. The goodness of fit in most cases was improved by using the Mathematica routine MovingAverage, which replaces each original data point with the average of two adjacent points. This routine results in one less data point than in the original data set. For each peak, the goodness of fit was determined visually by plotting data points together with the fitted line (see Supplementary Material). In cases of relatively fast exchange, where back-exchange from increasing concentration of 1H in the buffer becomes a factor at later times, fits were visibly improved by only fitting the earlier time points. In all cases, the 68% confidence level was used to provide error estimates for the fits, and these levels are provided in the table in Supplementary Material.
Heteronuclear relaxation measurements
15N T1 and T2 values were determined using 2D TROSY-based pulse sequences (24). Relaxation experiments were run at 25 °C on a Bruker Avance 800 MHz spectrometer, equipped with z-gradient TCI cryoprobe, operating at 800.13 MHz (1H) and 81.076 MHz (15N). Spectral widths were 14367.8 Hz (1H) and 3243.5 Hz (15N). Two samples were employed: camphor-bound oxidized CYP101 (CYP-S) and reduced CO- and camphor-bound CYP101 (CYP-S-CO). Both samples were prepared in uniformly 15N and perdeuterated form, 0.5 mM in 90% H2O/10% D2O, pH 7.4, 50 mM d-Tris-HCl, 100 mM KCl, and 2 mM D-camphor. All spectra were processed and peak intensities were measured using NMRPipe.
T1 experiments were acquired with 32 scans per t1 point, 2.7 sec recycle delay and 102 (15N) × 2048 (1H) complex points in the CYP-S sample. The CYP-S-CO sample was run under identical conditions except 128 (15N) × 2048 (1H) complex points were acquired. For both samples, variable delays of 100, 200, 400, 800, 1600 and 2400 msec were run in an interleaved manner. Two of the time points (100 and 200 msec) were repeated to confirm reproducibility.
T2 experiments were acquired with 40 scans per t1 point, 1 sec recycle delay and 128 (15N) × 2048 (1H) complex points. Variable delays of 0, 16, 32, 48 and 64 msec were run in an interleaved manner. Two of the time points (0 and 16 msec) were repeated to confirm reproducibility.
Peak intensities from relaxation data sets were normalized and fitted with two parameters Io and k to Eq. (2) using the NonlinearRegress function of Mathematica 6.0 (Wolfram Research, Urbana, IL).
| (2) |
Error estimates for all relaxation data were taken from at the 68% confidence level as calculated with NonlinearRegress.
Results
Amide proton exchange provides a convenient means of monitoring local dynamics in folded proteins. To permit exchange, hydrogen bond donor-acceptor pairs involving amide protons must be separated > 5 Å for a significant fraction of time by local fluctuations (9). The degree to which H/D exchange occurs during a time course experiment provides a measure of the fraction of time such open states exist and hence the dynamic variations in local protein structure. H/D exchange can be measured either by NMR or mass spectrometry (MS). We recently described the use of tandem mass spectrometry (MS-MS) to detect redox-dependent differences in the extent of H/D exchange in peptide fragments of CYP101 (8). Figure 1 provides a summary of our observations from that work. In all cases where differences are seen, H/D exchange was faster in oxidized CYP-S than in the reduced CYP-S-CO. Significant differences are observed on the proximal face of the protein near the proposed Pdx binding site (6, 10, 11), including the C helix, the loop containing the heme iron axial ligand (Cys 357) and portions of the L helix. On the distal (active site) side of the heme, the greatest differences are seen in the B′ helix and portions of the I helix that forms one side of the active site. Particularly, the region of the I helix directly to the C-terminal side of the I helix “kink” (residues 254–256) show the largest measured difference between oxidized and reduced CYP101 of any region in the enzyme. The I helix “kink” (Gly 248-Thr 252) is a distortion of the helix that opens to provide a pocket for Fe-bound dioxygen in the reduced catalytic complex (12). Smaller redox-dependent differences in the extent of H/D exchange were also observed in the β-rich region (lower right hand portion of Fig. 1) including portions of the β3 and β5 strands. With the exception of portions of the N-terminal strand that show some redox-dependent H/D exchange behavior, affected distal regions of the enzyme are all in proximity to the active site or substrate access pathways.
Figure 1.
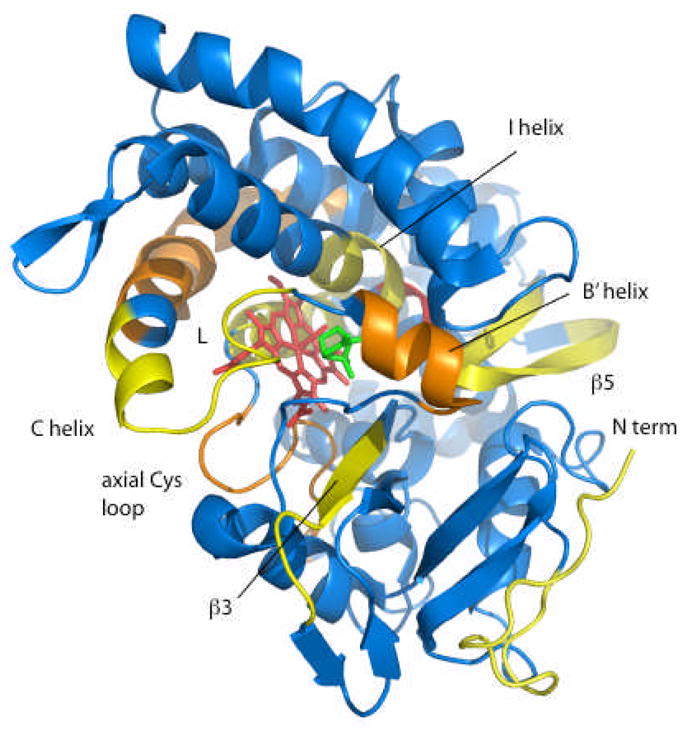
Differences in H/D exchange rates between oxidized CYP-S and reduced CYP-S-CO, determined by MS-MS as described previously, superimposed on the 3CPP structure of CYP101 (8, 25). In all cases, H/D exchange was faster in CYP-S than in CYP-S-CO. Color scheme shows blue (< 5% difference) through yellow to red indicating the largest redox sensitivity for H/D exchange. In yellow (5–10% difference in H/D exchange rates) are residues 3–24 (N-terminal), 98–110 (C helix), 247–251 (I helix “kink”) and residues 297–304 in the β3 sheet. In orange (11% to 20% difference) are residues 88–95 (B′ helix), 113–134 (C helix) and residues 343–370 (the loop containing the axial heme ligand Cys 357 and portions of the L helix). The greatest difference (31%) was observed for residues 254–256 in the I helix, shown in red. Figure generated using PyMOL (26).
H/D amide proton exchange measurements using NMR provide a complementary view of local redox-dependent dynamics in CYP101. These experiments are performed by measuring the loss of integral intensity of specific amide correlations in 2D 1H,15N TROSY-HSQC during the time course of exchange, and obtaining rate constants for exchange from this data. On one hand, these experiments have an advantage over MS-based H/D exchange in being able to localize fluctuations with single-residue resolution. However, a significant drawback of NMR in the measurement of redox-dependent H/D exchange in CYP101 is the inability to compare exchange rates within ~14.5 Å of the high spin Fe+3 (S = 5/2) in CYP-S due to paramagnetic broadening of 1H resonances and concomitant loss of 1H, 15N correlations in the CYP-S 1H,15N map (although such correlations are readily detected in the diamagnetic CYP-S-CO). Currently, we have assigned 290 (76%) of the 384 non-proline backbone NH groups in CYP-S-CO, and have recently published a comprehensive list of CYP-S-CO assignments (E. K. Asciutto et al., J. Mol. Biol. in press). Based on these assignments, sufficient comparisons can be made based on the NMR-based H/D exchange experiments to validate and extend the results obtained by MS.
Figure 2 shows the comparison between H/D exchange in oxidized CYP-S and reduced CYP-S-CO graphically on the CYP101 structure. Table I provides a list of all H/D exchange rates for CYP-S and CYP-S-CO that could be obtained from the NMR experiments. As with the MS data, oxidized CYP-S shows, with few exceptions, more rapid amide proton exchange than the corresponding residues in CYP-S-CO. Most of the secondary structures that show differences in H/D exchange by MS are not amenable to NMR measurements of H/D exchange due to paramagnetic broadening in CYP-S. However, where comparisons can be made (such as for the β5 sheet), similar results are obtained from MS and NMR.
Figure 2.

Differences in H/D exchange rates determined by NMR superimposed on the 3CPP structure of CYP101 (25). Residues are colored according the differences in kex listed in Table I. Cooler colors indicate increased local H/D exchange in the oxidized CYP-S relative to reduced CYP-S-CO, with blue showing the largest difference, and green indicating measurable differences beyond the 68% confidence level of data fits. Yellow indicates no difference in exchange rates within the confidence level, while orange indicates increased H/D exchange in CYP-S-CO relative to CYP-S. Figure generated using PyMOL (26).
Table I.
H/D exchange rates measured by NMR in CYP101. A blank entry under exchange rate (k) indicates that either the peak is missing in the oxidized form due to paramagnetic broadening or that no accurate integral measurements were possible due to spectral overlap. Error values are differences between reported values and 68% confidence level values as described in text. Residues highlighted in green show slower exchange in reduced than in oxidized, those in yellow are slower in the oxidized form.
| Residue | CYP-S (ox) H/D | CYP-S-CO (red) H/D | Sec. Struct. | ||
|---|---|---|---|---|---|
| k (s−1) | Error (+/−) | k (s−1) | Error (+/−) | ||
| 12 | 5.2E-06 | 2.0E-06 | fast | -- | |
| 17 | fast | -- | fast | -- | turn 1 |
| 18 | fast | -- | fast | -- | turn 1 |
| 23 | fast | -- | -- | -- | |
| 24 | fast | -- | 8.1E-07 | 4.3E-07 | |
| 25 | -- | -- | fast | -- | |
| 35 | 9.0E-07 | 4.1E-07 | 5.5E-07 | 2.2E-07 | turn 3 |
| 36 | -- | -- | fast | -- | turn 3 |
| 37 | fast | -- | fast | -- | A helix |
| 39 | 9.1E-06 | 9.1E-07 | 7.3E-06 | 4.2E-07 | A helix |
| 40 | 2.1E-05 | 1.3E-06 | 9.2E-06 | 5.3E-07 | A helix |
| 47 | 1.0E-05 | 5.9E-07 | 7.4E-06 | 6.1E-07 | turn 4 |
| 48 | fast | -- | -- | -- | turn 4 |
| 50 | fast | -- | 8.2E-05 | 1.2E-05 | turn 4 |
| 55 | slow | -- | slow | -- | β1 |
| 59 | 6.4E-06 | 3.2E-06 | fast | -- | turn 5 |
| 60 | fast | -- | fast | -- | turn 5 |
| 61 | 1.3E-06 | 9.0E-08 | 8.1E-07 | 2.3E-07 | β1 |
| 62 | slow | -- | slow | -- | β1 |
| 64 | 9.7E-07 | 5.2E-07 | 1.6E-06 | 5.3E-07 | β1 |
| 65 | fast | -- | 1.3E-06 | 8.8E-07 | β1 |
| 67 | slow | -- | slow | -- | B helix |
| 68 | fast | -- | fast | B helix | |
| 70 | -- | -- | 9.7E-06 | 8.2E-07 | B helix |
| 77 | 7.2E-06 | 4.7E-07 | 6.6E-06 | 5.7E-07 | B helix |
| 82 | 1.9E-06 | 1.2E-06 | slow | -- | |
| 83 | -- | -- | fast | -- | |
| 85 | 1.8E-05 | 1.6E-06 | 5.1E-06 | 4.1E-07 | |
| 87 | -- | -- | fast | -- | |
| 88 | -- | -- | fast | -- | |
| 90 | fast | -- | fast | -- | B′ helix |
| 91 | fast | -- | fast | -- | B′ helix |
| 92 | -- | -- | 2.0E-06 | 8.3E-07 | B′ helix |
| 93 | fast | -- | fast | -- | B′ helix |
| 94 | -- | -- | fast | -- | B′ helix |
| 96 | 1.9E-06 | 6.3E-07 | -- | -- | B′ helix |
| 98 | fast | -- | fast | 1.4E-06 | turn 6 |
| 99 | -- | -- | fast | 1.8E-06 | turn 6 |
| 107 | fast | -- | fast | 1.5E-06 | turn 7 |
| 118 | -- | -- | 2.8E-06 | 9.4E-07 | C helix |
| 119 | -- | -- | 5.2E-06 | 4.3E-07 | C helix |
| 120 | -- | -- | 6.2E-05 | 1.7E-05 | C helix |
| 124 | 1.8E-06 | 1.2E-06 | -- | -- | C helix |
| 143 | 3.6E-06 | 4.9E-07 | 10.0E-06 | 1.9E-06 | D helix |
| 145 | fast | -- | fast | -- | β5 |
| 146 | 2.5E-05 | 3.7E-06 | 2.1E-05 | 2.0E-06 | β5 |
| 147 | 2.7E-06 | 4.1E-07 | 2.1E-06 | 2.2E-07 | β5 |
| 148 | 3.0E-06 | 4.0E-07 | 2.0E-06 | 2.9E-07 | β5 |
| 149 | 2.1E-05 | 6.3E-06 | 6.1E-06 | 6.6E-07 | β5 |
| 150 | 9.7E-06 | 7.6E-07 | 4.6E-06 | 4.8E-07 | β5 |
| 151 | fast | -- | fast | -- | E helix |
| 152 | 1.1E-05 | 4.5E-06 | fast | -- | E helix |
| 154 | 6.7E-06 | 7.5E-07 | 5.1E-06 | 8.6E-07 | E helix |
| 168 | 4.9E-05 | 5.8E-06 | 2.5E-05 | 6.7E-06 | |
| 171 | fast | -- | -- | -- | turn 8 |
| 172 | fast | -- | fast | -- | turn 8 |
| 173 | fast | -- | fast | -- | F helix |
| 185 | 1.7E-05 | 1.2E-06 | 1.4E-05 | 1.0E-06 | |
| 186 | 4.4E-06 | 7.6E-07 | 4.8E-06 | 4.9E-07 | |
| 188 | -- | -- | fast | -- | |
| 189 | fast | -- | fast | -- | |
| 192 | 1.3E-06 | 4.3E-07 | fast | -- | G helix |
| 195 | 1.8E-05 | 3.7E-06 | -- | -- | G helix |
| 196 | -- | -- | 7.2E-06 | 6.3E-07 | G helix |
| 199 | 1.9E-06 | 2.6E-07 | -- | -- | G helix |
| 200 | fast | -- | -- | -- | G helix |
| 207 | 1.1E-05 | 8.2E-07 | 1.1E-05 | 8.9E-07 | G helix |
| 209 | 2.5E-05 | 4.7E-06 | -- | -- | G helix |
| 216 | fast | -- | fast | -- | H helix |
| 217 | fast | -- | slow | -- | H helix |
| 225 | -- | -- | 6.0E-06 | 4.3E-07 | H helix |
| 226 | fast | -- | slow | -- | H helix |
| 228 | fast | -- | fast | -- | β2 |
| 229 | fast | -- | fast | -- | β2 |
| 230 | fast | -- | fast | -- | β2 |
| 233 | 2.8E-06 | 4.8E-07 | 2.5E-06 | 4.0E-07 | β2 |
| 234 | 4.5E-05 | 4.1E-06 | 5.7E-06 | 7.7E-07 | I helix |
| 235 | fast | -- | fast | -- | I helix |
| 245 | 3.0E-06 | 7.6E-07 | -- | -- | I helix |
| 248 | -- | -- | fast | -- | I helix |
| 249 | -- | -- | fast | -- | I helix |
| 252 | -- | -- | fast | -- | I helix |
| 253 | -- | -- | fast | -- | I helix |
| 254 | -- | -- | 1.8E-06 | 7.1E-07 | I helix |
| 266 | 7.0E-07 | 4.1E-07 | -- | -- | I helix |
| 267 | 4.9E-05 | 8.5E-06 | 2.6E-05 | 2.5E-06 | I helix |
| 270 | 7.6E-07 | 4.1E-07 | slow | -- | J helix |
| 271 | 3.0E-06 | 6.6E-07 | -- | -- | J helix |
| 274 | 2.2E-06 | 3.4E-07 | 2.2E-06 | 2.3E-07 | J helix |
| 279 | fast | -- | fast | -- | turn 10 |
| 283 | 4.2E-06 | 9.6E-07 | -- | -- | K helix |
| 296 | -- | -- | fast | -- | β3 |
| 298 | -- | -- | fast | -- | β3 |
| 300 | 3.0E-06 | 8.4E-07 | fast | -- | β3 |
| 302 | -- | -- | 1.2E-06 | 1.9E-07 | |
| 304 | 8.5E-05 | 1.5E-05 | -- | -- | β4 |
| 306 | 8.9E-08 | 1.5E-06 | fast | -- | β4 |
| 307 | fast | -- | fast | -- | turn 11 |
| 308 | fast | -- | fast | -- | turn 11 |
| 309 | fast | -- | fast | -- | turn 11 |
| 310 | 3.3E-06 | 4.7E-07 | 2.8E-06 | 2.5E-07 | turn 11 |
| 312 | slow | -- | slow | -- | β4 |
| 313 | 1.8E-06 | 4.7E-07 | -- | -- | β4 |
| 314 | -- | -- | 1.7E-06 | 3.0E-07 | β4 |
| 315 | fast | -- | fast | -- | β4 |
| 326 | -- | -- | fast | -- | |
| 329 | fast | -- | fast | -- | turn 12 |
| 330 | -- | -- | -- | -- | turn 12 |
| 333 | 3.1E-06 | 1.1E-06 | fast | -- | turn 13 |
| 334 | fast | -- | fast | -- | turn 13 |
| 338 | fast | -- | -- | -- | |
| 339 | 6.1E-06 | 1.1E-06 | 3.1E-06 | 6.5E-07 | |
| 340 | fast | -- | fast | -- | |
| 342 | fast | -- | fast | -- | |
| 348 | -- | -- | fast | -- | turn 14 |
| 349 | -- | -- | fast | -- | turn 14 |
| 351 | -- | -- | fast | -- | turn 14 |
| 354 | -- | -- | fast | -- | turn 15 |
| 356 | -- | -- | fast | -- | turn 15 |
| 357 | -- | -- | 5.3E-06 | 9.0E-07 | |
| 358 | -- | -- | fast | -- | |
| 369 | slow | -- | -- | -- | L helix |
| 376 | -- | -- | 5.6E-06 | 1.0E-06 | L helix |
| 384 | 2.2E-05 | 4.5E-06 | 2.6E-05 | 2.5E-06 | turn 16 |
| 386 | 6.5E-07 | 4.4E-07 | fast | -- | turn 16 |
| 387 | 4.4E-06 | 5.5E-07 | fast | -- | turn 16 |
| 388 | 5.7E-06 | 1.0E-06 | -- | -- | β5 |
| 390 | 2.4E-06 | 1.5E-06 | fast | -- | β5 |
| 391 | fast | -- | fast | -- | β5 |
| 392 | 1.8E-06 | 2.9E-07 | -- | -- | β5 |
| 394 | -- | -- | fast | -- | β5 |
| 396 | -- | -- | fast | -- | β5 |
| 398 | 3.3E-07 | 4.3E-07 | fast | -- | β5 |
| 400 | -- | -- | fast | -- | β5 |
| 401 | 8.6E-06 | 7.5E-07 | -- | -- | β5 |
| 410 | fast | -- | fast | -- | |
| 411 | -- | -- | 9.4E-07 | 1.1E-07 | |
| 412 | -- | -- | fast | -- | |
| 413 | -- | -- | fast | -- | |
| 414 | fast | -- | fast | -- | |
The largest measured decrease in H/D exchange upon reduction is observed for Thr 234, at the N-terminal of the I helix. Other significant H/D exchange rate decreases upon reduction occur at Glu 40 (in the first turn of the A helix), Cys 85 (B-B′ loop) Arg 90 (first residue in the B′ helix) Asn 149 (loop between a β5 strand and helix E), Gly 168 (loop between the E and F helices) and Ser 267 and His 270 at the junction between the I and J helices.
There are some local reversals of the trend for more rapid H/D exchange in the oxidized CYP-S than in CYP-S-CO. For example, the amides of residues 384–390, which include a β-turn between two strands of the β5 sheet, show an increase in H/D exchange rate upon reduction. This is the only cluster of adjacent residues for which this trend can be confirmed, but increases in H/D exchange rates upon reduction are also seen for Arg 143, near the C-terminal of the D helix, Asp 173 (at the N-terminal end of the F helix), Ile 300 (β3 sheet) and Ala 333 (in irregular turn structure connecting the substrate binding site to the β meander). In no case, however, is the difference between CYP-S and CYP-S-CO as pronounced as the most prominent examples of the normal trend.
15N relaxation measurements
H/D exchange, whether measured by MS or NMR, is sensitive to large-amplitude protein motions with low frequencies (10−2 to 10−7s−1). Our reported MS-MS exchange experiments covered a time scale from 10 to 1000 s, corresponding to exchange rate constants of 10−2 to 10−3 s−1. Reliable rate constants could only be obtained from the current NMR data over a fairly narrow range (~10−5 to 10−7 s−1). Conformational sampling faster than 10−5 s−1 leads to complete exchange within the first time point of NMR H/D exchange experiments. While H/D exchange rates often follow the same trends as local dynamics on shorter time scales (4, 7, 13, 14), this is not a given. For this reason, we measured 15N relaxation times (T1 and T2) in an effort to correlate the redox dependence of higher frequency motions in CYP101 with what was observed by H/D exchange. 15N relaxation reflects dynamics on a ps-ns time scale, and the ratio of 15N T1/T2 can provide qualitative information on motions on other time scales. If the ratio of T1/T2 is more than one standard deviation below the mean, large-scale motions on the time scale of hundreds of ps are expected, while deviations above the mean indicate conformational sampling on the ms time scale leading to exchange broadening (15).
As can be seen from Figures 3, 4 and 5, differences in T2 and T1/T2 ratios between CYP-S and CYP-S-CO indicate that the same dynamic trends are evident at shorter times scales as observed by H/D exchange, that is, increased conformational sampling in the oxidized enzyme relative to the reduced CYP-S-CO on the ms time scale. The dynamic differences between oxidized and reduced enzyme detected by 15N relaxation are for the most part found in a cluster on the distal side of the enzyme (Fig. 5). The B′ helix and β5 sheet are most uniformly affected (Fig. 3), but Ile 300 in the β3 sheet shows the largest measured difference in T1/T2 ratio. Two residues, Glu 209 (G helix) and Val 310 (β4 sheet) show the reverse effect, with T1/T2 decreasing in the oxidized enzyme. We note that two of the residues in which H/D exchange is faster in CYP-S-CO than in CYP-S are also located in or adjacent to the β4 sheet.
Figure 3.

Differences in 15N T1/T2 ratios between oxidized (CYP-S) and reduced (CY-S-CO) CYP101 as a function of sequence. Secondary structural features are indicated by colored graphics, labeled using the scheme of Ragg and Poulos (25). Differences are superimposed via color shading on the CYP101 structure in Figure 5. Orange bars indicate regions where significant differences in H/D exchange are detected by mass spectrometry. Error estimates for individual 15N relaxation measurements can be found in Supplementary Material.
Figure 4.

Difference in 15N T2 values between oxidized (CYP-S) and reduced (CY-S-CO) CYP101. Secondary structural features are indicated by colored graphics, labeled using the scheme of Ragg and Poulos (25). Error bars are shown for individual T1 and T2 measurements in Supplementary Material.
Figure 5.

Differences in ms timescale dynamics as reflected by 15N T1/T2 ratios superimposed on the 3CPP structure of CYP101 (25). Cooler colors indicate increased local dynamics in the oxidized CYP-S relative to reduced CYP-S-CO, with blue showing the greatest difference, and green the least. Yellow indicates increased dynamics in CYP-S-CO relative to CYP-S (see text). Figure generated using PyMOL (26).
A concern arising from the use of 15N relaxation methods to examine dynamics in CYP101 is the dramatically different electronic environment of the heme between the two forms of the enzyme. CYP-S-CO is diamagnetic (Fe+2, S=0), and electron-nuclear spin interactions do not affect nuclear spin relaxation. The oxidized CYP-S is almost completely high-spin (Fe+3, S=5/2). This results in electron-nuclear spin interactions that broaden 1H resonances beyond detectability within ~14.5 Å of the heme iron. However, as 15N is ~100-fold less susceptible than 1H to paramagnetic relaxation effects as a function of distance from the paramagnetic center, it is reasonable to assume that if the 1H of an NH pair is detectable in CYP-S, the relaxation behavior of the attached 15N will not be significantly affected by paramagnetism. This assumption is supported by the lack of any discernable relationship between measured 15N T1 and T2 values (see Supplementary Material) and the distance between the heme iron and corresponding 15N spin in CYP-S.
Discussion
The results of H/D exchange and 15N relaxation measurements described here combined with previously published MS data provide a consistent and complementary picture of redox-dependent dynamics in CYP101. For example, all three types of experiments indicate that the dynamics of the β5 sheet, which is involved in active site access and substrate orientation in the active site, is sensitive to oxidation state on all accessible time scales. The B′ helix, which transmits conformational changes upon binding of Pdx to CYP-S-CO at the C helix to the active site and other distal positions, is seen to change dynamics from both the relaxation measurements and MS H/D exchange.
While reduced CYP-S-CO shows lower amplitude motions on all accessible time scales than oxidized CYP-S in most cases, there are interesting exceptions to this trend. In the NMR-based H/D exchange experiments, most residues in the β5 sheet show decreased exchange in CYP-S-CO relative to CYP-S. However, one cluster of residues, Ala 384-Gln 390, which includes a turn linking two strands of the β5 sheet, shows increased H/D exchange rates in the reduced CYP-S-CO relative to the oxidized form, suggesting that increased amplitude motion within the β5 sheet in CYP-S is at least partially compensated by decreasing the amplitude of such motions near the edges of the sheet. We have observed a similar phenomenon when we compared H/D exchange in oxidized and reduced Pdx (4).
Motional differences on the ms timescale are detected by differences in the ratio of 15N T1/T2 as a function of oxidation state. From Fig. 5, the largest effects of this type are seen in the distal cluster of secondary structural features including the B′ helix and portions of the β3 and β5 sheets, with smaller effects in the I helix and β1 sheet. This clustering suggests that at least some of the motions responsible for the observed effects are coordinated not only within a given secondary structure, but also between secondary structural features. Furthermore, since some of these same features must be distorted or displaced in order to open the substrate access channel (16, 17), these results suggest that the active site is more accessible on the ms timescale in the oxidized CYP-S than in CYP-S-CO.
That CPY-S is generally more dynamic than reduced CYP-S-CO is, in itself, not surprising. With few exceptions (18), this trend has been observed for redox-active metalloproteins regardless of the type of metal center involved (4, 19, 20). What is intriguing, however, is the localization of the dynamic differences in CYP101. The largest differences in dynamics, as determined by H/D exchange, are located on the proximal face in the proposed Pdx binding site and, on the distal side, in secondary structural features adjacent to the active site and regions implicated in gating substrate access to the active site. In particular, the B′ helix is less dynamic in CYP-S-CO than in CYP-S both in the MS H/D exchange and 15N relaxation experiments. The B′ helix provides a critical mechanical link between the proximal Pdx binding site (formed in part by the C helix, helix L and the axial Cys 357 loop) and the distal regions most affected by Pdx binding, including the I helix and the B-B′ loop. The B′ helix begins at Pro 89, and is one of the secondary structural features implicated in gating substrate access to the CYP101 active site. We recently proposed that isomerization of the Ile 88-Pro 89 amide bond is the critical “switch” driven by binding of Pdx that reorients the substrate camphor in the active site appropriately for the observed chemistry (5). Given that the spectral changes associated with the isomerization are not observed upon binding of Pdx to oxidized CYP-S, it is clear that reduction of CYP101 is required for the isomerization to occur.
Due to paramagnetic broadening of resonances near the heme in CYP-S, it is not possible from the current data to propose a mechanism for the observed relationship between protein dynamics and oxidation state in CYP101. What insight we have comes from the related case of redox-dependent dynamics in Pdx. We found that mutation of a histidine residue (His 49) structurally and sequentially adjacent to the redox-active metal cluster essentially abolished the sensitivity of protein dynamics to metal center oxidation state in Pdx, and we proposed that His 49 acts as a mechanical linkage, transmitting redox-induced conformational changes in the polypeptide surrounding the metal center to other regions of the protein via hydrogen bonding interactions (14). A similar case could be made in the case of CYP101 for His 355, which forms a salt bridge with a heme propionate via the Nδ imidazole nitrogen. The Nεof His 355 is within hydrogen bonding or salt bridge distance of residues in the B-B′ loop (Ser 83 Oγ), the B′-C loop (Met 103 carbonyl oxygen) and the C helix (Glu 108 carboxylate). All of these secondary structural features exhibit redox-dependent dynamics in the experiments described here or previously by MS-MS, so it is possible that changes in the heme iron oxidation state result in changes in charge distribution in this network of salt-bridges and hydrogen bonds, changes which are then transmitted to other affected areas of the enzyme. However, mutations of His 355 to Phe, Asp and Asn resulted in destabilization of the enzyme, so the importance of this residue to redox-dependent dynamics of CYP101 could not be confirmed (5).
Supplementary Material
ABBREVIATIONS
- CYP101
cytochrome P450cam
- CYP-S
oxidized camphor-bound CYP101
- CYP-S-CO
reduced camphor- and carbonmonoxy-bound CYP101
- IPTG
isopropyl β-D-thiogalactoside
- NMR
nuclear magnetic resonance
- HSQC
heteronuclear single-quantum correlation
- M9
minimal growth medium
- OD600
optical density at 600 nm
- PdR
putidaredoxin reductase
- Pdx
putidaredoxin
- Pdxr
reduced putidaredoxin
- TROSY
transverse relaxation optimized spectroscopy
Footnotes
This work was supported in part by a grant from U.S. Public Health Service (R01-GM44191, TCP). AKS acknowledges support by PHS post-doctoral fellowship F32-GM083371.
Supplementary material available: Table of calculated 15N T1 and T2 values, examples of fits of H/D exchange data, 15N T1 and T2 values with error bars as a function of sequence, annotated TROSY-HSQC spectrum for CYP-S-CO and overlay of TROSY-HSQC spectra of CYP-S (oxidized) and CYP-S-CO (reduced). Supplemental materials may be accessed free of charge online at http://pubs.acs.org.
References
- 1.Ju TT, Goldsmith RB, Chai SC, Maroney MJ, Pochapsky SS, Pochapsky TC. One protein, two enzymes revisited: A structural entropy switch interconverts the two isoforms of acireductone dioxygenase. J Mol Biol. 2006;363:523–534. doi: 10.1016/j.jmb.2006.08.060. [DOI] [PMC free article] [PubMed] [Google Scholar]
- 2.Leitch S, Bradley MJ, Rowe JL, Chivers PT, Maroney MJ. Nickel-specific response in the transcriptional regulator, Escherichia coli NikR. J Am Chem Soc. 2007;129:5085–5095. doi: 10.1021/ja068505y. [DOI] [PubMed] [Google Scholar]
- 3.Hidalgo E, Demple B. An iron-sulfur center essential for transcriptional activation by the redox-sensing SoxR protein. EMBO J. 1994;13:138–146. doi: 10.1002/j.1460-2075.1994.tb06243.x. [DOI] [PMC free article] [PubMed] [Google Scholar]
- 4.Lyons TA, Ratnaswamy G, Pochapsky TC. Redox-dependent dynamics of putidaredoxin characterized by amide proton exchange. Prot Sci. 1996;5:627–639. doi: 10.1002/pro.5560050407. [DOI] [PMC free article] [PubMed] [Google Scholar]
- 5.OuYang B, Pochapsky SS, Dang M, Pochapsky TC. A functional proline switch in cytochrome P450(cam) Structure. 2008;16:916–923. doi: 10.1016/j.str.2008.03.011. [DOI] [PMC free article] [PubMed] [Google Scholar]
- 6.Pochapsky SS, Pochapsky TC, Wei JW. A model for effector activity in a highly specific biological electron transfer complex: The cytochrome P450(cam)-putidaredoxin couple. Biochemistry. 2003;42:5649–5656. doi: 10.1021/bi034263s. [DOI] [PubMed] [Google Scholar]
- 7.Pochapsky TC, Kostic M, Jain N, Pejchal R. Redox-dependent conformational selection in a Cys(4)Fe(2)S(2) ferredoxin. Biochemistry. 2001;40:5602–5614. doi: 10.1021/bi0028845. [DOI] [PubMed] [Google Scholar]
- 8.Hamuro Y, Molnar KS, Coales SJ, OuYang B, Simorellis AK, Pochapsky TC. Hydrogen-deuterium exchange mass spectrometry for investigation of backbone dynamics of oxidized and reduced cytochrome P450cam. J Inorg Biochem. 2008;102:364–370. doi: 10.1016/j.jinorgbio.2007.10.001. [DOI] [PMC free article] [PubMed] [Google Scholar]
- 9.Englander SW. Protein folding intermediates and pathways studied by hydrogen exchange. Ann Rev Biophys Biomol Struct. 2000;29:213–238. doi: 10.1146/annurev.biophys.29.1.213. [DOI] [PubMed] [Google Scholar]
- 10.Koga H, Sagara Y, Yaoi T, Tsujimura M, Nakamura K, Sekimizu K, Makino R, Shimada H, Ishimura Y, Yura K, Go M, Ikeguchi M, Horiuchi T. Essential role of the Arg112 residue of cytochrome-P450cam for electron transfer from reduced putidaredoxin. FEBS Lett. 1993;331:109–113. doi: 10.1016/0014-5793(93)80307-g. [DOI] [PubMed] [Google Scholar]
- 11.Pochapsky TC, Lyons TA, Kazanis S, Arakaki T, Ratnaswamy G. A structure-based model for cytochrome P450(cam)-putidaredoxin interactions. Biochimie. 1996;78:723–733. doi: 10.1016/s0300-9084(97)82530-8. [DOI] [PubMed] [Google Scholar]
- 12.Poulos TL, Finzel BC, Howard AJ. High resolution crystal-structure of cytochrome P450cam. J Mol Biol. 1987;195:687–700. doi: 10.1016/0022-2836(87)90190-2. [DOI] [PubMed] [Google Scholar]
- 13.Sari N, Holden MJ, Mayhew MP, Vilker VL, Coxon B. Comparison of backbone dynamics of oxidized and reduced putidaredoxin by N-15 NMR relaxation measurements. Biochemistry. 1999;38:9862–9871. doi: 10.1021/bi9906423. [DOI] [PubMed] [Google Scholar]
- 14.Kostic M, Bernhardt R, Pochapsky TC. A conserved histidine in vertebrate-type ferredoxins is critical for redox-dependent dynamics. Biochemistry. 2003;42:8171–8182. doi: 10.1021/bi034500r. [DOI] [PubMed] [Google Scholar]
- 15.Clore GM, Driscoll PC, Wingfield PT, Gronenborn AM. Analysis of the backbone dynamics of interleukin-1-beta using 2-dimensional inverse detected heteronuclear N15-H1 NMR spectroscopy. Biochemistry. 1990;29:7387–7401. doi: 10.1021/bi00484a006. [DOI] [PubMed] [Google Scholar]
- 16.Ludemann SK, Lounnas V, Wade RC. How do substrates enter and products exit the buried active site of cytochrome P450cam? 1 Random expulsion molecular dynamics investigation of ligand access channels and mechanisms. J Mol Biol. 2000;303:797–811. doi: 10.1006/jmbi.2000.4154. [DOI] [PubMed] [Google Scholar]
- 17.Ludemann SK, Lounnas V, Wade RC. How do substrates enter and products exit the buried active site of cytochrome P450cam? 2 Steered molecular dynamics and adiabatic mapping of substrate pathways. J Mol Biol. 2000;303:813–830. doi: 10.1006/jmbi.2000.4155. [DOI] [PubMed] [Google Scholar]
- 18.Blanchard L, Blackledge MJ, Marion D, Guerlesquin F. Investigation of oxidation state-dependent conformational changes in Desulfovibrio vulgaris Hildenborough cytochrome c(553) by two-dimensional H-1-NMR spectra. FEBS Letters. 1996;389:203–209. doi: 10.1016/0014-5793(96)00580-7. [DOI] [PubMed] [Google Scholar]
- 19.Gooley PR, Zhao DZ, MacKenzie NE. Comparison of amide proton exchange in reduced and oxidized Rhodobacter capsulatus cytochrome c2: A 1H 15N NMR study. J Biomol NMR. 1991;1:145–154. doi: 10.1007/BF01877226. [DOI] [PubMed] [Google Scholar]
- 20.Marmorino JL, Auld DS, Betz SF, Doyle DF, Young GB, Pielak GJ. Amide proton exchange rates of oxidized and reduced Saccharomyces cerevisiae iso-1-cytochrome c. Prot Sci. 1993;2:1966–1974. doi: 10.1002/pro.5560021118. [DOI] [PMC free article] [PubMed] [Google Scholar]
- 21.Rui LY, Pochapsky SS, Pochapsky TC. Comparison of the complexes formed by cytochrome P450(cam) with cytochrome b(5) and putidaredoxin, two effectors of camphor hydroxylase activity. Biochemistry. 2006;45:3887–3897. doi: 10.1021/bi052318f. [DOI] [PMC free article] [PubMed] [Google Scholar]
- 22.Nickerson DP, Wong LL. The dimerization of Pseudomonas putida cytochrome P450(cam): Practical consequences and engineering of a monomeric enzyme. Prot Eng. 1997;10:1357–1361. doi: 10.1093/protein/10.12.1357. [DOI] [PubMed] [Google Scholar]
- 23.Pervushin K, Riek R, Wider G, Wuthrich K. Attenuated T2 relaxation by mutual cancellation of dipole-dipole coupling and chemical shift anisotropy indicates an avenue to NMR structures of very large biological macromolecules in solution. Proc Natl Acad Sci USA. 1997;94:12366–12371. doi: 10.1073/pnas.94.23.12366. [DOI] [PMC free article] [PubMed] [Google Scholar]
- 24.Zhu G, Xia YL, Nicholson LK, Sze KH. Protein dynamics measurements by TROSY-based NMR experiments. J Magn Reson. 2000;143:423–426. doi: 10.1006/jmre.2000.2022. [DOI] [PubMed] [Google Scholar]
- 25.Raag R, Poulos TL. Crystal structure of the carbon monoxide substrate cytochrome P450cam ternary complex. Biochemistry. 1989;28:7586–7592. doi: 10.1021/bi00445a013. [DOI] [PubMed] [Google Scholar]
- 26.DeLano WL. The PyMOL molecular graphics system 2008 [Google Scholar]
Associated Data
This section collects any data citations, data availability statements, or supplementary materials included in this article.