Abstract
Breakdown of chlorophyll is a major contributor to the diagnostic color changes in fall leaves, and in ripening apples and pears, where it commonly provides colorless, nonfluorescent tetrapyrroles. In contrast, in ripening bananas (Musa acuminata) chlorophylls fade to give unique fluorescent catabolites (FCCs), causing yellow bananas to glow blue, when observed under UV light. Here, we demonstrate the capacity of the blue fluorescent chlorophyll catabolites to signal symptoms of programmed cell death in a plant. We report on studies of bright blue luminescent rings on the peel of very ripe bananas, which arise as halos around necrotic areas in ‘senescence associated’ dark spots. These dark spots appear naturally on the peel of ripe bananas and occur in the vicinity of stomata. Wavelength, space, and time resolved fluorescence measurements allowed the luminescent areas to be monitored on whole bananas. Our studies revealed an accumulation of FCCs in luminescent rings, within senescing cells undergoing the transition to dead tissue, as was observable by morphological textural cellular changes. FCCs typically are short lived intermediates of chlorophyll breakdown. In some plants, FCCs are uniquely persistent, as is seen in bananas, and can thus be used as luminescent in vivo markers in tissue undergoing senescence. While FCCs still remain to be tested for their own hypothetical physiological role in plants, they may help fill the demand for specific endogenous molecular reporters in noninvasive assays of plant senescence. Thus, they allow for in vivo studies, which provide insights into critical stages preceding cell death.
Keywords: apoptosis, luminescent marker, tetrapyrrole, fruit, plant senescence
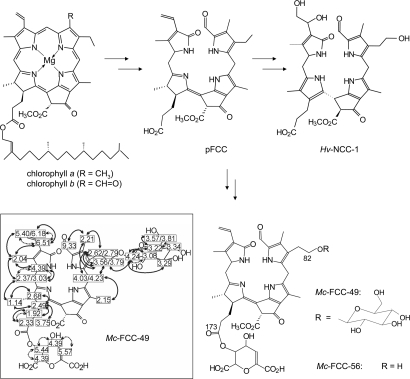
The appearance of the fall colors is a hallmark of chlorophyll breakdown in deciduous trees and shrubs (1, 2). Degreening and typical color changes are visible symptoms of leaf senescence (3), a form of programmed cell death in plants (4). In senescent leaves, chlorophylls (a and b) (5) are broken down to nonfluorescent chlorophyll catabolites (NCCs) (see Fig. 1) (2). The same NCCs were observed in ripe apples and pears, suggesting chlorophyll catabolism during senescence or ripening to follow a broadly common pathway (6, 7). However, in bananas (Musa acuminata, ‘cavendish’ cultivar), unique fluorescent chlorophyll catabolites (FCCs) were discovered, pointing to a previously unknown path of chlorophyll breakdown (8). Yellow bananas were thus found to exhibit blue luminescence, when observed under UV light (8).
Fig. 1.
Outline of chlorophyll breakdown in higher plants. Chlorophylls a and b are degraded to nonfluorescent chlorophyll catabolites (such as Hv-NCC-1 from barley) via the primary fluorescent chlorophyll catabolite (pFCC) (2). In peels of bananas pFCC is transformed into the polar Mc-FCC-56, with a unique daucyl (-type) moiety at position 173 of the propionic acid function (8, 28), and to hypermodified FCCs, such as Mc-FCC-49, with an additional β-glucopyranose unit at position 82; (Inset) 1H-NMR data of Mc-FCC-49 and homonuclear correlations (dashed arrows indicate COSY couplings, bold arrows show NOEs from a ROESY spectrum) from 500 MHz NMR spectra in CD3OD (for details, see Materials and Methods and SI Methods).
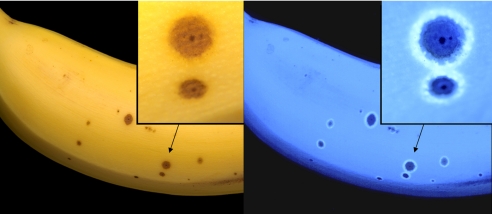
In the process of over-ripening of bananas diagnostic “senescence associated” dark spots appear on the yellow peel (9, 10), while the luminescence slowly fades (8). At approximately the same time, remarkably intense, blue luminescent rings develop. As reported here, the luminescent rings form blue halos around the “dark” spots on the peel of the bananas (see Fig. 2) and accumulate unique FCCs.
Fig. 2.
Ripening bananas exhibit blue luminescence and develop strongly luminescent blue halos around senescence associated dark spots. Images of bananas made with digital cameras, using white light (day light) (Left) and black light (at 366 nm) (Right), including magnified sections in the insets.
Results
Analysis of FCCs in the Luminescent Rings—Identification and Further Structural Characterization of “Hypermodified” Fluorescent Chlorophyll Catabolites (FCCs).
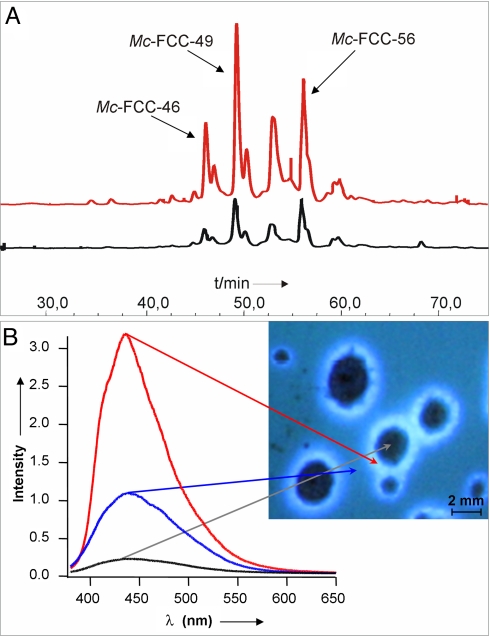
In extracts obtained from the region of the blue luminescent rings, several polar FCCs were detected and identified by high performance liquid chromatography (HPLC, see Fig. 3, Materials and Methods, and Fig. S1). The major luminescent fraction was due to the polar Mc-FCC-49, which was also detected as a minor component in extracts of whole peels of yellow bananas (8). Two less polar FCC-fractions were similarly identified with Mc-FCC-56 and Mc-FCC-53, found as major fractions in extracts of peels of freshly ripe whole banana (8). A provisional structure of Mc-FCC-49 was obtained earlier from high resolution mass spectrometry, giving the molecular formula as C48H48N4O19, and from NMR (NMR) spectroscopic studies (8). Further homo- and hetero-nuclear NMR spectroscopic studies (11) were carried out here and allowed the structure of the remarkably hypermodified Mc-FCC-49 to be derived (see Materials and Methods and Fig. S2). Mc-FCC-49 is a linear tetrapyrrole related to Mc-FCC-56. At the critical propionate side chain, both of these FCCs feature an ester function with daucic acid (or a stereoisomer of it) attached at the 5′-OH-group (8). Mc-FCC-49 arises from Mc-FCC-56 (in a formal sense) by further covalent attachment of a sugar moiety. This modification was identified as a β-glucopyranosyl group, attached at the 82-hydroxyl group, as shown from 1H-homonuclear correlations (see Fig. 1 and Fig. S2). Mc-FCC-46, a less abundant and slightly more polar FCC, was also analyzed by mass spectrometry and shown to be an isomer of Mc-FCC-49 [where esterification with daucic acid (or with a stereosisomer of it) is likely to involve attachment at the 4′-OH group].
Fig. 3.
In luminescent rings on banana peels hypermodified FCCs accumulate. (A) HPLC-analysis of FCCs in luminescent rings and dark spots (red and black traces, respectively). (B) In vivo spectral analysis of emission from surrounding peel, from a luminescent ring, and from a dark spot, as specified in the image.
In extracts of peels taken from the regions of the dark spots, the yellow tissue and the luminescent rings the amounts of the FCCs were determined (on a per weight basis, see Materials and Methods). The amounts determined showed some spread, but they were significantly lower in the dark spots (<40%), than in yellow tissue. In the region of the luminescent rings Mc-FCC-49 typically was more abundant (approximately by up to 20%), than in the yellow tissue. This increase of Mc-FCC-49 was compensated partially by a decrease of the amount of Mc-FCC-56 (see Figs. 2 and 3, SI Methods, and Fig. S3).
In Vivo Fluorescence Spectra of Luminescent Rings.
Fluorescence spectral analysis of the in vivo luminescence from the rings indicated a maximum near 445 nm, confirming FCCs as the major source of luminescence (8) (see Fig. 3). Excitation of the luminescent rings on the peels of intact bananas at 355 nm induced an in vivo luminescence spectrum similar to that of a solution of Mc-FCC-49 in methanol (characteristic emission maximum at 441 nm, see Fig. S4). The luminescence from the ring regions was approximately three times more intense (270 ± 40%) than that from surrounding yellow peel (100% rel. intensity), whereas dark spots showed only negligible emission (rel. intensity 15 ± 10%).
In Vivo Fluorescence Maps of Luminescent Rings.
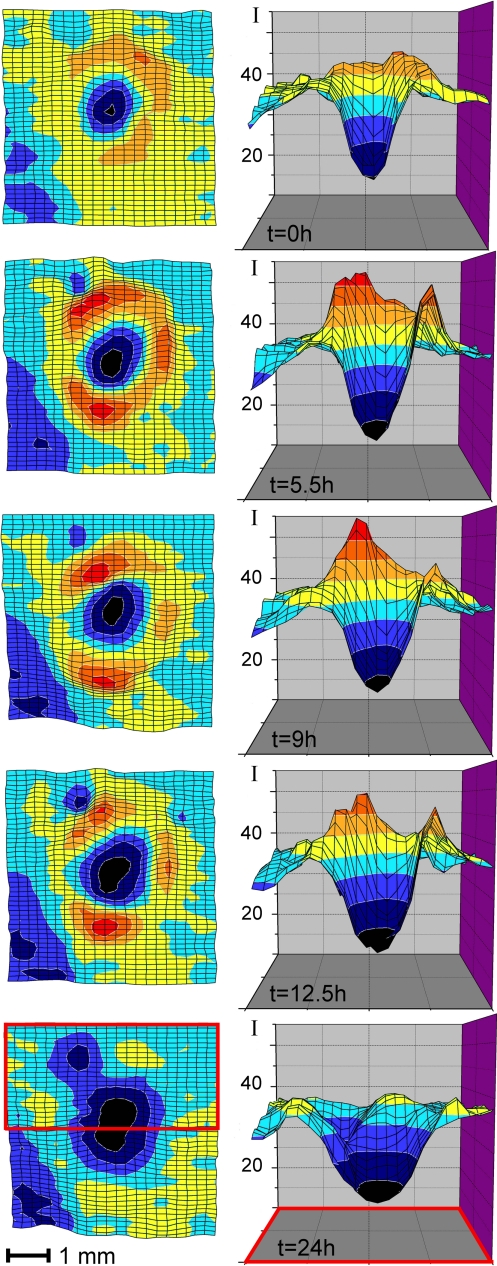
The development of the blue luminescent rings with time was further monitored by fluorescence analysis. During a period of ≈24 h, a developing and slightly spreading dark spot of an intact ripening banana and its vicinity were monitored in vivo by recording luminescence emission maps at 450 nm (see Fig. 4 and Materials and Methods). These maps reflect the rather remarkable changes and the progress of the formation of both, dark spots and their luminescent halos. The intensity of the luminescence from within the dark spot continuously decreased, whereas the ring first featured a strongly increasing luminescence. During a time of 24 h, the luminescent ring, eventually, lost its brightness, and its fluorescence decreased to a level nearly as low as observed in the surrounding yellow peel. FCCs accumulated temporarily in a roughly circular area around yet slightly outside of the growing dark spots (see Fig. 4).
Fig. 4.
Time and 2D-space resolved fluorescence analysis of a dark spot and its blue luminescent halo. In vivo luminescence of a luminescent ring surrounding a growing dark spot (detected at 450 nm, excitation at 350 nm, 0.5 mm spatial resolution); luminescence maps (Left) in false colors, recorded at the indicated times, with contour lines at specified absolute fluorescence intensities, and corresponding vertical projections (Right) as cut (through) near the center of a dark spot (see red frame) (Bottom).
Studies of Cellular Surface Morphology by Fluorescence Microscopy and Scanning Electron Microscopy (SEM).
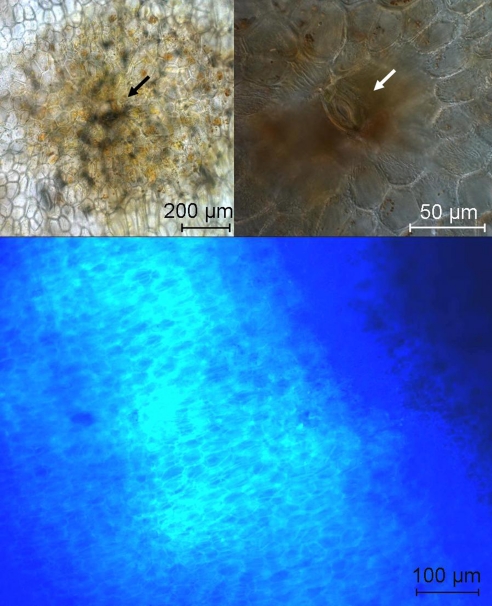
To gain further insights into the cellular basis of our observations, banana peels were also studied by fluorescence microscopy and SEM. Fluorescence microscopy indicated that the guard cells of the stomata (12) in the intact yellow peel of ripening bananas contained chloroplasts with chlorophyll, and suggested that the stomata were still functional (see Fig. S5). However, the subepidermal parenchyma cells of the surrounding yellow peel tissue had lost their chlorophylls, and the chloroplasts had converted into chromoplasts (13). Dark spots first appeared on the peel in areas surrounding some stomata, as was also observed elsewhere (14) (see Fig. 5). The luminescent halos around the dark spots could thus be analyzed at the cellular level. So far, the subcellular location of FCCs has remained concealed due to blue background luminescence, which is associated with cell wall components (15).
Fig. 5.
Senescence associated dark spots originate from stomata. (Top Left) Bright field microscopic images of dark spot on the surface of a yellow banana peel, stoma in the center (see arrow). (Top Right) Differential interference contrast (DIC) image with higher magnification, guard cells of the stomata are clearly visible in the center of the dark spot (see arrow). (Bottom) Fluorescence microscopic image of the transition zone between a dark spot and its yellow surroundings on the surface of a banana peel (all images depict surface sections of the epidermis and subepidermal parenchyma tissue, for experimental details, see Materials and Methods).
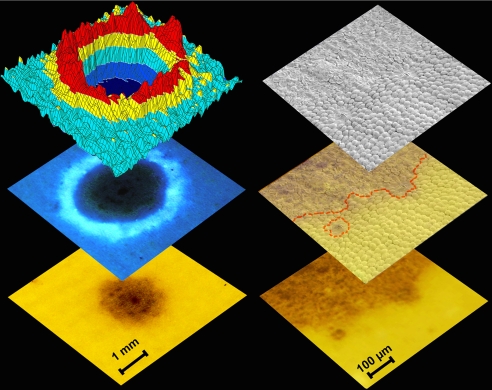
In the dark spots unstructured dark matter assembled irregularly in the tissue around the guard cells of the stomata and in their close vicinity. Presumably, they reflect the oxidative polymerization of peel phenolics, which appears to radiate from around the stomata (see Figs. 4 and 5). The epidermal layers were indented in this area, as was more clearly revealed by SEM-analysis. While yellow peels exhibited the typical morphological appearance of viable ripened cells with intact turgor, as observed elsewhere (16), the cells within the dark spots were contracted and had apparently lost much of their original contents. Comparison of the spatial distribution of FCCs, as derived from the fluorescence maps, with the surface morphology of the dark spots and of their vicinity, thus revealed the luminescent rings to mark a still living, senescent part in the zone undergoing a transition from ripened tissue to dead cells (see Fig. 6).
Fig. 6.
Hypermodified FCCs—endogenous molecular tools for analysis of senescence. Enlarged images of areas of a dark spot and its surroundings (Left, Bottom, and Center) and luminescence map (false colors, spatial resolution 0.5 mm) (Left, Top). Surface structure of boundary region of a dark spot from SEM analysis (Right, Top), stereo microscope image of the same area (Right, Bottom) and overlay of the two representations (red dotted line, rough trace of the local transition of still turgescent to dead cells).
Discussion
Complete breakdown of chlorophyll is the visible sign of plant senescence (1, 2, 3), and is considered to be a prerequisite also, to prevent cell death (17). Indeed, the deadly lack of two (functional) accelerated cell death genes (18, 19) has been traced to two defects in enzymatic chlorophyll catabolism. In senescent leaves, the joint activity of these two catabolic enzymes transforms green and red intermediates, which are (presumed to be) phototoxic to the plant cells, into the colorless tetrapyrrolic pFCCs (two epimeric) short lived intermediates on the way to NCCs, the typical final products of chlorophyll breakdown in leaves (2). Recently a new variant of chlorophyll breakdown was discovered in peels of ripening bananas (Musa acuminata, ‘cavendish’ cultivar), where uniquely modified fluorescent chlorophyll catabolites (FCCs) arise specifically (8). The present studies established the structure of the polar hypermodified Mc-FCC-49, which accumulates in the peels of the ripe bananas and that is suggested here to represent a fluorescent sign of senescence in the peels of ripe bananas.
When senescence associated dark spots slowly develop on banana peels as typical signs of local cell death, Mc-FCC-49 appears by (apparently) further enzyme catalyzed modification of (the then diminishing) Mc-FCC-56. Thus, the decrease of Mc-FCC-56, the main FCC of ripening bananas (8), and appearance of the hypermodified Mc-FCC-49, roughly mark the transition of “ripe” bananas to “rotten” ones. Indeed, hypermodified FCCs (such as Mc-FCC-49) accumulate in areas surrounding the senescence associated dark spots, in particular, and give rise to strongly enhanced fluorescence in easily observable “blue luminescent rings.” While a causative infectious agent for the spots has not been identified (14), their appearance and further growth were found elsewhere to depend upon the availability of molecular oxygen, consistent with an oxidative degenerative process (9, 20). The dark spots originate from near the stomata on the ripened banana peel (see Fig. 5) as slowly growing regions of dead cells (14), which reach out, eventually, to form the typical dark brown leathery (possibly protective) peel of over ripe bananas (10). Senescence associated spots are thus commonly seen as markers for over-ripeness, reducing the value of this most important commercial fruit (10). However, in other instances, e.g., with the “sucrier bananas,” the appearance of spots is taken as a sign of optimal ripeness (20).
In the yellow peel of ripe bananas, luminescent rings mark a region of senescent cells, before their transition to the necrotic state, as encountered in the senescence associated spots (Fig. 2). Hypermodified FCCs (such as Mc-FCC-49) accumulate there in a region of still viable cells programmed for cell death, and thus lighting up intensely luminescent halos around the dark necrotic spots (see Figs. 5 and 6). Analogous to two FCCs of A. thaliana [and other hypothetical polar FCCs (2)] that were (all) suggested to be found in the cytosol (21), the hypermodified Mc-FCC-49 may arise in this extended cellular compartment of senescent cells. Presumably, this process involves a specific enzymatic “extra” glycosylation involving Mc-FCC-56 as substrate. Else, the mobile FCCs might, in part, accumulate as a consequence of an intercellular dislocation, and they may originate from neighbouring cells [in particular, when these start leaking at a late stage of senescence (13)]. However, a net de novo synthesis of FCCs from chlorophyll (or other green precursors) is unlikely, since none of these would be available in ripe, yellow bananas.
In contrast to the prototypical FCCs that were traced in degreening leaves earlier as fleetingly existent intermediates (2, 22), persistent, polar FCCs were found in the peels of bananas, as described here and elsewhere (8). Indeed, persistent FCCs are detectable also in other plant tissues; in senescing banana leaves the accumulation of persistent polar FCCs was recently observed (8). These polar FCCs are likely to carry a propionate ester function that stabilizes them against the generally rapid isomerization to nonfluorescent chlorophyll catabolites (NCCs) (23). Likewise, a polar FCC was detected as the main chlorophyll catabolite in naturally degreened, senescent leaves of the Peace lily (Spathiphyllum wallisii or spathe flower), a decorative monocot distantly related to Musa acuminata. Indeed, this FCC appears to be identical to a persistent FCC found in extracts from degreened banana leaves (see Fig. S6). In artificially degreened leaves of A. thaliana, three FCCs were found that were indicated to carry a free propionic acid side chain (21).
As shown here, hypermodified FCCs persist in the peels of bananas and accumulate selectively (by still unknown means) in the senescent tissue surrounding dark necrotic parts of banana peels. These FCCs may thus serve there as specific luminescent molecular markers of senescence, a form of programmed cell death in still living plant cells (4, 24). In contrast to leaves, where senescence can be observed easily by looking at chlorophyll breakdown (1, 2), in (already) degreened plant tissue, as found in many ripened fruit (6), easily observable, specific in vivo reporters for senescence are not yet known (25). In ripe fruit optical reporters are clearly of particular value as helpers in noninvasive monitoring of the still enigmatic, programmed cellular processes on the way to the eventual cell death. Direct visualization of effects of actual cell death in plants is possible by sensitive bioluminescence techniques that are monitoring reactive oxygen species (ROS) indirectly by the luminescence of their oxidation products (26, 27).
In ripening bananas, FCCs accumulate in uniquely stabilized and specifically hypermodified versions, suggesting a physiological benefit from the prolonged existence of these linear tetrapyrroles. Indeed, NCCs, the often abundant final products of natural chlorophyll breakdown (2, 6), are noteworthy antioxidants (6, 28), which may help retain and extend the viability of ripe and senescing tissues. While specific physiological roles of NCCs in plants are still unknown, the related linear tetrapyrrole from heme breakdown, bilirubin, has recently attracted interest as cyto-protectant in mammals (29). All of these findings call for further in vivo studies of the availability of FCCs, their cellular distribution and possible roles in bananas, and in other higher plants. The identification of the enzymes that introduce the new peripheral groups at C-82 and C-173 in polar FCCs, such as Mc-FCC-56 and Mc-FCC-49, will also be of interest.
Fruit eating animals might have learned, through survival pressure (30), to notice the blue luminescence of FCCs in ripening bananas, and the characteristic rings that develop as halos on the spotted peels of very ripe bananas. For humans, the blue luminescence of yellow bananas is a recently discovered feature (8), which is entertaining and stunning, at first. As suggested here, natural fluorescent FCCs may prove to be helpful as a noninvasive, molecular tool (15) for studying cellular processes in plants. Their luminescence is likely to be particularly useful for optical in vivo monitoring of ripening and over-ripening of bananas (10) and other fruit, as well as of leaf senescence (25).
Chlorophylls are ubiquitous on earth, and their metabolism is clearly visible, even from outer space (22). Their natural remains, which have only lately been identified (see Fig. 1) (2, 28, 31–33), may now help explore crucial life processes in plants, in the microscopic, cellular domain.
Materials and Methods
Materials.
Solvents (reagent-grade, commercial) were redistilled before use for extractions. HPLC grade methanol (MeOH) was from Merck and Acros Organics. Potassium dihydrogen phosphate and potassium phosphate dibasic-anhydrous were from Fluka. Amberlite IRA-900, Cl-form ion exchange resin was from Acros Organics. Sep-Pak-C18 Cartridges were from Waters Associates. The pH values were measured with a WTW Sentix 21 electrode connected to a WTW pH535 digital pH meter.
Spectroscopy.
UV/Vis-spectra: Hitachi U3000 spectrophotometer. CD-spectra: Jasco J715 spectropolarimeter. Luminescence spectra: Varian Cary Eclipse fluorescence spectrometer. 1H- and 13C- NMR (NMR) spectroscopy: Bruker UltraShield 600 MHz or Varian Unity Inova 500 MHz spectrometers. “Liquid Secondary Ion” Mass spectrometry (LSIMS): Finnigan MAT 95-S, positive-ion mode, cesium gun, 20 keV, matrix: glycerine, m/z (rel. abundance); high resolution mass spectrometry (HR-LSIMS-MS): matrix and internal standard: glycerine.
HPLC Analyses of Luminescent Rings, Brown Spots, and Yellow Areas of Banana Peels.
Extracts were produced by cutting out separately the luminescent areas of banana peels around the brown spots and the still yellow areas of the same bananas with a scalpel under UV light. Five independent samples of each source were obtained and analyzed quantitatively. In a second set, three samples each were prepared by cutting out brown spots and, separately, the luminescent areas around them under the same conditions. The samples were first weighed (sample size ≈10 μg) and then transferred into an Eppendorf reaction vessel, mixed with 300 μL of methanol and 1 mL of water. The mixture was centrifuged and the supernatant was directly applied to analytical HPLC (Dionex Summit connected to an FP920 fluorescence detector; Hypersil ODS 5 μm 250 × 4.6 mm i.d. column at r.t. protected with a Phenomenex ODS 4 mm × 3 mm i.d. precolumn, for solvent composition, see reference 8 and Figs. S1 and S3).
Isolation of Mc-FCC-49 for Structure Elucidation.
The outer parts of the peels of 36.3 kg of yellow bananas (Musa acuminata AAA, ‘cavendish cultivar) were frozen in liquid nitrogen and ground. Five L of MeOH were added, the mixture was left to warm up for half an hour, and the pulp was squeezed through a fruit-squeezer giving a turbid juice. The filter cake was blended again twice with 2 L of MeOH and extracted as before. The juice was then filtrated over celite and MeOH was removed on a rotary evaporator. The residual mixture was diluted with 80 mL of water and 120 mL of potassium phosphate buffer 100 mM pH 7, filtrated over celite, desalted in two parallel batches by passing through 2 SepPak Vac C18–5g cartridges [solvent for elution: 50 mL of methanol/water 75/25 (vol/vol) each] and concentrated to a volume of 30 mL on a rotary evaporator. Forty mL of water and 10 mL of buffer were added. The extract was loaded in two parallel batches onto two anion exchange columns with 12.5 mL of solid resin each. Elution of each batch with 100 mL of 0.5 M aqueous NaCl, followed by 100 mL of 0.5 M aqueous NaCl/MeOH 80/20 (vol/vol); the solution that eluted from the IEX-column when it was loaded with the extract was collected and again applied to 12.5 mL of Amberlite-material. Elution with 70 mL of 0.5 M NaCl and 70 mL of 0.5 M aqueous NaCl/MeOH 80/20 (vol/vol). The eluates were separated by preparative HPLC (for details, see SI Methods or reference 8). Crude samples of Mc-FCC-49 were concentrated on a rotary evaporator and further purified by semipreparative HPLC, yielding two fractions (1.04 mg and 0.63 mg) of Mc-FCC-49 (containing Mc-FCC-46 as impurity). These samples were used to record COSY, ROESY, and HSQC spectra. By repeating the semipreparative HPLC separation, a sample of 83 μg (8.4 μmol) of pure Mc-FCC-49 was obtained, which was used to record UV/Vis-, CD-, and fluorescence spectra (in MeOH) and 1H-NMR spectra in CD3OD and D2O.
Luminescence Spectra of Intact Bananas.
The luminescence spectra of intact, commercially available (ethylene-ripened) bananas from a supermarket in New York City were measured using a Acton Spectrograph (SpectraPro-2150) in conjunction with an Intensified CCD detector (PI-MAX from Princeton Instruments) with fiber optics attachment and a pulsed Nd-YAG laser (excitation wavelength 355 nm, repetition rate 30 Hz, pulse length 10 ns; spot size 0.4 mm).
Fluorescence Intensity Map of Area Around a Dark Spot.
An intact, yellow brown-spotted banana (Musa cavendish) from a supermarket in Innsbruck “with dark spots” on the surface was oriented and directly placed at the detection head of a fiber optics attachment of a Varian Cary Eclipse spectrometer (excitation wavelength 350 ± 2.5 nm, emission at 450 ± 2.5 nm). Data were processed with Origin 7G.
Light- and Fluorescence Microscopy of Banana Peels.
Hand sections of the epidermis and adjacent parenchyma cell layers were prepared with a razor blade. Sections were investigated at a Zeiss 200M Axiovert microscope (Zeiss) using bright field or differential interference contrast (DIC) illumination. Epifluorescence was recorded with Filter set 01 excitation BP 365/12 nm, beam splitter FT 395 nm, emission LP 397 nm. Images were recorded with a Zeiss Axiocam MRc5, controlled by Zeiss Axiovision (rel. 4.7) software (Carl Zeiss Vision GmbH) using a 10× or a 63× oil objective lens.
Scanning Electron Microscopy (SEM) of Surface Layer of a Banana Peel.
For SEM investigation segments of banana peels containing individual brown spots, as recorded by a zoom stereo microscope (Olympus SXZ12) equipped with a digital camera (Olympus Camedia C-7070) were prepared. The segments were transferred to distilled water and dehydrated in a series of ethanol solutions with increasing concentrations (10%, 20%, 30%, 40%, 50%, 60%, 70%, 80%, 90%, 99.5%; 30 min each). For chemical dehydration the material was transferred to formaldehyde-dimethylacetal (FDA, dimethoxymethane) for 24 h, followed by FDA for 2 h. The sample was critical-point dried with liquid CO2 using FDA as intermedium, sputter-coated with gold-palladium, and examined with a Philips XL20 SEM microscope at 10 kV.
Photograph Images.
Images of bananas, as shown in Figs. 2 and 3, were taken with digital cameras (Canon Power shot SD550 or Canon EOS 450D). For luminescence images, a hand-held lamp (e.g., UVGL-25 from UVP, with nominal emission ≈366 nm) was used for excitation.
Spectroscopic Characterization of Mc-FCC-49.
(rt = 49 min): UV-Vis (MeOH, c = 28 μM) λmax (log ε) = 363 (4.0), 318 (4.3), 242 (4.32). CD (MeOH, c = 31 μM) λmax/nm (Δε) = 244 (−10.2), 289 (8.8), 325 (sh, −0.6), 350 (−5.3). 1H-NMR (500 MHz, D2O; signals of sugar moiety; see SI Methods for a complete list of signals): δ = 3.05 {m, HC(2″)}, 3.18 {m, HC(5″}, HC{4″)}, 3.33 {m, HC(3″)}, 3.55 {dd, J = 5.1/12.0 Hz, HAC(6″)}, 3.73 {d, J = 11.6 Hz, HBC(6″)}, 4.15 {d, J = 8.0 Hz, HC(1″)}. 1H-NMR (600 MHz, CD3OD): δ = 3.10 {m, HC(2″)}, 3.21 {m, HC(5″)}, 3.29 {HC(3″)}, 3.34 {HC(4″)} 3.57 {m, HAC(6″)}, 3.82 {m, HBC(6″)}, 4.23 {d, J = 7.9 Hz, HC(1″)}. 13C-NMR: (150 MHz, CD3OD, signal assignment from HSQC experiment): δ = 62.6 (6″), 74.4 (2″), 75.3 (3″), 77.5 (5″), 77.9 (4″), 104.2 (1″). LSIMS-MS: m/z (%) = 1033.57 (42), 1032.54 (58), 1031.58 (71, [M+K]+), 1015.58 (47, [M+Na]+), 993.57 (30, [M+H]+), 846.69 (54), 845.73 (100, [M-C7H6O6 +K]+), 807.96 (93, [M-C7H6O6 +H]+). HR-LSIMS-MS: m/z = 993.369 ([M+H]+), m/zcalc (C48H49N4O19) = 993.361.
Spectroscopic Data of Mc-FCC-46.
(rt = 46 min): UV-Vis (“online” spectrum of an HPLC fraction) λmax (rel. ε) = 368 (0.66), 317 (1.00), 233 (1.00); LSIMS-MS: m/z (%) = 1033.42 (40), 1032.69 (64), 1031.65 (97, [M+K]+), 995.55 (32), 994.63 (56), 993.57 (100, [M+H]+), 871.59 (49, [M-ring A+H]+), 845.85 (25, [M-C7H6O6+K]+), 808.13 (44, [M-C7H6O6+H]+).
Supplementary Material
Acknowledgments.
We thank Stefan Hörtensteiner (University of Zürich) for helpful discussions and Werner Kofler (University of Innsbruck, Institute of Botany) for expert help in performing the SEM preparations. This work was funded by the Austrian Science Foundation (FWF, Project No. 19596) and the U.S. National Science Foundation Grant NSF-CHE 07–17518.
Footnotes
The authors declare no conflict of interest.
This article contains supporting information online at www.pnas.org/cgi/content/full/0908060106/DCSupplemental.
References
- 1.Matile P. Biochemistry of Indian summer: Physiology of autumnal leaf coloration. Exp Gerontol. 2000;35:145–158. doi: 10.1016/s0531-5565(00)00081-4. [DOI] [PubMed] [Google Scholar]
- 2.Kräutler B, Hörtensteiner S. Chlorophyll Catabolites and the Biochemistry of Chlorophyll Breakdown. In: Grimm B, Porra R, Rüdiger W, Scheer H, editors. Chlorophylls and Bacteriochlorophylls. Dordrecht, The Netherlands: Springer; 2006. pp. 237–260. [Google Scholar]
- 3.Thomas H, Ougham H, Hörtensteiner S. Recent advances in the cell biology of chlorophyll catabolism. Adv Bot Res. 2001;35:1–52. [Google Scholar]
- 4.Gray J. Programmed Cell Death in Plants. CRC Press, Oxford: Blackwell Publishing; 2004. [Google Scholar]
- 5.Rüdiger W. Biosynthesis of Chlorophylls a and b: The Last Steps. In: Grimm B, Porra RJ, Rüdiger W, Scheer H, editors. Chlorophylls and Bacteriochlorophylls. Dordrecht, The Netherlands: Springer; 2006. pp. 189–200. [Google Scholar]
- 6.Müller T, Ulrich M, Ongania K-H, Kräutler B. Colorless tetrapyrrolic chlorophyll catabolites found in ripening fruit are effective antioxidants. Angew Chem Int Ed. 2007;46:8699–8702. doi: 10.1002/anie.200703587. [DOI] [PMC free article] [PubMed] [Google Scholar]
- 7.Kräutler B. Chlorophyll breakdown and chlorophyll catabolites in leaves and fruit. Photochem Photobiol Sci. 2008;7:1114–1120. doi: 10.1039/b802356p. [DOI] [PMC free article] [PubMed] [Google Scholar]
- 8.Moser S, et al. Blue luminescence of ripening bananas. Angew Chem Int Ed. 2008;47:8954–8957. doi: 10.1002/anie.200803189. [DOI] [PMC free article] [PubMed] [Google Scholar]
- 9.Choehom R, Ketsa S, van Doorn WG. Senescent spotting of banana peel is inhibited by modified atmosphere packaging. Postharvest Biol Technol. 2004;31:167–175. [Google Scholar]
- 10.Mendoza F, Aguilera JM. Application of image analysis for classification of ripening bananas. J Food Sci. 2004;69:E471–E477. [Google Scholar]
- 11.Kessler H, Gehrke M, Griesinger C. Two-dimensional NMR-spectroscopy - Background and overview of the experiments. Angew Chem Int Ed. 1988;27:490–536. [Google Scholar]
- 12.Willmer C, Fricker M. Stomata. London: Chapman & Hall; 1996. [Google Scholar]
- 13.Matile P. The Vacuole and Cell Senescence. In: Callow JA, editor. Advances in Botanical Research. Vol 25. New York: Academic; 1997. pp. 87–112. [Google Scholar]
- 14.Romphophak T, Ueda Y, Terai H, Abe K. Study of senescent spotting of banana peel. Food Preservation Sci. 2005;31:55–60. [Google Scholar]
- 15.Lichtenthaler HK, Miehé JA. Fluorescence imaging as a diagnostic tool for plant stress. Trends Plants Sci. 1997;2:316–320. [Google Scholar]
- 16.Williams MH, Vesk M, Mullins MG. A scanning electron-microscope study of the formation and surface characteristics of the peel of the banana fruit during its development. Bot Gaz. 1989;150:30–40. [Google Scholar]
- 17.Hörtensteiner S. Chlorophyll degradation during senescence. Annu Rev Plant Biol. 2006;57:55–77. doi: 10.1146/annurev.arplant.57.032905.105212. [DOI] [PubMed] [Google Scholar]
- 18.Greenberg JT, Ausubel FM. Arabidopsis mutants compromised for the control of cellular damage during pathogenesis and aging. Plant J. 1993;4:327–341. doi: 10.1046/j.1365-313x.1993.04020327.x. [DOI] [PubMed] [Google Scholar]
- 19.Mach JM, Castillo AR, Hoogstraten R, Greenberg JT. The Arabidopsis accelerated cell death gene ACD2 encodes red chlorophyll catabolite reductase and suppresses the spread of disease symptoms. Proc Natl Acad Sci USA. 2001;98:771–776. doi: 10.1073/pnas.021465298. [DOI] [PMC free article] [PubMed] [Google Scholar]
- 20.Trakulnaleumsai C, Ketsa S, van Doorn WG. Temperature effects on peel spotting in ‘Sucrier’ banana fruit. Postharvest Biol Technol. 2006;39:285–290. [Google Scholar]
- 21.Pružinska A, et al. In vivo participation of red chlorophyll catabolite reductase in chlorophyll breakdown and in detoxification of photodynamic chlorophyll catabolites. Plant Cell. 2007;19:369–387. doi: 10.1105/tpc.106.044404. [DOI] [PMC free article] [PubMed] [Google Scholar]
- 22.Kräutler B, Matile P. Solving the riddle of chlorophyll breakdown. Acc Chem Res. 1999;32:35–43. [Google Scholar]
- 23.Oberhuber M, Berghold J, Breuker K, Hörtensteiner S, Kräutler B. Breakdown of chlorophyll: A nonenzymatic reaction accounts for the formation of the colorless “nonfluorescent” chlorophyll catabolites. Proc Natl Acad Sci USA. 2003;100:6910–6915. doi: 10.1073/pnas.1232207100. [DOI] [PMC free article] [PubMed] [Google Scholar]
- 24.Noodén LD. Plant Cell Death Processes. Amsterdam: Elsevier; 2004. [Google Scholar]
- 25.Lim PO, Kim HJ, Nam HG. Leaf senescence. Ann Rev Plant Biol. 2007;58:115–136. doi: 10.1146/annurev.arplant.57.032905.105316. [DOI] [PubMed] [Google Scholar]
- 26.Havaux M, Triantaphylides C, Genty B. Autoluminescence imaging: A non-invasive tool for mapping oxidative stress. Trends Plants Sci. 2006;11:480–484. doi: 10.1016/j.tplants.2006.08.001. [DOI] [PubMed] [Google Scholar]
- 27.Kobayashi M, Sasaki K, Enomoto M, Ehara Y. Highly sensitive determination of transient generation of biophotons during hypersensitive response to cucumber mosaic virus in cowpea. J Exp Bot. 2007;58:465–472. doi: 10.1093/jxb/erl215. [DOI] [PubMed] [Google Scholar]
- 28.Moser S, Müller T, Oberhuber M, Kräutler B. Chlorophyll catabolites—Chemical and structural footprints of a fascinating biological phenomenon. Eur J Org Chem. 2009:21–31. doi: 10.1002/ejoc.200800804. [DOI] [PMC free article] [PubMed] [Google Scholar]
- 29.Baranano DE, Rao M, Ferris CD, Snyder SH. Biliverdin reductase: A major physiologic cytoprotectant. Proc Natl Acad Sci USA. 2002;99:16093–16098. doi: 10.1073/pnas.252626999. [DOI] [PMC free article] [PubMed] [Google Scholar]
- 30.Osorio D, Smith AC, Vorobyev M, Buchanan-Smith HM. Detection of fruit and the selection of primate visual pigments for color vision. Am Naturalist. 2004;164:696–708. doi: 10.1086/425332. [DOI] [PubMed] [Google Scholar]
- 31.Kräutler B, Jaun B, Bortlik K, Schellenberg M, Matile P. On the enigma of chlorophyll degradation - The constitution of a secoporphinoid catabolite. Angew Chem Int Ed. 1991;30:1315–1318. [Google Scholar]
- 32.Matile P, Hörtensteiner S, Thomas H, Kräutler B. Chlorophyll breakdown in senescent leaves. Plant Physiol. 1996;112:1403–1409. doi: 10.1104/pp.112.4.1403. [DOI] [PMC free article] [PubMed] [Google Scholar]
- 33.Barry CS. The stay-green revolution: Recent progress in deciphering the mechanisms of chlorophyll degradation in higher plants. Plant Science. 2009;176:325–333. [Google Scholar]
Associated Data
This section collects any data citations, data availability statements, or supplementary materials included in this article.


