Abstract
Transmembrane helices are generally believed to insert into membranes based on their hydrophobicity. Nevertheless, there are important exceptions where polar residues have great functional importance, for instance the S4 helix of voltage-gated ion channels. It has been shown experimentally that insertion can be accomplished by hydrophobic counterbalance, predicting an arginine insertion cost of only 2.5 kcal/mol, compared with 14.9 kcal/mol in cyclohexane. Previous simulations of pure bilayers have produced values close to the pure hydrocarbon, which has lead to spirited discussion about the experimental conditions. Here, we have performed computer simulations of models better mimicking biological membranes by explicitly including protein helices at mass fractions from 15% to 55%, as well as an actual translocon. This has a striking effect on the solvation free energy of arginine. With some polar residues present, the solvation cost comes close to experimental observation at approximately 30% mass fraction, and negligible at 40%. In the presence of a translocon in the membrane, the cost of inserting arginine next to the lateral gate can be as low as 3–5 kcal/mol. The effect is mainly due to the extra helices making it easier to retain hydration water. These results offer a possible explanation for the discrepancy between the in vivo hydrophobicity scale and computer simulations and highlight the importance of the high protein contents in membranes. Although many membrane proteins are stable in pure bilayers, such simplified models might not be sufficiently accurate for insertion of polar or charged residues in biological membranes.
Keywords: free energy of insertion, impurities, lipid bilayer, membrane protein, molecular dynamics simulations
Understanding the properties and “molecular code” that turn some proteins into membrane proteins is a classical challenge (1) that has received a lot of recent attention (2–7). For most transmembrane segments (in particular, α-helices), the in vivo insertion occurs through the translocon channel, which is primarily believed to help sufficiently hydrophobic segments interact with the lipids (8, 9).
Transmembrane helices are usually quite hydrophobic to insert efficiently into the lipid phase, but there are exceptions, with polar or even charged residues found in transmembrane stretches. When these unfavorable residues are evolutionarily conserved, they are frequently of paramount functional importance, for instance, the four arginines in the S4 voltage sensor helix of voltage-gated ion channels (10). When they are found in three-dimensional structures, charged or polar residues are often directed toward the protein interior to be able to pair hydrogen bonds, but during membrane protein synthesis, they will need to be transiently stabilized by some other mechanism or interactions to enable insertion in the first place.
Only a couple of years ago, Hessa et al. (2) showed experimentally that it is possible to introduce polar groups in transmembrane segments and still have these insert spontaneously, as long as they are counterbalanced by sufficient amounts of hydrophobic residues. This feature also made it possible to determine an apparent in vivo hydrophobicity scale (11). One of the most striking features of this scale is that it predicts very low apparent free energy of insertion for charged residues; arginine carries a membrane solvation penalty of only 2.5 kcal/mol in the Hessa scale, which is many times lower than the experimental value in pure cyclohexane of 14.9 kcal/mol (12). Toby Allen and coworkers were the first to use simulations to show that the cost of arginine solvation in a pure bilayer is very close to the pure hydrocarbon (4), and several other simulation studies have also been performed to understand the “abnormal” solvation observed in experiments (13–15). As first pointed out by MacCallum et al. (14), it is quite interesting that both these simulations and the pure hydrocarbon values for different residues exhibit quite good relative correlation with the Hessa biological scale, but the slope is much larger than unity. The computer simulation studies predict that the center (but not the interface region) of an ideal lipid bilayer is close to a pure hydrocarbon, whereas the biological scale essentially appears to be a compressed version of the calculated ones.
In itself, this could be tempting to ascribe to artifacts in the experimental setup, which arguably is a more complex environment and measurement than the pure bilayers used in simulations. However, profiles for free energy of solvation derived from the very same experimental setup have recently made it possible to design remarkably accurate membrane protein topology predictors (7), which has not been possible with the scales derived from simulations. This is important, both because it seems to confirm the original hypothesis that membrane protein insertion is virtually exclusively determined by hydrophobicity (1) and because it significantly strengthens the validity of the experimental results. This leads to the strange paradox that the experiments appear to be correct in the sense that they form a good phenomenological description of in vivo helix insertion, but the various simulations should also be correct in their description of the central hydrocarbon environment. Differences in protonation states (14, 15) or polarization effects (16) have not been able to reconcile the results, and although the special lipid composition and reduced thickness of the ER membrane could have a limited effect on membrane solvation (17), it is far from sufficient to explain the discrepancy between simulated and experimental free energies.
Here, we suggest that these perplexing results can be explained by the protein contents of real membranes based on molecular simulation results. To reduce complexity, modeling frequently assumes that a biological membrane is adequately described by a pure lipid bilayer. However, a typical biological membrane consists of a variety of lipids as well as up to 50% mass fraction of proteins and attached hydrocarbons. Even the extreme low cases have protein contents of ≈18% (e.g., neurons where the myelin membranes function as insulation), and 75% protein contents has been reported for the mitochondrial membrane with a large amount of enzymatic activity (18). Although a pure bilayer might still be a good representation for many membrane properties, it might have serious shortcomings, in particular, for describing insertion of polar or charged amino acids. To examine this, we have constructed models that aim at mimicking biological membranes by incorporating membrane protein segments into model lipid bilayers, both with statistically controlled compositions and real proteins. Conformations were created by using multiple isolated helices and protein mass fraction in the ranges of low to high observed biological concentrations, by using both purely hydrophobic sequences and those with some polar residues to test their influence on solvation properties in the membrane. We also tested the effect of a SecY translocon structure (19) embedded in a bilayer, with the probe amino acids placed both right next to the lateral gate and 20 Å away from it.
The hydrophobic leucine and charged arginine amino acid analogs were used as test probes, based on their similar size and structure as well as the special interest in arginine solvation in bilayers. The results confirm that the protein contents has a striking effect on the solvation properties, with important implications for our view of the hydrophobicity of biological membranes, the model systems used in bilayer simulations, and, not least, membrane protein insertion and stabilization.
Results
Mixed Model Membranes and Simulations.
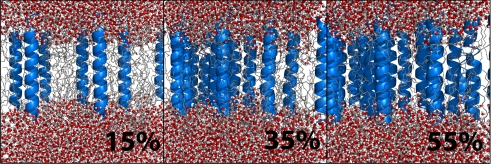
Starting from a pure POPC bilayer with 128 lipids, nine additional system types were created with between 6 and 20 extra transmembrane helices approximately evenly spaced in the system, corresponding to protein mass fractions ranging from 15% to 55% (illustrated in Fig. 1). The amino acid contents of the inserted helices was either a strictly hydrophobic polyleucine stretch or a symmetric slightly polar sequence ITMLAQVSFLFSVQALMTI. The latter sequence has an insertion cost just above neutral according to the DGpred prediction method (11) based on the Hessa in vivo results. Three examples of these model membranes are shown in Fig. 1. The SecY translocon system was prepared by solvation of the protein structure in a preequilibrated POPC membrane, as described in Methods.
Fig. 1.
Examples of three constructed membrane models with varying amounts of extra “protein” in the hydrophobic core region: 15% (Left), 35% (Center), and 55% (Right) of protein mass fraction in the transmembrane region.
The potential of mean force was calculated by constraining molecules at different positions along the membrane normal, i.e. the direction perpendicular to the membrane, as described in Methods. Free-energy profiles were determined for both arginine and leucine amino acid analogs in all types of membranes, giving a total of 44 systems. Each profile was calculated from 100 separate molecular dynamics simulations, and the total 4,400 simulations required comprised some 80 μs of simulation time.
Increasing Protein Contents Facilitates Hydrophilic Solvation.
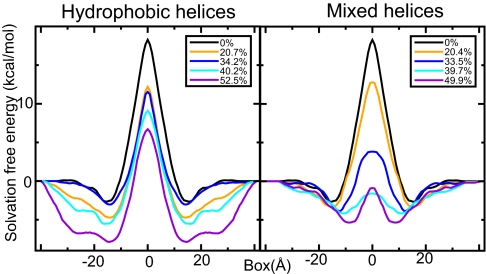
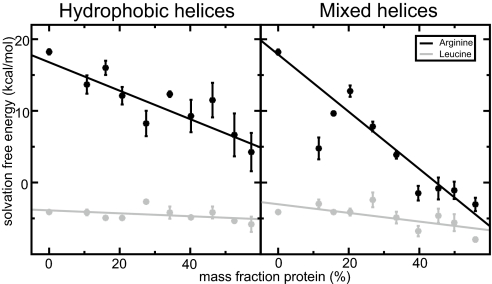
The membrane protein contents has a very clear influence on solvation properties compared with previously investigated properties such as lipid head group type, chain length, or saturation (17). Fig. 2 displays a subset of solvation free-energy profiles for a charged guanidinium ion (the arginine side-chain analog) as a function of position along the bilayer normal with hydrophobic or mixed helices added. In both cases, the insertion cost essentially drops continuously with increasing amounts of protein present in the transmembrane region. For hydrophobic polyalanine helices, the main effect appears to be a widening of the interface region (Fig. 2 Left). Because the hydrophobic helices perturb the head group hydrogen bond network, it is quite advantageous to position charged analogs in the interface region in this case, but even the peak value inside the hydrophobic core can be reduced more than a factor two. The effect is even more striking when the additional helices contain some polar residues. In this case, the cost disappears entirely already at ≈40% mass fraction, after which saturation is reached (Fig. 2 Right). Polar or charged residues of real proteins will never be subject to the peak penalty at the narrow center of the hydrophobic core, because their side chains can snorkel toward the interface region (13). Nevertheless, with the similar shapes of the profiles, it is interesting to see how this theoretical maximum insertion cost varies the membrane composition (similar profiles for leucine are available in supporting information (SI) Fig. S1). The plots in Fig. 3 illustrate the correlation between solvation cost for both analogs, with the additional helices being either hydrophobic or mixed. For arginine in systems with hydrophobic helices, there is a linear decrease with the number of inserted helices (correlation coefficient = −0.88) and the hydrophilic case shows very high correlation (correlation coefficient = −0.97) but with a saturation effect for the highest protein mass fractions. For leucine trend is uncertain for hydrophobic helices (correlation −0.42), but there might be a weak trend (−0.66) for mixed helices. It is not obvious why mixed helices facilitate leucine solvation too, but because the magnitude is quite small, it is likely a second-order effect from membrane thickness, ordering, and helix/lipid packing.
Fig. 2.
Spatially resolved free-energy profiles for a guanidinium ion (arginine analog) as a function of distance from the bilayer center along the membrane normal. Shown are the results for lipid bilayers with varying protein content of either hydrophobic (Left) or mixed (Right) helices. The higher the protein mass fraction, the lower the solvation cost. Only the central part of the membrane is shown on the x axis; the reference free-energy value goes to zero in the bulk water.
Fig. 3.
The solvation cost for arginine and leucine in the middle of the membrane as function of protein mass fraction, either using hydrophobic (Left) or mixed (Right) helices. For arginine, there is decreasing solvation cost as the amount of protein is increased with a saturation effect for the highest values in the polar case (correlation coefficients −0.97 and −0.88), and leucine does show the same trend, albeit much weaker (correlation coefficients −0.66 and −0.42).
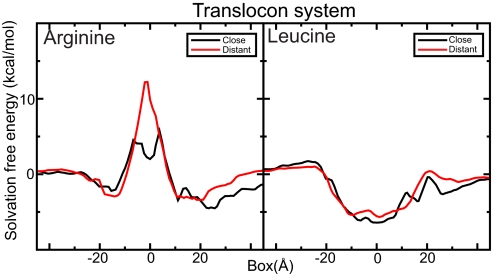
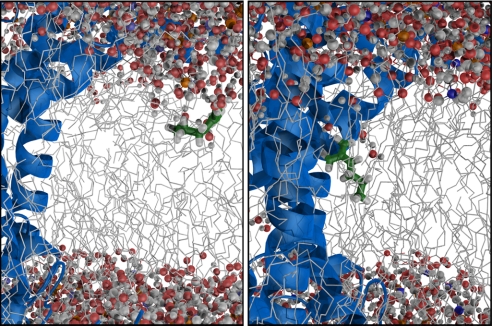
The cost of inserting arginine close to SecY is quite low. The relatively low cost of insertion is equally true when the guanidinium ion is inserted in a bilayer with just a SecY translocon structure present. Even when placed 20 Å away from the translocon lateral gate, the insertion cost is reduced to 12 kcal/mol, partly because interface helices on the side interacting with the ribosome help stabilize solvation water. Right next to the lateral gate, the cost is even lower, only 3–5 kcal/mol, close to the value obtained from the in vivo scale (2) (Fig. 4). The dip in the insertion cost in the bilayer core right outside the lateral gate is caused by local favorable hydrogen bonds between the arginine and SecY. Compared with the results for the model helices, it is interesting that the stabilizing effect does not appear to be a special property of the translocon, but a general effect due to a locally high protein concentration. Although the magnitudes are still open to debate, this could be a possible way for the translocon to provide transient stabilization of residues until all segments of a protein have been inserted into the bilayer and interact with each other instead. The leucine analog does not interact much with SecY; just as for the model helices the insertion gain is ≈4 kcal/mol both distant and close to the lateral gate (Fig. 4).
Fig. 4.
Solvation free-energy profiles in the proximity of the SecY translocon. Even at a distance of 20 Å from the lateral gate (red) the cost is significantly reduced because the protein stabilizes hydration water. Next to the lateral gate, it requires only 3–5 kcal/mol to solvate the arginine analog, close to the in vivo result. The leucine effect is limited, just as for model helices. Only the central part is shown; the full system extends to 60 Å.
Additional Helices Stabilize Water Defects.
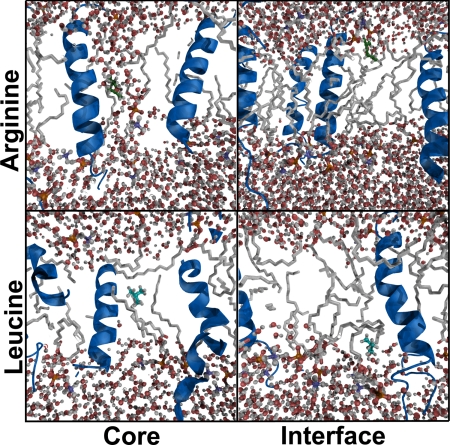
The lipid order is slightly decreased due to less efficient packing in systems with helices, but the variations between systems containing different fractions or different types of helices are relatively small (Fig. S2). Because more helical segments are present into the bilayer, there is a tendency for interfacial water to be located deeper in the interfacial region, even bordering on the normally hydrophobic core (even without any inserted test molecule). The effect can be seen for both types of tested helices, but is stronger for the mixed case. As the side chain analogs are inserted, there is a pronounced difference in the resulting bilayer distortion for leucine or arginine, as displayed in Figs. 5 and 6. When placed in the center of the hydrophobic core, arginine virtually creates a small distortion of “cavity” water. This behavior has previously been observed for arginine as part of helices in pure bilayers (13), but it carries much less penalty when the solvent molecules are already protruding deeper into the membrane and can make stabilizing electrostatic interactions with the added helices too. In contrast, the structural effect when placed in the interface region is almost negligible; in this case, the charged side chain can simply orient to reach the polar region, and the reduced cost here is mainly an effect of the interface region extending deeper. Leucine leaves the membrane largely unaffected, both when placed in the interface and the core of the membrane.
Fig. 5.
Snapshot slices of structural effects of inserting leucine/arginine in the interface or core of a membrane with additional helices. Arginine creates a cavity of retained hydration when placed in the core (stabilized by helices). The effect in the interfacial location is due mainly to facilitated snorkeling of the charged side chain. Introduction of leucine in either location leaves the membrane structure largely unaffected.
Fig. 6.
Arginine analog structure in the SecY translocon system. Even at moderate distance from the lateral gate (Left) the solvation cost is reduced by interface helices helping to stabilize the retained hydration water. Right next to the lateral gate (Right), the arginine analog can also interact directly with the protein to further reduce the solvation cost, down to 3–5 kcal/mol in this case.
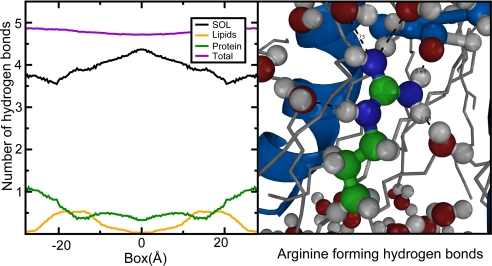
For the charged arginine analog, the ability to form hydrogen bonds appears to be a critical determinant for the solvation cost. As illustrated in Fig. 7, the total number of paired hydrogen bonds for arginine is almost constant for all positions, but the groups to which the hydrogen bonds are formed varies somewhat. The hydrogen bonds are plotted for a system with a high mass fraction of proteins, but the same results are found in all tested setups.
Fig. 7.
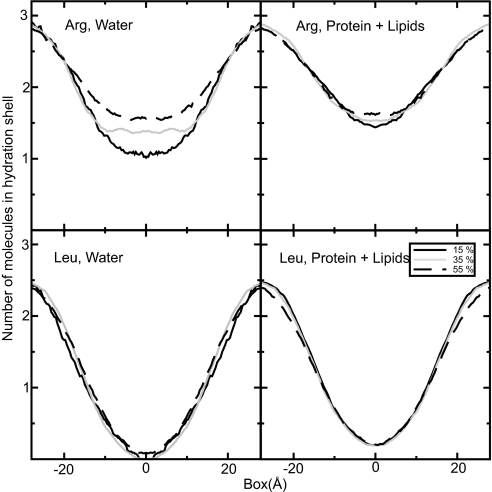
Chemical surrounding of the analogs evaluated by cumulative radial distribution functions around the analog mass center with 3-Å cutoff. (Upper) Shown is the increasing number of water molecules and the close-to-constant amount of protein and lipids surrounding arginine for different mass fractions of mixed helices. (Lower) Displayed are corresponding values for leucine. The low amount of lipids close to leucine is an effect of the almost spherical analog geometry combined with a short cutoff.
Retained Hydration Explains the Low Solvation Cost.
To further evaluate the local chemical surrounding for the amino acid analogs, cumulative radial distributions of molecules around the mass center were calculated, and different setups compared with a 3-Å cutoff. These calculations confirm the main feature that whereas leucine is dehydrated inside the membrane, arginine keeps a hydration shell even when placed in the very center of the membrane. When further identifying the different neighbor constituents, the fraction of helical proteins increases (as expected) with the mass fraction of helices in the membrane, whereas the number of lipid neighbors decreases. However, the total amount of proteins and lipids is almost constant for all setups, whereas the amount of water inside the membrane increases with higher mass fraction of protein, as illustrated for systems with mixed helices in Fig. 7. The helices thus seem to facilitate for arginine to retain its hydration by pulling in water. This is confirmed by a virtually constant number of hydrogen bonds formed by an arginine analog when placed in different positions in a membrane with 40% mass fraction protein (Fig. 8). Thus, just as for pure bilayers, the solvation cost appears to be predominantly entropic (13). Fig. 6 also shows the radial distribution around leucine, which completely lacks hydration in the membrane core, independently of the number of inserted helices. The possible decrease in solvation free energy for leucine in bilayers with high protein mass fractions could be due to a general perturbation of the membrane and the associated extra space, which makes solvation of the small leucine analog entropically more advantageous.
Fig. 8.
The number of hydrogen bonds formed by arginine as function of position in a membrane with a high fraction of proteins (Left) and a graphical illustration of the chemical surrounding for an arginine analog placed in the very middle of the membrane (Right). The groups to which the hydrogen bonds (dashed line) are formed varies, but the total number of hydrogen bonds is almost constant over all positions in the membrane.
Discussion
There is not much debate that plain hydrophobic effect must be the main driving force responsible for discriminating between helices that are membrane inserted versus translocated; few if any other processes could explain the experimental results and remarkably efficient topology prediction. However, this does not automatically imply that the interior of cellular membranes is just as hydrophobic as a pure hydrocarbon; even with a mixed hydrophobic core the membrane could still form a very effective barrier for the cell. Previous simulation studies have nevertheless seemed to confirm the high hydrophobicity, but as we have shown here, even quite normal amounts of protein contents in a bilayer will change the picture significantly and result in hydrophilic solvation penalties in the range of experimental observations. Although many membrane proteins are still stable in pure (even single-lipid species) bilayer environments such as liposomes, the in vivo insertion occurs in the ER membrane with a significant mass fraction of protein. The high fluidity of the ER membrane due to its low cholesterol content could also be an important factor to allow different inserted helices to interact with either lipids or proteins depending on their sequence composition.
Obviously, it should be kept in mind that the membranes constructed here are simplified model systems, but it is reassuring that the effect is equally present for the slightly more realistic SecY system. The actual insertion cost for a particular residue appears to depend significantly both on protein mass fraction in the membrane and the exposed residue composition of these proteins. This can be hard to predict numerically for a small simulation, but since observed experimental values are averages over large numbers of molecules these should be quite stable and reproducible. Despite these caveats, the present study clearly shows that protein contents is a critical component of membranes, and at least for polar or charged residues, it is not possible to accurately model free energy of insertion if the membrane is approximated with a pure lipid bilayer. The interactions do not have to be specific, and the effect is striking when the helices contain polar residues. It is particularly interesting to note that it is still quite strong when the membrane helices are nonpolar—even the limited interaction with the helix backbone makes it much easier for arginine side chains to be solvated in the center of the membrane. The interactions are not residue-specific but, rather, appear to be a consequence of the helices making it significantly cheaper to introduce solvation water inside the bilayer environment. Snorkeling of side chains in real helices can effectively put the charged groups of long side chains 2–3 Å closer to the surface, which reduces the cost even further. Nevertheless, one should be careful before directly translating these results to much more complex biological systems. Apart from complications such as lipid mixtures, sugars, and additional proteins, it is still not settled what the free-energy reference state really is during insertion. Although it might cause some membranes proteins to merely be kinetically rather than thermodynamically stable, features like hydrophobic regions in the ribosome or translocon could conceivably also produce results similar to the in vivo scale (15, 20).
In principle, it might be possible to confirm these results for hydrophilic solvation in membranes by performing translocon-mediated insertion in environments with different amount or composition of membrane proteins. It is, however, not straightforward because current quantitative experimental techniques rely on reconstituted rather than membranes (11), and it will therefore require some alternative approach.
Still, the simulated effect for the leucine analog is quite small, even bordering on nonsignificant. It is quite possibly a secondary effect from changes in membrane thickness and order with the extra helices included. Although it is reasonable that the addition of purely hydrophobic helices does not significantly alter the hydrophobicity of a bilayer, it does not explain why the biological Hessa scale appears as a compressed version of hydrophobic solvation. This would require the simulated leucine solvation free energy to become less advantageous with increasing protein fraction, which we do not see. Even in vivo, the effect for leucine is of much lower magnitude than the results for arginine and might possibly be explained by the complicated insertion geometry of the translocon. Any occurrence of less-hydrophobic patches in the exit gate—or channel water—would shift the reference state and likely reduce the apparent insertion for hydrophobic residues like leucine, which together with the present results, would explain the experimental observations.
Materials and Methods
System Configuration.
Starting with a hexagonal pure POPC membrane with 128 lipids and ≈6,500 waters, additional setups aimed at evaluating solvation properties as a function of protein fraction were constructed by adding transmembrane helices. To test the influence of helical amino acid composition, two different types of helices were used, both consisting of 19 central residues flanked by interfacial anchors with glycine and proline (GGPG). Hydrophobic helices contained 19 leucine residues, whereas the marginally stable ones were designed with the sequence ITMLAQVSFLFSVQALMTI. According to DGpred (11), this sequence has a slightly positive insertion cost of 1.84 kcal/mol, which is close to the 1.4-kcal/mol threshold in DGpred to predict insertion for multispanning membrane protein segments. The number of inserted helices varied between 6 and 20, resulting in protein mass fractions ranging from 15% to 55%. The translocon system was generated by embedding PDB structure 1RHZ (19) in a 256-lipid POPC bilayer. After removing overlapping molecules, the system contained 192 lipids and some 23,000 waters and was subject to 20 ns of position restrained followed by 50 ns of free equilibration.
Simulation Setup.
A similar molecular dynamics approach as has previously been thoroughly described (21) was used to calculate free-energy profiles for amino acid solvation along the membrane normal in membranes with varying mass fractions of proteins.
One hundred conformations were constructed for both arginine and leucine in every membrane setup with side-chain analogs distributed along the membrane z axis (normal to the bilayer plane). To improve performance by minimizing the system volume, hexagonal membrane boxes based on earlier simulations where used (13).
Simulations were performed for each conformation with the position of the amino acids relative to the membrane center constrained in the z direction by using LINCS (22) and the resulting force acting on the residues denoted Fconstr. The sign of this force indicates which direction the residue would like to move, and the size indicates to what extent. By integrating this set of position-dependent forces over the box length in the z direction, a likewise position-dependent potential of mean force (PMF) is obtained, V(z) = ∫z Fconstr(z)dz. These PMFs present the free-energy cost of introducing/solvating the corresponding amino acid side chain at different positions in the bilayer.
Because the model systems are symmetric membranes where the two sides of the bilayer are equivalent, observations at either side of the bilayer should be statistically identical. Our measurements for these systems were therefore symmetrized around the membrane center, both to assess accuracy and to further improve the signal-to-noise ratio, as illustrated for one setup in Fig. S3. Symmetrization was not applied to the translocon system results.
After construction, all systems were subject to 10,000 steps of steepest descent energy minimization. The z coordinate of the analogs was controlled by using position restraints of 24 kcal/mol Å, during a 3-ns stochastic dynamics equilibration simulation. After equilibration, production runs were performed for 15 ns by using stochastic dynamics with the z coordinate of the amino acid analog center of mass constrained relative to the membrane center of mass. The resulting constraint force on the amino acid was stored and used to estimate the position-dependent potential of mean force (integration of constraint forces) acting on the analog.
Lipid interactions were described with the Berger force field parameters (23), using Ryckaert–Bellemans torsions (24) for the hydrocarbon chains and nonbonded interactions parametrized to reproduce experimental area and volume per lipid accurately. This force field has been show to replicate both equilibrium and dynamical experimental properties well (25, 26) and provides higher performance than explicit-hydrogen lipids. Amino acids where modeled with the all-atom force field OPLS-AA/L (27), and standard OPLS Lorenz–Bertheholtz combination rules applied to nonbonded interactions between lipids and amino acid analogs. Because the Berger force field was derived as a modification to OPLS, this ensures reasonable compatibility while simultaneously providing the performance required for this project. This combination have previously shown to yield relatively accurate water–cyclohexane transfer free energies (28). Water molecules were represented with the SPC (simple point charge) model (29).
Simulations were performed with the GROMACS package (30). Bond lengths were constrained with the LINCS algorithms (22), whereas SETTLE (31) was used for water molecules. Twin-range cutoffs of 14 Å for the van der Waals interactions and 10 Å for electrostatic interactions calculated by PME (32) were used together with 10-Å neighbor lists updated every 10 steps. Equilibration simulations were performed at constant temperature and pressure, and production simulation was performed under constant temperature. The temperature of the system was coupled to 303 K by using the weak coupling algorithm with a time constant of τT = 0.2 ps (33). All dimensions of the simulation box were coupled independently (anisotropic scaling) to reference pressures of 1 bar with Berendsen weak coupling, a τP = 1.0 ps time constant, dispersion corrections to pressure, and a system compressibility of 4.5·10−5 bar−1 (33). During the production runs, constraint forces from the GROMACS pull code were used to keep the z distance between the center of mass of the analog and the membrane constant.
Supplementary Material
Acknowledgments.
Gunnar von Heijne is kindly acknowledged for stimulating discussions on possible membrane and translocon explanations to the helix insertion observations. This work was supported by grants from the Swedish Research Council, the Foundation for Strategic Research, and the European Research Council. Computer resources were provided by SNIC, the Swedish National Infrastructure for Computing.
Footnotes
The authors declare no conflict of interest.
This article is a PNAS Direct Submission.
This article contains supporting information online at www.pnas.org/cgi/content/full/0905394106/DCSupplemental.
References
- 1.Kyte J, Doolittle R. A simple method for displaying the hydropathic character of a protein. J Mol Biol. 1982;157:105–132. doi: 10.1016/0022-2836(82)90515-0. [DOI] [PubMed] [Google Scholar]
- 2.Hessa T, et al. Recognition of transmembrane helices by the endoplasmic reticulum translocon. Nature. 2005;433:377–381. doi: 10.1038/nature03216. [DOI] [PubMed] [Google Scholar]
- 3.Freites J, Tobias D, von Heijne G, White S. Interface connections of a transmembrane voltage sensor. Proc Natl Acad Sci USA. 2005;102:15059–15064. doi: 10.1073/pnas.0507618102. [DOI] [PMC free article] [PubMed] [Google Scholar]
- 4.Dorairaj S, Allen T. On the thermodynamic stability of a charged arginine side chain in a transmembrane helix. Proc Natl Acad Sci USA. 2007;104:4943–4948. doi: 10.1073/pnas.0610470104. [DOI] [PMC free article] [PubMed] [Google Scholar]
- 5.Jones D. Improving the accuracy of transmembrane protein topology prediction using evolutionary information. Bioinformatics. 2007;23:538–544. doi: 10.1093/bioinformatics/btl677. [DOI] [PubMed] [Google Scholar]
- 6.Ulmschneider M, Ulmschneider J, Sansom M, Di Nola A. A generalized born implicit-membrane representation compared to experimental insertion free energies. Biophys J. 2007;92:2338–2349. doi: 10.1529/biophysj.106.081810. [DOI] [PMC free article] [PubMed] [Google Scholar]
- 7.Bernsel A, et al. Prediction of membrane-protein topology from first principles. Proc Natl Acad Sci USA. 2008;105:7177–7181. doi: 10.1073/pnas.0711151105. [DOI] [PMC free article] [PubMed] [Google Scholar]
- 8.Rapoport T, Goder V, Heinrich S, Matlack K. Membrane-protein integration and the role of the translocation channel. Trends Cell Biol. 2004;14:568–575. doi: 10.1016/j.tcb.2004.09.002. [DOI] [PubMed] [Google Scholar]
- 9.Pitonzo D, Skach W. Molecular mechanisms of aquaporin biogenesis by the endoplasmic reticulum sec61 translocon. Biochim Biophys Acta. 2006;1758:976–988. doi: 10.1016/j.bbamem.2006.04.021. [DOI] [PubMed] [Google Scholar]
- 10.Long SB, Campbell EB, Mackinnon R. Crystal structure of a mammalian voltage-dependent Shaker family K+ channel. Science. 2005;309:897–903. doi: 10.1126/science.1116269. [DOI] [PubMed] [Google Scholar]
- 11.Hessa T, et al. Molecular code for transmembrane-helix recognition by the sec61 translocon. Nature. 2007;450:1026–1030. doi: 10.1038/nature06387. [DOI] [PubMed] [Google Scholar]
- 12.Radzicka A, Pedersen L, Wolfenden R. Influences of solvent water on protein folding: Free energies of solvation of cis and trans peptides are nearly identical. Biochemistry. 1988;27:4538–4541. doi: 10.1021/bi00412a047. [DOI] [PubMed] [Google Scholar]
- 13.Johansson ACV, Lindahl E. Amino-acid solvation structure in transmembrane helices from molecular dynamics simulations. Biophys J. 2006;91:4450–4463. doi: 10.1529/biophysj.106.092767. [DOI] [PMC free article] [PubMed] [Google Scholar]
- 14.MacCallum J, Bennett W, Tieleman D. Distribution of amino acids in a lipid bilayer from computer simulations. Biophys J. 2008;94:3393–3404. doi: 10.1529/biophysj.107.112805. [DOI] [PMC free article] [PubMed] [Google Scholar]
- 15.Johansson A, Lindahl E. Titratable amino acid solvation in lipid membranes as a function of protonation state. J Phys Chem B. 2009;113:245–253. doi: 10.1021/jp8048873. [DOI] [PubMed] [Google Scholar]
- 16.Vorobyov I, Li L, Allen T. Assessing atomistic and coarse-grained force fields for protein–lipid interactions: The formidable challenge of an ionizable side chain in a membrane. J Phys Chem B. 2008;112:9588–9602. doi: 10.1021/jp711492h. [DOI] [PubMed] [Google Scholar]
- 17.Johansson A, Lindahl E. The role of lipid composition for insertion and stabilization of amino acids in membranes. J Chem Phys. 2009;130:185101. doi: 10.1063/1.3129863. [DOI] [PubMed] [Google Scholar]
- 18.Guidotti G. Membrane proteins. Annu Rev Biochem. 1972;41:731–752. doi: 10.1146/annurev.bi.41.070172.003503. [DOI] [PubMed] [Google Scholar]
- 19.Van den Berg B, et al. X-ray structure of a protein-conducting channel. Nature. 2004;427:36–44. doi: 10.1038/nature02218. [DOI] [PubMed] [Google Scholar]
- 20.White SH, von Heijne G. How translocons select transmembrane helices. Annu Rev Biophys. 2008;37:23–42. doi: 10.1146/annurev.biophys.37.032807.125904. [DOI] [PubMed] [Google Scholar]
- 21.Johansson AC, Lindahl E. Position-resolved free energy of solvation for amino acids in lipid membranes from molecular dynamics simulations. Proteins. 2007;70:1332–1344. doi: 10.1002/prot.21629. [DOI] [PubMed] [Google Scholar]
- 22.Hess B, Bekker H, Berendsen HJC, Fraaije JGEM. LINCS: A linear constraint solver for molecular simulations. J Comput Chem. 1997;18:1463–1472. [Google Scholar]
- 23.Berger O, Edholm O, Jähnig F. Molecular dynamics simulation of a fluid bilayer of dipalmitoylphosphatidylcholine at full hydration, constant pressure and constant temperature. Biophys J. 1997;72:2002–2013. doi: 10.1016/S0006-3495(97)78845-3. [DOI] [PMC free article] [PubMed] [Google Scholar]
- 24.Ryckaert J, Bellemans A. Molecular dynamics of liquid n-butane near its boiling point. Chem Phys Lett. 1975;30:123–125. [Google Scholar]
- 25.Lindahl E, Edholm O. Molecular dynamics simulation of nmr relaxation rates and slow dynamics in lipid bilayers. J Chem Phys. 2001;115:4938–4950. [Google Scholar]
- 26.Benz R, Castro-Roman F, Tobias D, White S. Experimental validation of molecular dynamics simulations of lipid bilayers: A new approach. Biophys J. 2005;88:805–817. doi: 10.1529/biophysj.104.046821. [DOI] [PMC free article] [PubMed] [Google Scholar]
- 27.Kaminski GA, Friesner RA, Tirado-Rives J, Jorgensen WL. Evaluation and reparametrization of the OPLS-AA force field for proteins via comparison with accurate quantum chemical calculations on peptides. J Phys Chem B. 2001;105:6474–6487. [Google Scholar]
- 28.Tieleman D, MacCallum J, Ash W, Kandt C, Monticelli L. Membrane protein simulation with an united atom lipid and alla atom protein model: Side chain transfer free energy and model proteins. J Phys Condens Matter. 2006:1221–S1234. doi: 10.1088/0953-8984/18/28/S07. [DOI] [PubMed] [Google Scholar]
- 29.Berendsen HJC, Postma JPM, van Gunsteren WF, Hermans J. Interaction models for water in relation to protein hydration. In: Pullman B, editor. Intermolecular Forces. Dordrecht, The Netherlands: Reidel; 1981. pp. 331–342. [Google Scholar]
- 30.Lindahl E, Hess BA, van der Spoel D. GROMACS 3.0: A package for molecular simulation and trajectory analysis. J Mol Model. 2001;7:306–317. [Google Scholar]
- 31.Miyamoto S, Kollman PA. SETTLE: An analytical version of the SHAKE and RATTLE algorithms for rigid water models. J Comput Chem. 1992;13:952–962. [Google Scholar]
- 32.Essmann U, et al. A smooth particle mesh Ewald method. J Chem Phys. 1995;103:8577–8592. [Google Scholar]
- 33.Berendsen HJC, Postma JPM, DiNola A, Haak JR. Molecular dynamics with coupling to an external bath. J Chem Phys. 1984;81:3684–3690. [Google Scholar]
Associated Data
This section collects any data citations, data availability statements, or supplementary materials included in this article.


