

Abstract
Reliable information is a crucial factor influencing decision-making and, thus, fitness in all animals. A common source of information comes from inadvertent cues produced by the behavior of conspecifics. Here we use a system of experimental evolution with robots foraging in an arena containing a food source to study how communication strategies can evolve to regulate information provided by such cues. The robots could produce information by emitting blue light, which the other robots could perceive with their cameras. Over the first few generations, the robots quickly evolved to successfully locate the food, while emitting light randomly. This behavior resulted in a high intensity of light near food, which provided social information allowing other robots to more rapidly find the food. Because robots were competing for food, they were quickly selected to conceal this information. However, they never completely ceased to produce information. Detailed analyses revealed that this somewhat surprising result was due to the strength of selection on suppressing information declining concomitantly with the reduction in information content. Accordingly, a stable equilibrium with low information and considerable variation in communicative behaviors was attained by mutation selection. Because a similar coevolutionary process should be common in natural systems, this may explain why communicative strategies are so variable in many animal species.
Keywords: cues, signals, variation
Animals acquire information through trial-and-error while interacting with the physical environment (personal information) or by monitoring the behavior of conspecifics (social information) (1). Social information can be based on traits or behaviors that were selected to regulate information transmission (signals) or on cues provided inadvertently (1, 2). Cues are thought to be common sources of information in nature. Indeed, in many species, individuals have been shown to monitor each other to decide how to behave (3–9). For example, when foraging, simply observing the behavior of conspecifics can inform an animal about the location of a source of food (10, 11). In many situations, producing inadvertent cues will also affect an individual's own fitness and should thus be under selection, with the consequence that cues providing inadvertent social information should evolve into signals. Importantly, selection on inadvertent cues may frequently take the form of decreasing the social information provided. An example of this would be birds living in a roost trying to hide information from other group members about a food source they have discovered (12).
Although the evolution of signals has been extensively studied, most research has focused on signaling as an independent behavior, decoupled from its social and behavioral context (13). As a result, relatively little attention has been given to social information provided by cues and its influence on signal evolution. To address this issue we devised a system of experimental evolution with groups of competing robots (14). The robots were randomly placed in an arena containing a food and a poison source that both emitted red light. The food and poison sources were placed close to two opposite corners of the arena (Fig. 1), and robots could identify them only at a very close range by detecting different colored paper discs placed under the sources with their floor sensors. The performance of robots was increased by one point for every unit of time spent in the vicinity of food and decreased by one point when near poison. Once a robot had located the food, it could stay in its vicinity until the end of the trial, which consisted of 1,200 time units. Additionally, robots had the possibility of producing and perceiving blue light, hence potentially allowing them to transmit information on food and/or poison location. Experimental evolution was conducted in a population of 100 groups of 10 robots each using physics-based computer simulations that precisely model the dynamical properties of real robots. The specifications of the robots' neural controllers, which process sensory information and produce motor actions, were encoded in artificial genomes, each consisting of 33 “genes” (14). The genomes of the 20% of robots with the highest individual performance in the population were selected, subjected to mutation and recombination (i.e., sexual reproduction), and randomly assorted into groups of 10 robots to form the next generation (see Materials and Methods). Because the 33 genes were initially set to random values, the behavior of robots was random in the first generations. However, because of selection, the behavior of robots rapidly evolved and their performance greatly increased over the 500 generations of selection that were repeated in 20 independent selection lines [supporting information (SI) Fig. S1].
Fig. 1.

Experimental setup. (A) A food and poison source, both emitting red light, are placed 1 m from one of two opposite corners of the square (3- × 3-m) arena. Robots (small circles) can distinguish the two by sensing the color of the circles of paper placed under each source by using their floor sensors when driving over the paper. (B) The robot used for the experiments is equipped with two tracks to drive, an omnidirectional (360°) vision camera, a ring of lights used to emit blue light, and floor sensors to distinguish food and poison sources (see ref. 14 for details).
Results and Discussion
Inadvertent Information.
An inherent property of this foraging system is that blue light, even if emitted randomly, could provide inadvertent social information on food location because, in this physical setup, information is provided not only through patterns of light emission but also through the robots' behavior. Thus, once robots evolve the ability to find food and stay nearby, their increasing density near the food source should translate into higher blue density near the food and a source of information for other robots in the arena. This hypothesis was confirmed in a first experiment in which robots were constrained to produce light randomly (light was emitted with a probability of 0.5 for each unit of time). As robots became more efficient at finding and remaining near the food (Fig. S1), the concentration of blue light near food also increased such that, in all generations after generation 2, the intensity of blue light was significantly higher in the vicinity of the food than in the rest of the arena (Mann–Whitney test, df = 39, P < 0.001 for all generations). To quantify the amount of inadvertent information produced by the emission of blue light, we devised an index of information I (15–19), which varies between 0 when blue light is equally distributed in all directions relative to the direction of the food and 1 when light is always perceived in a predictable direction relative to the food (see Materials and Methods for details; see also Fig. S2). The level of information rapidly increased over the generations (Fig. 2A), and robots became significantly attracted to blue light after generation 9 (average value between generation 9 and 500: 0.2 ± 0.03, two-sided sign test, df = 19, all P < 0.001) (Fig. 2B).
Fig. 2.

Information and response to blue light. Change over generations in information content provided by blue light (i.e., the strength of the association between the direction in which robots perceived most light and the direction of the food; see Materials and Methods and Fig. S2) (A) and the response to blue light, where positive values indicate attraction and negative values indicate repulsion to blue light (see Materials and Methods) (B). Both graphs show the mean and standard error (gray bands) of the 20 independent replicates for both the random and evolved light emission experiments.
This experiment revealed that, when emitted randomly, blue light was an inadvertent cue providing information on food location. Although light production was cost-free, sharing such information should be costly because it results in higher robot density and increased competition and interference near the food (i.e., spatial constraints around the food source allowed a maximum of 8 robots of 10 to feed simultaneously and resulted in robots sometimes pushing each other away from the food). Because selection occurred at the individual level and because there is no kin structure among the 100 groups of robots, selection should favor individuals concealing information on food location (14, 20, 21). To test whether conflicts of interest between robots would affect blue light emission, we conducted a similar experiment with the difference that we allowed the rate of emission of blue light to evolve as part of the robots' behavior. In this experiment, the probability of a robot emitting blue light depended both on its genotype (i.e., the values of its genes) and the environmental stimuli perceived through its sensors (see Materials and Methods).
Evolving Light Emission.
As in the previous experiment, the robots initially produced blue light randomly (gene values were random such that the probability of light emission in any area of the arena was not different from 0.5 in the first 3 generations, two-sided sign test, df = 19, all P > 0.1) (Fig. 3A). This random emission of blue light, together with the increase over generations in the density of robots near food, resulted in a rapid increase of information, the maximum (I = 0.12) being reached at generation 16 (Fig. 2A). However, because the increased information resulted in robots crowding around the food, robots were selected to decrease the rate of blue light emission (Fig. 3A). This decrease was significantly greater near the food than elsewhere, such that after 52 generations, robots became much less likely to produce light near food than near poison (P < 0.01 in all generations after generation 52, df = 39) or elsewhere (P < 0.05 in all but one of the generations 53–500, df = 39) (Fig. 3A). Altogether, these changes in light emission strategy led to a drastic decrease in the amount of information provided by blue light intensity between generations 16 and 46 (Spearman's rank correlation test, rS = −0.997, P < 0.001) (Fig. 2A) such that, in all generations after generation 22, the level of information was significantly lower than in the experiment where blue light emission was random (all P < 0.05, df = 39) (Fig. 2A).
Fig. 3.

Light emission strategies and selection pressure. Change over generations in the frequency of light emission in different areas of the arena (see Materials and Methods) for both the experiments where light was emitted randomly and evolved (A) and selection pressure to reduce emission of light by food (see Materials and Methods) (B). Positive or negative selection pressure indicates that robots were selected to reduce or increase light emission near the food, respectively. Both graphs show mean and standard error (gray bands) of the 20 independent replicates.
Although selection was acting toward suppressing information on food location, the information content did not decrease to zero over the 500 generations of selection (Fig. 2A), resulting in robots remaining significantly attracted to blue light until generation 500 (average attraction between generations 36–500: 0.06 ± 0.01, two-sided sign test, df = 19, all P < 0.001) (Fig. 2B). This somewhat surprising result can be explained by the fact that the strength of selection on light emission strategies depends on the level of information content and the robots' response to blue light. Thus, when the information content provided by blue light intensity is high, robots should be highly attracted to blue light and there should be a relatively important fitness drop for robots emitting light near the food (i.e., strong selection pressure to reduce light emission by the food). By contrast, low information content should translate into a lower response of robots to blue light and a smaller performance reduction for robots that emit light near food (i.e., low selection pressure on reducing light by the food).
Support for suppression of information being impeded by the reduced strength of selection comes from the analysis of the response strategies of individual robots and their influence on the light emission strategies and performance over the 500 generations of selection. In both the experiments where light emission could evolve or was random, the level of attraction of robots to blue light rapidly increased during the first 36 generations of selection (Fig. 2B). However, whereas the level of attraction continued to increase when light production was random, it significantly decreased between generations 36 and 200 (rS = −0.8, P < 0.001) (Fig. 2B) in the experiment where the emission of light could evolve. This decrease in attraction to blue light, which resulted from the decrease in information content that occurred after generation 16 in this experiment (Fig. 2A), has important implications because the strength of selection on reducing the emission of light by food was positively correlated with the response of robots to blue light (rS = 0.13 ± 0.13; correlation significant in 11 of the 20 selection lines) (Figs. 2B and 3B). Thus, the reduced response to blue light after generation 36 led to weaker selection on reducing light emission by food (Fig. 3B) and a stable level of information being reached by mutation-selection after ≈50–100 generations (Fig. 2).
To test whether the stable level of production and attraction to light was affected by the mutation rate, we conducted an additional experiment with the only difference that between generations 250 and 500 we used a 100-fold lower mutation and crossing-over rate (mutation rate of 0.001 per locus instead of 0.1; cross-over rate of 0.002 instead of 0.2).* The reduction resulted in a 33% decrease in the frequency of signaling near food (over the last 10 generations, mean ± SD: 0.08 ± 0.24 instead of 0.12 ± 0.1; Mann–Whitney test, df = 39, P < 0.001). Interestingly, however, the reduced emission of blue light near food did not translate into a decrease in the level of information (df = 39, P = 0.48) nor a decrease in attraction to blue light (df = 39, P = 0.36), because the decreased mutation rate also led to an increase in the average foraging efficiency of robots and thus a higher concentration of robots near food (0.91 ± 0.01 compared to 0.83 ± 0.01 with the regular rates, df = 39, P < 0.001). In other words, the lower rate of signaling combined with a higher concentration of robots at the food nevertheless generated a sufficient amount of information for the robots to remain equally attracted to blue light.
Within-Population Variation.
An important consequence of the reduced selection pressure on light emission is that, at equilibrium, there was considerable individual variation in both the production and response to light (Fig. 4). Although the majority (61.5%) of the robots never emitted light near food in the last 10 generations, there was high variation in light emission strategies with 11.2% of the robots emitting light over 50% of the time when near food (Fig. 4A). Similarly, the level of attraction of robots greatly varied with most robots exhibiting a low attraction to blue light, but 32.6% showing a negative attraction (i.e., repulsion) to blue light and 36.1% an attraction more than twice higher than the average (Fig. 4B). Furthermore, the within-population variance in attraction of robots to blue light was significantly higher in the last 10 generations where blue light production could evolve (0.15 ± 0.02) than when it was random (0.13 ± 0.01, df = 39, all P < 0.01).
Fig. 4.

Variation in communicative strategies. (A) Histograms of the frequency of blue light emission near the food. (B) The response to blue light of the 1,000 robots in each of the last 10 generations in all 20 independent replicates (200,000 robots in total) of the experiment where light emission was evolved. Positive response values reflect attraction to blue light and negative responses reflect repulsion. The vertical line marks the level at which robots exhibit no positive or negative response to blue light.
These findings are interesting with regard to the discrepancy between theoretical predictions and previous empirical studies on the association between the strength of selection and phenotypic diversity. Although theory suggests that lower selection and genetic drift should lead to higher within-population variation (21–23), empirical studies failed to support this prediction (24). However, a problem with these empirical studies is that the strength of selection is assessed indirectly, for example by assuming greater selection on life-history traits than morphological traits (24). In our experiments, robots exhibited greater phenotypic variability in their response to blue light when light emission could evolve (i.e., when the level of information and strength of selection were low) than when light emission was fixed (i.e., when robots emitted light randomly, such that the level of information and strength of selection were higher). This finding is in line with theoretical predictions and supports the view that more controlled experiments are needed in studies with real organisms.
The Evolution of Cues into Signals.
The complex dynamics between suppression of social information and selection pressure described in this study are likely to be general features of natural systems in which cues evolve into signals. When there are conflicts of interest between interacting individuals, those producing cues providing useful information to others should be selected to hide the information by interfering on the channel that carries the cue, thus resulting in signals carrying little information (25, 26). However, complete information suppression might never be achieved, because a reduction in information will simultaneously reduce selection pressure on information reduction, resulting in a stable equilibrium, where information is not completely suppressed. Moreover, there might be constraints making some cues more difficult to suppress. For example, when a small nocturnal rodent moves on the forest floor, the sound emitted by brushing against the substrate provides a cue for an avian predator to detect it. Clearly, it will be impossible for the rodent to move without making any noise. However, by altering the way the rodent moves or by inducing it to avoid some noisy substrates, natural selection can act to decrease the information provided to the predator. In the same way, it is likely that all inadvertent cues are to some extent subject to natural selection with a continuum to the degree by which the effect of natural selection is hindered by morphological, physiological, or behavioral constraints.
In addition, our results suggest that considerable phenotypic variation within populations will be present at equilibrium when the degree of selection on communication strategies is weak. The magnitude of this variation should depend on the rate of mutation and complexity of the genetic architecture (27). Thus, considerable variation is to be expected in communication systems that rely on complex traits driven by many genes and a complex brain circuitry. Several empirical studies indeed report higher than expected intrapopulation variation in signaling strategies when interests between parties conflict (28–32). For example, the great amount of polymorphism in the cryptic coloration in moths has fascinated naturalists for centuries, but explanations have remained elusive (32).
Finally, our study also underscores the importance of considering the coupling between communication and behavioral effects when studying communication systems (33), which is rarely taken into account in current analytical and game-theoretical models (34, 35). Evolutionary robotic systems implicitly encompass many behavioral components, such as the inadvertent production of information through foraging behavior, thus allowing for an unbiased investigation of the factors driving signal evolution. Moreover, the use of accurate robotic simulations is advantageous because it simultaneously preserves the mechanistic properties of hardware robotic models and allows one to conduct experimental evolution in large populations over many generations. The great degree of realism provided by evolutionary robotic systems thus provides a powerful tool for studies that cannot readily be performed with real organisms.
Materials and Methods
Experimental Setup and Artificial Evolution.
Each robot was equipped with two tracks that could rotate independently, a 360° camera, a ring around its body that could light up in blue, floor sensors to detect food and poison, and a neural controller that determined its behavior. The neural controller consisted of 11 input neurons connected to 3 output neurons through 33 “synaptic weights.” At each time-step, the values perceived by the robot's sensors (i.e., the amount of blue and red light perceived by its camera and whether it detected that it was on food or poison) were used to activate the 11 input neurons. The activation of the 3 output neurons (whose values were used to set the speeds of the robot's two tracks and to emit blue light) was then computed by multiplying each of the values of the input neurons by the corresponding synaptic weight. These 33 synaptic weights were each encoded by one a gene consisting of 8 bits representing a value in the range [−1, 1]. The genome of a robot (i.e., the 33 genes encoding the values of the 33 synaptic weights) thus determined how it would react to given sensory stimuli (see ref. 14 for more details on the robot hardware, its behavior, and the experimental setup). The performance of all robots was evaluated during 10 trials conducted on the same group of 10 robots. At the end of each generation, the 1,000 individuals in the population were ranked according to their performance and the best 20% were selected. From these 200 best individuals, individuals were randomly chosen and assorted in pairs to perform cross-overs (with a probability of 0.2) and mutations (with a probability of 0.01 for each of the genome's 264 bits) to create a new generation of 1,000 individuals.
Behavioral Analysis.
The behavior of evolved robots was analyzed by quantifying the frequency of blue light emission in different areas of the arena, how much information blue light intensity provided about food location, and how the robots responded to blue light.
The frequency of light emission so when in the vicinity of object o, where o ∈ O = {f, p, n} (f stands for food, p for poison, and n for elsewhere in the arena), was computed as the mean number of time-steps to robots spent emitting light in the vicinity of object o divided by the mean number of time-steps they spent in the vicinity of o. A robot was considered in the vicinity of food or poison if it was touching the paper disc placed under the food or poison. Otherwise, the robot was counted as being elsewhere in the foraging arena. Accordingly, the concentration of blue light ŝo in the three areas o of the arena was computed as
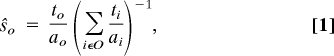 |
where ao is the proportion of the space of the arena occupied by object o (af = ap = 0.024, an = 0.953).
To quantify the information content transmitted by blue light, we analyzed the inputs of each robot's omnidirectional visual system to establish whether robots perceived more blue light in the direction of the food. This calculation was done by (i) ranking the four quadrants of the robot's visual system by the amount of light perceived at each time-step until the robot reached the food (i.e., the quadrant with the largest amount of blue light was assigned rank q = 1, etc., where q ∈ Q = {1, 2, 3, 4}) and (ii) computing the ratios pq of time-steps where the food was located in each of the four quadrant ranks q (Fig. S2).
The amount of information on food location provided by blue light emission was then calculated using the Shannon entropy (15) (uncertainty) of the probability distribution X = {p1, p2, p3, p4} using the following equation:
This entropy value H ranges from Hmin = H(Xmin) = 0, when there is no uncertainty on food location (e.g., blue light is perceived only in the direction of the food, Xmin = {1, 0, 0, 0}) to Hmax = H(Xmax) = 1.39, when uncertainty on the location of food is maximal, (i.e., there is no association between blue light intensity and food location, Xmax = {0.25, 0.25, 0.25, 0.25}). Accordingly, the information content I is defined as the difference between the maximum entropy Hmax and entropy H(X), normalized by Hmax, thus yielding values of I between 0 (when the intensity of blue light provides no information of the location of the food source) and 1 (when the intensity of blue light perceived provides perfect information on the location of the food source at all time-steps):
The level of response to blue light b was measured by placing each robot at a distance of x = 35 cm and y = 35 cm from a second stationary robot emitting blue light and recording the position of the moving robot relative to its original position after 10 time-steps. A decrease in both dimensions (x < 35 and y < 35) was considered to be attraction, and an increase in both dimensions (x > 35 and y > 35) was considered to be repulsion, whereas other outcomes were not considered (see Fig. S3). This test was performed N times for each robot, and the response b to blue light was calculated as
where i is the number of attractions and j the number of repulsions. Ten replicates (N = 10) were used to generate the data in Fig. 2B, and 100 replicates (N = 100) were used to generate the histogram in Fig. 4B.
To compare blue light emission frequencies s, the information I on food location and the response to blue light b between experiments, we calculated the mean values of the 1,000 individuals in each generation for each of the 20 independent replicates. These 20 values per generation were used to describe data (mean ± standard deviation) and were compared with nonparametric (Mann–Whitney or Kolmogorov–Smirnov) tests because some of the data did not follow a normal distribution.
The within-population variance in light emission and behavioral response strategies were computed for each of the 20 replicates by taking the average of the standard deviations in the population in each of the last 10 generations. Nonparametric (Mann–Whitney) tests were used to compare the resulting 20 values across experiments.
Acknowledgments.
We thank Carlos Botero, Redouan Bshary, Michel Chapuisat, Philippe Christe, Raghavendra Gadagkar, Tadeusz Kawecki, Karen Parker, Heinz Richner, Alexandre Roulin, Claus Wedekind, Franjo Weissing, Steffen Wischmann, Jonathan Yearsley, and three anonymous reviewers for comments on the manuscript. This work was supported by the ECAgents project founded by the Future and Emerging Technologies program of the European Community under European Union Research and Development Contract IST-2003-1940 and by the Swiss National Science Foundation.
Footnotes
The authors declare no conflict of interest.
This article is a PNAS Direct Submission.
This article contains supporting information online at www.pnas.org/cgi/content/full/0903152106/DCSupplemental.
Because the lower mutation and cross-over probabilities in the new treatment did not sustain sufficient diversity in the population to evolve good foraging behaviors (e.g., driving toward red light) in the initial generations, we used different mutation and crossing rates only after generation 250.
References
- 1.Danchin E, Giraldeau L-A, Valone TJ, Wagner RH. Public information: From nosy neighbors to cultural evolution. Science. 2004;305:487–491. doi: 10.1126/science.1098254. [DOI] [PubMed] [Google Scholar]
- 2.Maynard Smith J, Harper D. Animal Signals. Oxford: Oxford Univ Press; 2003. [Google Scholar]
- 3.Dall SRX, Giraldeau L-A, Olsson O, McNamara JM, Stephens DW. Information and its use by animals in evolutionary ecology. Trends Ecol Evol. 2005;20:187–193. doi: 10.1016/j.tree.2005.01.010. [DOI] [PubMed] [Google Scholar]
- 4.Giraldeau L-A. In: Behavioural Ecology: An Evolutionary Approach. Krebs JR, Davies NB, editors. Oxford: Blackwell; 1997. pp. 42–68. [Google Scholar]
- 5.Franks NR. In: Information Processing in Social Insects. Detrain C, Deneubourg JL, Pasteels JM, editors. Basel, Switzerland: Birkhäuser; 1999. pp. 101–114. [Google Scholar]
- 6.Bshary R, Grutter AS. Image scoring and cooperation in a cleaner fish mutualism. Nature. 2006;441:975–978. doi: 10.1038/nature04755. [DOI] [PubMed] [Google Scholar]
- 7.Tibbetts EA, Dale JA. A socially enforced signal of quality in a paper wasp. Nature. 2004;432:218–222. doi: 10.1038/nature02949. [DOI] [PubMed] [Google Scholar]
- 8.Shuker DM, West SA. Information constraints and the precision of adaptation: Sex ratio manipulation in wasps. Proc Natl Acad Sci USA. 2004;101:10363–10367. doi: 10.1073/pnas.0308034101. [DOI] [PMC free article] [PubMed] [Google Scholar]
- 9.West SA, Herre EA, Sheldon BC. The benefits of allocating sex. Science. 2000;290:288–290. doi: 10.1126/science.290.5490.288. [DOI] [PubMed] [Google Scholar]
- 10.Galef BG, Giraldeau LA. Social influences on foraging in vertebrates: Causal mechanisms and adaptive functions. Anim Behav. 2001;61:3–15. doi: 10.1006/anbe.2000.1557. [DOI] [PubMed] [Google Scholar]
- 11.Buckley NJ. Spatial-concentration effects and the importance of local enhancement in the evolution of colonial breeding in seabirds. Am Nat. 1997;149:1091–1112. doi: 10.1086/286040. [DOI] [PubMed] [Google Scholar]
- 12.Bugnyar T, Kotrschal K. Observational learning and the raiding of food caches in ravens, Corvus corax: Is it “tactical” deception? Anim Behav. 2002;64:185–195. [Google Scholar]
- 13.Searcy WA, Nowicki S. The Evolution of Animal Communication: Reliability and Deception in Signaling Systems. Princeton: Princeton Univ Press; 2005. [Google Scholar]
- 14.Floreano D, Mitri S, Magnenat S, Keller L. Evolutionary conditions for the emergence of communication in robots. Curr Biol. 2007;17:514–519. doi: 10.1016/j.cub.2007.01.058. [DOI] [PubMed] [Google Scholar]
- 15.Shannon CE. A mathematical theory of communication. Bell System Tech J. 1948;27:379–423. 623–656. [Google Scholar]
- 16.Wilson EO. Sociobiology: The New Synthesis. Cambridge, MA: Belknap; 1975. [Google Scholar]
- 17.Wilson EO. Chemical communication among workers of the fire ant Solenopsis saevissima (Fr. Smith) 2. An information analysis of the odour trail. Anim Behav. 1962;10:148–158. [Google Scholar]
- 18.Haldane JBS, Spurway HA. A statistical analysis of communication in Apis mellifera and a comparison with communication in other animals. Insectes Sociaux. 1954;1:247–283. [Google Scholar]
- 19.Harms WF. What is information? Three concepts. Biol Theory. 2006;1:230–242. [Google Scholar]
- 20.Hamilton WD. The genetical evolution of social behaviour. J Theor Biol. 1964;7:1–16. 17–52. doi: 10.1016/0022-5193(64)90038-4. [DOI] [PubMed] [Google Scholar]
- 21.Fisher RA. The Genetical Theory of Natural Selection. New York: Dover; 1958. [Google Scholar]
- 22.Falconer DS. Introduction to Quantitative Genetics. New York: Longman; 1981. [Google Scholar]
- 23.Lynch M, Hill WG. Phenotypic evolution by neutral mutation. Evolution. 1986;40:915–935. doi: 10.1111/j.1558-5646.1986.tb00561.x. [DOI] [PubMed] [Google Scholar]
- 24.Houle D. Comparing evolvability and variability of quantitative traits. Genetics. 1992;130:195–204. doi: 10.1093/genetics/130.1.195. [DOI] [PMC free article] [PubMed] [Google Scholar]
- 25.Wiley RH. In: Animal Behaviour: Communication. Halliday TR, Slater PJB, editors. Vol 2. Oxford: Blackwell; 1983. pp. 156–189. [Google Scholar]
- 26.Hasson O. Cheating signals. J Theor Biol. 1994;167:223–238. [Google Scholar]
- 27.Lande R. The maintenance of genetic variability by mutation in a polygenic character with linked loci. Gen Res. 1976;26:221–235. doi: 10.1017/s0016672300016037. [DOI] [PubMed] [Google Scholar]
- 28.Dewitt TJ, Sih A, Hucko JA. Trait compensation and cospecialization in a freshwater snail: Size, shape and antipredator behaviour. Anim Behav. 1999;58:397–407. doi: 10.1006/anbe.1999.1158. [DOI] [PubMed] [Google Scholar]
- 29.Bond AB, Kamil AC. Visual predators select for crypticity and polymorphism in virtual prey. Nature. 2002;415:609–613. doi: 10.1038/415609a. [DOI] [PubMed] [Google Scholar]
- 30.Poulton EB. The Colour of Animals: Their Meaning and Use, Especially Considered in the Case of Insects. New York: Appleton; 1890. [Google Scholar]
- 31.Whiteley DAA, Owen DF, Smith DAS. Massive polymorphism and natural selection in Donacilla cornea (Poli, 1791) (Bivalvia Mesodesmatidae) Biol J Linn Soc. 1997;62:475–494. [Google Scholar]
- 32.Bond AB. The evolution of color polymorphism: Crypticity, searching images, and apostatic selection. Annu Rev Ecol. 2007;38:489–514. [Google Scholar]
- 33.Pfeifer R, Lungarella M, Iida F. Self-organization, embodiment, and biologically inspired robotics. Science. 2007;318:1088–1093. doi: 10.1126/science.1145803. [DOI] [PubMed] [Google Scholar]
- 34.Johnstone RA. Efficacy and honesty in communication between relatives. Am Nat. 1998;152:45–58. doi: 10.1086/286148. [DOI] [PubMed] [Google Scholar]
- 35.Rowell JT, Ellner SP, Reeve HK. Why animals lie: How dishonesty and belief can coexist in a signaling system. Am Nat. 2006;168:E180–E204. doi: 10.1086/508809. [DOI] [PubMed] [Google Scholar]