

Abstract
Mutations in the Plasmodium falciparum pfcrt gene cause resistance to the 4 – amino quinoline chloroquine (CQ) and other antimalarial drugs. Mutations and/or overexpression of a P. falciparum multidrug resistance gene homologue (pfmdr1) may further modify or tailor the degree of quinoline drug resistance. Recently (M.T. Ferdig et al., Molecular Microbiology 52: 985–997 [2004]) QTL analysis further implicated a region of P. falciparum chromosome 13 as a partner (with pfcrt) in conferring resistance to the first quinoline – based antimalarial drug, quinine (QN). Since QN resistance (QNR) and CQR are often (but not always) observed together in parasite strains, since elevated cytosolic pH is frequently (but not always) found in CQR parasites, and since the chr 13 segment linked to QNR prominently harbors a gene encoding what appears to be a P. falciparum Na+/H+ exchanger (PfNHE), we have systematically measured cytosolic pH and PfNHE activity for an extended series of parasite strains used in the QTL analysis. Altered PfNHE activity does not correlate with CQR as previously proposed, but significantly elevated PfNHE activity is found for strains with high levels of QNR, regardless their CQR status. We propose that either an elevated pHcyt or a higher vacuolar pH – to – cytosolic pH gradient contributes to one common route to malarial QNR that is also characterized by recently defined chr 13 – chr 9 pairwise interactions. Based on sequence analysis we propose a model whereby observed polymorphisms in PfNHE may lead to altered Na+/H+ set point regulation in QNR parasites.
INTRODUCTION
Antimalarial drug resistance greatly impairs control of malaria (1, 2). Historically, quinolines such as chloroquine (CQ1), mefloquine (MQ), amodiaquine (AQ) and the isomers quinine (QN) and quinidine (QD) have been the most widely used class of antimalarial drugs, with oral CQ being the preferred therapy. However, CQ resistance (CQR) in P. falciparum malaria now greatly limits use of the drug. CQR is caused by mutations in a digestive vacuolar membrane protein, PfCRT (3, 4). Various patterns of PfCRT mutations found around the globe may confer variable patterns of resistance to CQ and related quinoline – based drugs, but does not explain “multidrug resistance” (MDR) for many strains and isolates (5). It is becoming increasingly clear that additional genetic events are required to create MDR malaria (meaning, simultaneous resistance to multiple pharmacophores), and perhaps even malaria resistant to multiple closely related quinolines (“quinoline resistance” or QR2). Due to widespread CQR, QN has reemerged as an important antimalarial drug. While the failure of QN to treat severe and complicated malaria in vivo is rare (6), evidence of reduced P. falciparum susceptibility to the drug in vivo as well as QNR concomitant with CQR in vitro are cause for concern (1, 7 – 9).
One such additional genetic event may be mutation and/or over expression of the Pgp homologue PfMDR1 (5), but the data are somewhat controversial. Regardless, based on available data such a contribution would not fully explain QR or MDR patterns in many strains. Another genetic event appears to involve one or more genes encoded by a segment of chr 13 which appears to be involved in promoting high level QNR via one of two possible genetically defined pathways (10). This fragment contains a number of hypothetical genes encoding hypothetical proteins with unclear or no homology to known proteins, however, it also encodes homologues to a well known V type ATPase subunit and to the family of Na+/H+ exchanger (NHE) proteins. Perhaps not coincidentally, these proteins are involved in trans membrane pH regulation, and a number of changes in digestive vacuolar pH (pHDV) and cytosolic pH (pHcyt), as well as parameters linked to vacuolar pH such as vacuolar Ca++ and volume, have been reported for QR or MDR malaria (11 – 14).
The QNR associated chr 13 locus was recently isolated (10) by subjecting the progeny of a P. falciparum genetic cross (15) to genome-wide scans for quantitative trait loci (QTL). In addition to finding additive QTLs on chromosomes 7 and 5 as expected (the identified fragments contain pfcrt and pfmdr1 respectively) these investigators found a strong (but not perfect) association between QNR and a fragment of chr 13. Pairwise effects were detected between this chr 13 fragment and an additional locus on chr 9. Of the potential genes found within chr 13, one encodes a putative Na+/H+ exchanger, pfnhe-1. The encoded PfNHE protein is 1920 aa in length with 12 predicted transmembrane segments and a signal peptide cleavage site (10,16). It is the second largest eukaryotic NHE yet identified (surpassed only by a NHE for the related apicomplexan T. gondii), and has a number of additional unusual features. Polymorphisms that led to variable DNNND repeat units in the predicted PfNHE protein sequence were found in progeny of the Dd2 × HB3 cross as well as a range of field isolates and additional laboratory strains showing variable QNR.
Ginsburg and colleagues provided the first functional evidence for a NHE activity in P. falciparum and suggested that its primary role was the removal of the increased cytosolic acid burden caused by anaerobic glycolysis (17). Prior to the availability of the P. falciparum genome (which facilitated identification of pfnhe) Lanzer and colleagues suggested that the cg2 gene found close by pfcrt on Pf chr 7 encoded this NHE activity (18). These workers suggested that mutations in cg2 altered NHE activity and pHcyt and caused CQR by a combination of effects including direct transport of CQ (19). These conclusions were strongly disputed, since the encoded CG2 protein is actually peri vacuolar (20), not plasma membrane localized, since a different chr 7 gene (now called pfcrt) was subsequently found to cause CQR (3) and because the putative CG2 - NHE homology (18) was based on sequence analysis that did not account for very high AT content in malarial genes (21).
Regardless, in our hands single cell photometry (SCP) analysis of pHcyt for intra erythrocytic parasites under continuous physiologic perfusion did indeed show elevated pHcyt for some CQR parasites (22), but not all (3,4). A corollary suggested early on (4) is that the relative size of the net cytosolic – digestive vacuolar (DV) pH gradient might be a more important parameter for CQR or QR, rather than steady state pHcyt or pHDV values alone. Overall, a range of pH phenomena and genetic changes consistent with perturbations in pH regulation have been associated with QR, but the precise contributions of pHcyt to CQR vs. QNR vs. QR remain unclear (11 – 14, 18 – 24).
In this study, we first optimize localization of the ratiometric pH probe BCECF exclusively to the parasite cytosol to avoid confusion related to operator dependent definition of ROIs. We use nigericin – BSA “pH clamping” techniques to set parasite pHcyt at uniform values before quantifying NHE activity for Dd2/HB3 cross progeny with a range of chr 5, 6, 7, 9, and 13 inheritance patterns. We measure cytosolic buffering capacity at a range of pHcyt using ammonium pulse, and quantify recovery of pHcyt after acid pulse that is either Na+-dependent or Na+ independent. We find that elevated pHcyt is well correlated with increased PfNHE activity and also associated with high level QNR due to chr 9,13 loci (but not necessarily QNR associated with chr 5, 6 loci). We thus suggest there are at least two physiological signatures for QNR that segregate with the different genetic descriptions. We propose a biochemical model that may explain chr 13 – chr 9 pairwise effects on pHcyt, PfNHE, and QNR.
MATERIALS & METHODS
Materials
BCECF - AM (2′,7′-bis-(2-carboxyethyl) -5-(and-6)-carboxyfluorescein, acetoxymethyl ester) was obtained from Invitrogen. CCCP (carbonyl cyanide 3-chlorophenylhydrazone) and all other reagents were purchased from Sigma and were reagent grade or better.
Methods
Cell culture
Dd2 (CQR), HBS (CQS) and progeny from their cross were cultured using standard techniques at 2% hematocrit in phenol-red free RPMI-1640 (Sigma R8755) supplemented with NaHCO3 (23.8 mM), D-glucose (10 mM), hypoxanthine (730 uM), HEPES (25 mM), gentamicin sulfate (20 μg/ml), and serum (10%). Cultures were routinely triply synchronized with sorbitol (5% w/v) as described in detail elsewhere (13).
Saponin permeabilization
All experiments in this study were performed on synchronized trophozoites (26–30 hours post invasion) selectively permeabilized with saponin as described in Results and elsewhere (13). In our hands, extended treatment with 0.05% (w/v) saponin is too harsh for our applications and can result in isolated (extra – RBC) parasites unable to maintain proper pH gradients when placed in buffers of various pH with no ionophore (13). Shorter exposures with less saponin were investigated. For most experiments in Results, 1 ml of fresh culture was washed three times with serum free medium and the resulting 20 μL pellet was resuspended in 200 μL of the same with 0.03% (w/v) saponin. The solution was gently shaken and allowed to incubate for exactly 3 min. The cells were then washed three times, placed onto poly-lysine coated coverslips and placed back into tissue culture conditions, or immediately perfused with physiologically buffered perfusate as described in detail elsewhere (11, 12). Parasites treated in this manner maintained proper pH gradients as described in detail elsewhere (13).
Single Cell Photometry (SCP) and Confocal Microscopy
SCP experiments were performed as described in detail previously (11,13) using a custom microscopy system comprised of a Nikon Diaphot microscope, Photometrics Sensys 12 bit CCD camera, associated optics, custom perfusion cells and custom dynamic thresholding software. Confocal images were acquired as previously described (13) using a customized spinning disk confocal microscope.
Cytosolic pH measurements
Steady – state cytosolic pH (pHcyt) of the parasites was measured using the ratiometric pH-sensitive probe BCECF – AM essentially as described elsewhere (25). Cells were incubated with 5 μM BCECF - AM for 10 min under standard tissue culture conditions. For SCP measurements the coverslip was then perfused with physiologically relevant buffer (Buffer A; c.f. Table 1) balanced with 5% CO2 for approximately 3 min. The ratiometric BCECF response for individual cells was recorded, and then immediately calibrated for each individual cell by rapidly changing to perfusate of known pH (7.00, 7.40 and 7.80) and containing 10 μM CCCP. The ratios obtained under physiologic perfusion were then converted to pH using the calibration curves obtained for each cell (11, 25).
Table I.
Composition of various buffers used in this work (mM), see Methods.
| Solution | Name | NaCl | NMDG-Cl | KCl | MgSO4 | CaCl2 | NaHCO3 | glucose | HEPES | MES | NH4Cl | pH |
|---|---|---|---|---|---|---|---|---|---|---|---|---|
| A | HBSS | 137 | 0 | 5.4 | 0.8 | 1.3 | 23.8 | 10 | 0 | 0 | 0 | 7.4 |
| B | HBS -Na+ | 0 | 137 | 5.4 | 0.8 | 1.3 | 0 | 10 | 25 | 0 | 0 | 7.4 |
| C | MBS-Na+ | 0 | 137 | 5.4 | 0.8 | 1.3 | 0 | 10 | 0 | 25 | 0 | 6.2–7.0 |
| D | MBS-Na+, +BSA | 0 | 137 | 5.4 | 0.8 | 1.3 | 0 | 10 | 0 | 25 | 0 | 6.2–7.0 |
| E | HBS + Na+ | 137 | 0 | 5.4 | 0.8 | 1.3 | 0 | 10 | 25 | 0 | 0 | 7.4 |
| F | MBS + NH4Cl | 0 | 112 | 5.4 | 0.8 | 1.3 | 0 | 10 | 0 | 25 | 25 | 6.2–7.0 |
Buffering capacity (ßi) and PfNHE activity
No previous studies of PfNHE activity have used cytosolic pH clamping techniques to uniformly initiate NHE at defined pHcyt, and instead have relied on weak base prepulse techniques. With one exception (17) they have made assumptions regarding cytosolic buffering capacity without measuring it at relevant pHcyt, and the number of strains examined has been rather limited. Also, localization of pH probes exclusively to the cytosol has not been done, and culture synchronization and physiologic perfusion conditions have not been uniformly applied.
We first attempted to measure NHE activity using the ammonium chloride prepulse technique as described (26), but with little success. Specifically, after NH4+ washout significant acidification was not stable, even after intracellular Na+ depletion and continued perfusion in the absence of Na+. To test whether this was due to the presence of a NH4+ transport pathway (the Roos – Boron pre pulse technique (26) requires that preloaded NH4+ rapidly exit as NH3, not as NH4+, thus leaving H+ behind) several other simple organic weak bases were used, but with unimpressive results (data not shown). We suspect a simple organic cation transport pathway exists for the parasite plasma membrane, as also recently proposed by Kirk and colleagues (27). To circumvent this problem, the BSA – nigericin pHcyt clamping method was used (28), with some modifications. Cells were first perfused with physiologically relevant buffer (Buffer A; Table 1) for 3 minutes, switched to buffer containing 0.8 μM nigericin and no Na+ at pH 7.4 (Buffer B), then to a similar buffer at varying pH (Buffer C). Perfusion with these buffers accomplishes two things: first, they allow for single cell calibration of the ratiometric signal, second they equilibrate pHcyt to pH of the perfusate. To “lock” pHcyt at the desired value, Buffer D harboring BSA to scavenge nigericin was introduced. For buffering capacity measurements, 25 mM NH4Cl was introduced for each pHcyt at 6.20, 6.40, 6.60, 6.80 and 7.00. Buffering capacity was then calculated by dividing the change in [NH4+]i by the virtually instantaneous corresponding change in pHcyt as described (26).
Rates of alkalinization due to Na+ influx (NHE activity) were obtained by returning physiologic buffer with or without sodium (Buffers E and B, respectively) after the BSA treatment. The difference in the two responses was subtracted and the rate of Na+-dependent, EIPA – inhibitable (see Results) recovery of pHcyt (NHE activity) was calculated. Rate in ΔpH/sec was multiplied by the relevant ßi obtained at the same initial pHcyt to obtain NHE activity as mmoles H+/[L (sec) ].
RESULTS
As discussed above, there are considerable differences in technique and interpretation in previously published studies of P. falciparum pHcyt and Na+/H+ exchanger activity (14,17,19,23,24). We suspected that major contributions to this lack of consensus are likely the different ways in which pH responsive probe (typically, BCECF) have been loaded into infected RBC (iRBC), as well as the various digital subtraction and calibration approaches used to cull parasite pHcyt data from BCECF signal clearly visible elsewhere in the iRBC for some of these studies. For example, Wunsch et al stained iRBC with BCECF – AM, imaged the dye via single cell photometry (SCP) and subtracted ROIs well defined in a x, y sense to separate parasite cytosolic BCECF response from RBC cytosolic (14). SCP has excellent x, y resolution, but does not resolve fluorescence in the z axis sense, rather, it collects all fluorescence emitted within a cone that extends well above the glass coverslip holding the imaged cells. In constrast, laser scanning confocal microscopy (LSCM) collects single “z slices” that report fluorescence from individual z axis positions of about 0.2 – 0.3 μm thickness. In SCP studies, it may not be clear from which (or how many) z positions the fluorescence originates, unless probe localization is further tested by LSCM. Furthermore, addition of fluorescence from multiple z positions (which is ostensibly what occurs for SCP) can mask true probe localization in a x,y sense.
Figure 1(A – E) shows x, y and z BCECF localization for cells treated as in (14). Fig. 1A– C are individual “z slices” from a SDCM “z stack” (A is transmittance, B is fluorescence, and C is an overlay of the two), whereas Fig. 1D is an SCP image of a similarly treated iRBC, analogous to SCP data analyzed in (14). Fig. 1E is the composite sum of several SDCM z slices from the same z stack used to acquire the single z slice image in Fig. 1B. In theory, this panel should represent a sharper version of similar data shown in Fig. 1D (note different late stage trophozoites are shown in D vs. E) and indeed it does. As previously reported (14), visual inspection of Fig. 1D implies that when following conventional methods, BCECF is better localized to the parasite cytosol vs. the RBC cytosol. Thus, in (14), a region of interest (ROI) is defined around the brighter (presumably parasite cytosol) BCECF staining, to separate parasite cytosolic BCECF response from RBC cytosolic. Initially this appears reasonable, however, as can be appreciated when comparing panels 1B, 1D and 1E, this approach can be misleading. When living cells in proper tissue culture environment are stained in this fashion, probe actually appears to concentrate within the parasitophorous space ([ps]; the region between the parasite parasitophorous and plasma membranes), as evidenced by the clear “ring” of higher fluorescence in panel 1 B. Since the ps surrounds the parasite in 3 dimensions, these “rings” seen in individual z slices give a circular appearance when several z slices are added together in a maxmimal z axis projection (e.g. Fig. 1E). Not coincidentally, the SCP image (Fig. 1D) is similar in x, y appearance to the z axis sum (Fig. 1E), since SCP techniques collect light from multiple z positions simultaneously. Thus, we suggest one source of disagreement currently in the literature is that some recordings have actually included substantial contributions from BCECF concentrated within the ps. Meaning, ps pH data have likely been added to parasite pHcyt data.
Fig 1.
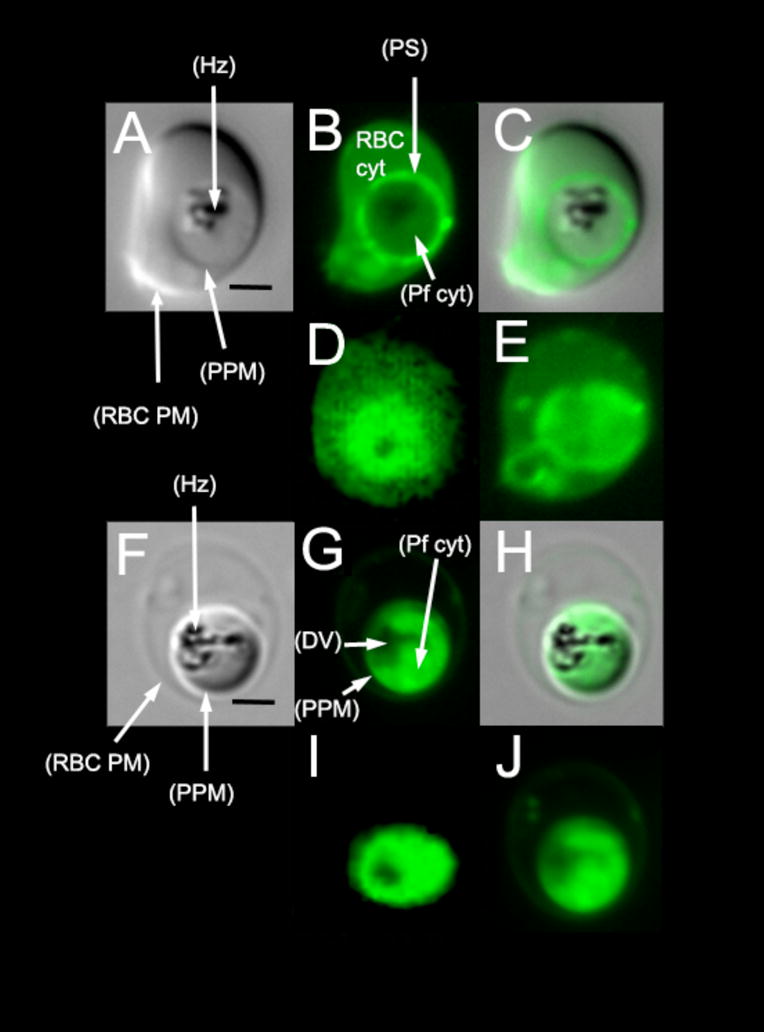
BCECF - AM loading of cells +/− saponin titration. SDCM images of iRBCs stained with 5 uM BCECF - AM (A–C) in the absence of selective membrane permeabilization shows the probe concentrating predominately in the parasitophorous space (ps) and the iRBC cytoplasm, with relatively little fluorescence emanating from the parasite cytoplasm (B). When viewed via SCP methods that collect all light emitted in the z axis sense (D), staining in the spherical ps projects to a circular pattern. A similar image is obtained by adding several consecutive SDCM 0.2 μm “slices” as described in the text (E). In order to localize this probe exclusively to the parasite cytoplasm it is necessary to first treat the iRBCs with 0.03% saponin prior to BCECF loading. SDCM demonstrates that this fluorescence is predominately within the parasite cytoplasm, with little or no fluorescence in the parasite ps, DV or the iRBC cytoplasm (F–H). This allows us to collect fluorescence data via SCP that is exclusively from the parasite cytoplasm (I). Additive “slices” of the SDCM image (G) results in a similar image (J). Scale bars (A,F) are 2 μm and are relevant for all subsequent panels.
In theory, one could mathematically correct for these multiple sites of probe localization, but this would require rapid “4D” resolution as in (13), along with additional substantial software development to rapidly define and segment the probe response (under continuous perfusion) in 3 (not 2) dimensions. Alternatively, more exclusive probe localization could be perfected in order to minimize background probe response added from other compartmental locations. Fig. 1F– J shows the later approach. In brief, we perfused parasites with carefully titrated saponin solutions in order to achieve conditions that selectively permeabilized the RBC plasma and parasite parasitophorous membranes, but not the parasite plasma membrane. We deduced that 0.03 % saponin perfusion provided near exclusive localization of BCECF to the parasite cytosol (Fig. 1F – H) as evidenced by clear circular patterns of fluorescence (not ring patterns) for both individual LSCM z slices (Fig. 1G) as well as composite LSCM z axis projections (Fig. 1J) and SCP images (Fig. 1I). No preferential ps staining is found for these preparations, and background staining of the RBC cytosol is essentially reduced to zero (compare panels 1B, D to panels 1G, I).
Although to our eye the localization of parasite cytosolic probe appeared constant vs. time under perfusion (data not shown), indicating that this saponin treatment did not induce BCECF permeant pores into the parasite plasma membrane (ppm), we worried whether the saponin treatment might make the ppm passively permeant to solutes much smaller than BCECF (e.g. to Na+ or H+). Such a scenario could negatively affect NHE experiments that require rapid ion substitution. To test whether these conditions unduly perturbed ppm H+ permeability, we titrated parasite cytosolic probe response vs. perfusate at different pH, +/− protonophores. A sample titration is shown in Fig. 2, wherein the saponin concentration chosen (0.03 %) clearly leaves the plasma membrane impermeant to passive H+ leak. That is, there is no change in probe response when perfusate is rapidly changed from pH 7.40 to pH 6.50 (first arrow, top trace Fig. 2) unless protonophore is included in the perfusate (second arrow). Higher concentrations of saponin give parasite plasma membranes that are partially (middle trace, 0.04 %) or very (bottom trace, 0.05 %) “leaky” to H+, observed as a simultaneous change in BCECF response when perfusate pH is changed in the absence of protonophores (Fig. 2 first arrow, middle and bottom traces, respectively).
Figure 2.

Saponin titration of the CQR clone Dd2 loaded with 5 μM BCECF-AM. Treatment of infected RBCs with 0.05% (dotted line), 0.04% (middle thin line) or 0.03% (heavy line) saponin prior to treatment with BCECF-AM leads to varying passive pm H+ permeabilities (high, intermediate, and zero, respectively). Cells are first perfused with physiologically relevant HBSS buffer before switching to perfusate at pH 6.50 with no ionophore (first arrow). PH stability indicates the membrane is “tight” with respect to H+ (heavy trace, 0.03 %). Perfusuate at pH 6.50 and 7.60 and containing 10 μM CCCP (a protonophore that instantly collapses ΔpH) are introduced at the 2nd and 3rd arrows, respectively.
With these probe localization and rapid perfusion conditions in hand, we first measured steady state parasite cytosolic pH (pHcyt) as shown in Fig. 3. As previously reported (14, 22) CQR parasites (e.g. strain Dd2, top solid trace Fig. 3) show higher cytosolic pH relative to CQS (e.g. strain HB3, bottom dashed trace). Importantly, our imaging and perfusion methods allow us to titrate probe response in real time for each individual cell (e.g. Fig. 3 shows titration from physiologic perfusate (0 to 180 sec) to perfusate plus protonophore and at pH 7.00 (first arrow, 180 – 380 sec), pH 7.40 (second arrow, 380 – 580 sec) or pH 7.80 (third arrow), respectively. Over multiple experiments recorded for > 25 individual synchronized parasites, probe localization and calibration was consistent (see below).
Figure 3.

BCECF - AM in situ measurement of pHcyt for CQR (solid line) and CQS (dashed line) saponin-titrated parasites. Initially the cells were perfused with HBSS at 37°C (0 – 180 sec), followed immediately by calibration solutions containing 10 μM CCCP in HBS at pH 7.0, 7.4 and 7.8 (first, second, third arrows), respectively. Calibration in situ overlaps for the two strains indicating probe response is consistent. Each trace represents the average of at least 10 parasites.
Since previous work suggested that alkaline pHcyt was correlated with CQR (14), but since that conclusion was challenged (23), and since recent QTL analysis suggested a chromosomal fragment harboring PfNHE might be associated with QNR (but not necessarily CQR), we measured pHcyt for 13 progeny of the HB3 X Dd2 genetic cross previously used in the QNR QTL analysis (10). Importantly, the progeny chosen show a range of resistances to either or both CQ and QN that are not necessarily related (meaning high QNR does not necessarily dictate high CQR, and vice versa). Average pHcyt values from these experiments are tabulated in Table 2 (1st and last columns are HB3 and Dd2, respectively). Possible correlations between pHcyt, CQR and QNR are discussed below, after presentation of PfNHE activity data for these same strains.
Table II.
Gene inheritance, pHcyt, NHE activity (in mmol H+/L/min) and QN, CQ sensitivities (in nM [6]) for Dd2, HB3 and 13 of their progeny; N is number of cells, SEM is standard error of the mean.
| Strain | HB3 | CH3-61 | 7C46 | QC34 | B4R3 | 7C126 | GC03 | SC05 | 7C111 | 3BD5 | 7C421 | D43 | 7C3 | 7C101 | Dd2 |
|---|---|---|---|---|---|---|---|---|---|---|---|---|---|---|---|
| Chr 7,9,13 | H,H,H | H,H,H | D,H,H | D,H,H | H,D,H | H,D,H | H,H,D | H,H,D | D,H,D | D,H,D | D,D,H | D,D,H | H,D,D | D,D,D | D,D,D |
| Chr 5,6,7 | H,H,H | D,D,H | H,D,D | H,D,D | D,D,H | D,D,H | H,D,H | H,D,H | D,H,D | D,H,D | D,H,D | D,D,D | H,H,H | D,D,D | D,D,D |
| pH cyt | 7.20 | 7.17 | 7.23 | 7.23 | 7.35 | 7.34 | 7.37 | 7.33 | 7.33 | 7.40 | 7.36 | 7.43 | 7.58 | 7.60 | 7.57 |
| N | 30 | 40 | 29 | 19 | 29 | 26 | 18 | 20 | 44 | 20 | 21 | 16 | 29 | 39 | 48 |
| SEM | 0.03 | 0.01 | 0.03 | 0.01 | 0.03 | 0.01 | 0.04 | 0.02 | 0.03 | 0.01 | 0.04 | 0.04 | 0.03 | 0.01 | 0.02 |
| NHE (6.2) | 63.54 | 61.29 | 72.86 | 66.09 | 102.57 | 109.62 | 103.51 | 105.27 | 108.72 | 112.43 | 103.84 | 96.56 | 134.43 | 151.02 | 142.22 |
| N | 18 | 24 | 23 | 27 | 25 | 25 | 23 | 19 | 21 | 25 | 26 | 23 | 18 | 26 | 16 |
| SEM | 0.77 | 0.42 | 0.57 | 0.64 | 0.94 | 1.02 | 1.16 | 0.74 | 1.64 | 1.27 | 0.83 | 1.33 | 2.03 | 1.11 | 1.70 |
| QNIC90 | 382 | 322 | 625 | 673 | 202 | 289 | 351 | 428 | 540 | 379 | 388 | 452 | 732 | 654 | 925 |
| CQIC90 | 44 | 37 | 670 | 814 | 35 | 41 | 37 | 50 | 552 | 784 | 555 | 464 | 42 | 691 | 735 |
For most eukaryotic cell types, Na+/H+ exchange (NHE) is the chief regulator of pHcyt. We initially applied the well known ammonium pre pulse method to analyze NHE and test its role in altered parasite pHcyt. However, in multiple attempts, and with a variety of simple monoprotic or diprotic weak bases, we were unable to reliably “acid pulse” the parasite cytosol such that the induced acid pHcyt was stable in the absence of Na+ (e.g. Fig. 4E). It is likely that the ppm harbors one or more transporters for ammonium as well as the charged form of other small organic weak bases, as also recently suggested by Kirk and colleagues (27).
Figure 4.

Determination of NHE activity in permeabilized iRBCs (strain 7C46). (A) Physiologically relevant buffer (HBSS) is initially perfused until the first arrow, where calibration buffer (HEPES pH 7.40) containing no Na+ (replaced with equimolar NMDG+) and 0.8 uM nigericin is added. The second calibration buffer (MBS, pH 6.4, 0.8 uM nigericin, solution “D”, Table 1) is added at the second arrow. At the third arrow, 10 mg/ml BSA is added to nigericin-free buffer (solution “E”) in order to remove nigericin and “lock” pHcyt at the pHex. At the fourth arrow, either a Na+ free buffer (“B”) or buffer containing sodium (“E”) is added back to the cells. The area in the box highlights alkalization of the parasite cytoplasm in the absence and presence of Na+ and is expanded in (B). The two traces in (B) are subtracted to give (C), the Na+ dependent alkalization of pHcyt after acid load (NHE activity). The first 40 seconds of alkalization is enlarged and fit to a straight line in (D), to compute the rate of NHE activity in pH units/sec (in this example the rate is 0.0156 pH units/sec). Similar experiments using the NH4Cl pulse method (14,25) do not produce reliably stable pHcyt acid pulse (note spontaneous recovery 350 – 450 sec either + or − Na+, panel E) and do not separate Na+ dependent vs. independent components (subtraction between the two produces a nearly flat line (F). All traces represent an average of at least 20 living parasites analyzed individually on a Nikon Diaphot inverted microscope using our custom Single Cell Photometry (SCP) apparatus (11).
Thus we used the alternate nigericin – BSA “pHi clamping” method (28). In this case, physiologic perfusate is first changed to Na+ free perfusate (equimolar NMDG+ in place of Na+; first arrow, Fig. 4A), then to Na+ free at low pH plus 2 μM nigericin as protonophore (second arrow, Fig. 4A), then to the same buffer minus nigericin and plus 5 mg/ml BSA to sequester the protonophore (third arrow, Fig. 4A). At this point (time 500 – 700 sec, Fig. 4A) the parasite cytosol is pH clamped to a stable acid value under Na+ depleted conditions. Upon return to perfusate at normal pH, the pHcyt partially recovers in the absence of Na+ (Fig. 4A 4th arrow, bottom dotted trace), indicating some degree of Na+-independent recovery from intracellular acid load for P. falciparum that is not mediated by any NHE activity. However, recovery is much more robust upon perfusion with buffer at the same pH plus physiologic [Na+] (Fig. 4A, 4th arrow, top trace). The difference between recovery in the presence vs. the absence of Na+ at pHcyt = 6.20 is more clearly shown in an expanded panel (Fig. 4B). If we then subtract recovery in the absence of Na+ from that in the presence (Fig. 4C), Na+ dependent recovery from an acid load (putative NHE activity) is revealed. Performing these experiments vs. various concentrations of the well known NHE inhibitor EIPA, we compute a Ki of 0.9 μM (not shown), well within the range of previous eukaryotic NHE EIPA Ki measured under similar conditions (29).
The early portion of the NHE curve (Fig. 4D) can be fit to compute the rate of recovery in pH units per sec. Importantly, the pH clamping approach allows comparison between cells acid loaded to exactly the same extent. Since NHE activity is highly dependent upon the degree of intracellular acidification, this facilitates more quantitative comparison among different parasite strains at fixed pHcyt (see below). We measured similar buffering capacity (ßi) for CQR (Dd2) and CQS (HB3) parasites across a range of cytosolic pH (Fig. 5), as well as for progeny of their cross (Table 2). This enables proper expression of NHE activity rates as mM H+/sec (e.g. Fig. 6, Table 2). We find that PfNHE activity is conspicuously higher for strain Dd2 CQR parasites (solid symbols Fig. 6) relative to strain HB3 CQS (open symbols Fig. 6) across a range of pHcyt at which exchange is initiated via manipulation of pHex during nigericin/BSA clamping. This conclusion is similar to a conclusion reached previously (14) but the present quantification of exchange (mM H+/sec) vs. pHcyt differs, most likely because of probe localization issues shown in Fig. 1 and stable nigericin/BSA pH clamping vs. unstable ammonium pulse acid loading techniques used previously (compare Fig. 4, E,F to Fig. 4A,B).
Figure 5.

Intracellular buffer capacity measured vs. pHi for the CQR clone Dd2 (closed squares) and the CQS clone HB3 (open circles). Cytosolic pH was locked to external pH using the nigericin/BSA method. Buffering capacity was determined at each pHi by pulsing with 25 mM NH4Cl (25). Each point represents the average of at least 10 parasites.
Figure 6.

NHE activities for the CQR clone Dd2 (closed squares) and the CQS clone HB3 (open circles) vs. clamped pHi. Each point represents at least 10 parasites +/− s.d.
Following this approach we measured PfNHE activity at pH = 6.20 for the panel of Dd2 X HB3 genetic cross progeny summarized in Table 2. We measure a range of activities that appear to be directly related to pHcyt values (relative to HB3 CQS control) measured for these strains. Indeed, plotting pHcyt vs. NHE activity at pHi = 6.20 yields a straight line (Fig. 7A). We conclude that altered pHcyt in these strains exhibiting variable degrees of CQR and QNR is due in large part to altered NHE activity. We note both measured rate and apparent set point are elevated for the strains with elevated pHcyt.
Figure 7.

NHE activity (A), CQ IC90 (B) QN IC90 (C) vs. pHcyt for strains shown in Table 2. Not surprisingly NHE activity is well correlated with relative pHcyt (A; Pearson correlation analysis r = 0.95, p < 0.0001) for all clones analyzed in this study (see Table 2). There is no correlation between CQR and pHcyt across the entire set of clones (B). A strong correlation between QN IC90 and pHcyt (C, Pearson correlation analysis r = 0.82, p < 0.003) is found for 13 of the 15 strains in Table II (solid circles) wherein some level of quinine response is influenced by inheritance of Dd2 chr 9 and/or chr 13 loci (see also pairwise analysis in A and Table II). This correlation is not as strong when we include strains for which QNR is due solely to mutant pfcrt without the added effect of chr 9 and/or chr 13 loci (e.g. strains 7C46 and QC34, which are shown in plot C [star symbols], but not included in the straight line fit).
Finally, in contrast to previous conclusions (14), we do not find that alkaline pHcyt or elevated NHE activity is correlated to the degree of CQR (Fig. 7B). Instead, across this panel of Dd2 X HB3 progeny, pHcyt and NHE activity are better correlated with QNR in a subset of these strains (Fig. 7C), as described below.
DISCUSSION
Using the bioinformatics criteria of Rao and colleagues (29) the PfNHE protein encoded by a gene localized within a fragment of chr 13 linked to QNR (10) clearly belongs to the plasma membrane localized sub family of the large NHE superfamily found throughout eukaryota. Indeed, specific cytosolic probe localization and EIPA – inhibitable, Na+-dependent recovery after acid pHcyt clamping shows that a plasma membrane localized NHE protein is active for intraerythrocytic P. falciparum. As expected, the activity of PfNHE appears to be a major determinant of pHcyt (cf. Fig. 7A) and is inhibited by EIPA similar to other eukaryotic NHE proteins.
Careful inspection of the data in Table 2 and Fig. 7 defines several interesting trends. Progeny of the Dd2 × HB3 cross inherit various combinations of loci previously associated with drug resistance (notably, a [chr 7] fragment containing mutant pfcrt, a [chr 5] fragment containing multiple copies of pfmdr1, or a [chr 13] fragment containing mutant pfnhe) and loci that contribute in pairwise fashion to drug resistance conferred by chr 13 (chr 9) or chr 7 (chr 6) (10). Table 2 is arranged to show whether progeny of the Dd2 × HB3 cross have inherited the Dd2 (“D”) drug resistance associated alleles or drug sensitive associated HB3 (“H”) alleles, in each of these categories (rows 2, 3; note these 2 rows define the 2 genetic routes to QNR as defined in [10]). Comparing the locus inheritance patterns to the biochemical data discussed above, we conclude that inheritance of the CQR – associated chr 7 locus (e.g., inheritance of CQR – conferring mutant pfcrt present on “D” but not “H”) in and of itself is not related to elevated pHcyt. Thus, CQR (conferred by mutant pfcrt (3)) does not necessarily depend upon alkalinization of pHcyt (c.f. Fig. 7B). Instead, inheritance of the “D” chr 13 locus expressing a mutant PfNHE along with “D” chr 9 promotes significantly elevated pHcyt and QNR independent of chr 7 and CQR (compare lines 7C3, 7C101 to Dd2; far right, Table 2). Inheritance of the D chr 7 locus with the D chr 9, 13 loci does not further elevate pHcyt but will promote a higher net DV membrane pH gradient (11).
Inheritance of either the D chr 5 (multi copy pfmdr 1) locus, or the previously noted pairwise interaction between D chr 6 and D chr 7 loci, are not in and of themselves associated with elevated pHcyt. Mildly elevated pHi is seen whenever chr 9 or chr 13 QNR loci are inherited from Dd2, regardless the chr 5, 6 or 7 status (table 2, middle section B4R3 through D43). QNR that is independent of chr 13 inheritance is independent of alkaline pHcyt per se (compare strains 7C46 and QC34 to 7C3 and &C101). However, we note that 7C46 and QC34 have lower DV pH relative to other strains because they have inherited the mutant pfcrt locus from Dd2 (11). Again, either higher pHcyt or a larger net DV membrane pH gradient appears to be associated with QNR.
Taken together (see also Fig. 7C) these trends suggest there are multiple routes to increasing QNR that differ when considering pHcyt or pHDV values alone, but that may overlap mechanistically when one considers the net DV membrane pH gradient. We suggest one route to QNR relies on D chr 13, D chr 9 loci and elevated pHcyt (cf. Fig. 7C) and is very well correlated with altered PfNHE activity (cf. Fig. 7A). We suggest the other route (exemplified by lines 7C46 and QC34) that does not rely on chr 13 – chr 9 loci (see also [10]) does not depend upon alkaline pHcyt per se but relies (at least in part) on the net DV membrane pH gradient.
Interestingly, the three allele groupings shown in Fig. 7A (H9H13, D9H13, H9D13, D9D13) provide a full genotypic accounting of the NHE – linked phenotypic variation across this set of cross progeny. The other route to QNR that is independent of NHE and elevated pHcyt may rely on chr 6 – chr 7 pairwise interactions in the absence of a D pfmdr1 allele (e.g. strains 7C46, QC34). Which route will turn out to be more common in field isolates is yet to be determined. Definition of the molecular basis of the chr 6, 7 pathway clearly merits additional investigation.
With respect to the pHcyt/PfNHE dependent pathway, how might “D” PfNHE (the ms4760 – 1 allele, see (10)) confer elevated pHcyt relative to “H” PfNHE (ms4760 – 5 (10)), and how might this be amplified by a pairwise interaction with the D chr 9 locus ? As described previously (10), the “D” PfNHE protein differs from “H” in that it contains 2 tandem repeats of the sequence DNNND vs. 4 such repeats for H PfNHE. These repeats are in the predicted C – terminal tail region of PfNHE, immediately N – terminal to a poly his region. There are 7 his residues for D PfNHE in this poly his region, whereas H PfNHE is missing 2 of these. Thus the his:asp residue ratio changes from 7:4 to 5:8 within the domain, affecting the net pI of a likely “set point” PfNHE C terminal region. His protonation/deprotonation and charge dependent conformational alterations in NHE C – terminal tail regions are frequently invoked aspects of popular set point models for NHE regulation [e.g. (29,30)]. We suggest that the DNNND repeat polymorphisms along with proximal his residue deletions found in this C – terminal region of various PfNHE alleles alters set point regulation of PfNHE.
Protein kinase C and Ca++ are additional regulators of NHE proteins (31) as are calcineurin phosphatases. Recently, a crystal structure of calcineurin B and a NHE1 C terminal tail peptide defined a calcineurin binding site that lies near a poly his region (32). Our sequence analysis places 6 consensus PKC phosphorylation sites within or immediately proximal to the predicted PfNHE calcineurin binding site (defined via high homology to the binding site shown in [32]; D. Chen, T. Bennett & PD Roepe, unpublished). The relevant chr 9 fragment that interacts pairwise with chr 13 to promote higher QNR (as well as higher pHcyt and higher PfNHE activity) harbors several interesting genes. However, one is a cyclophilin homologue. Cyclophilins (peptidyl – prolyl isomerases) are well known regulators of calcineurins. One possibility then is that the “D” chr 9 fragment promotes expression of a mutant or alternately expressed cyclophilin. Testing this hypothesis and other possibilities should be possible via gene knockout or allelic replacement experiments.
In sum, ion transport perturbations across at least two malarial parasite membranes (ppm and DV) have now been found to be associated with antimalarial drug resistance, but the relationships between these perturbations and degrees of resistance to the panel of various drugs in use are complex. In the case of pHDV and CQR, a simple and approximately bi modal distribution is found (i.e., pH ≤ 5.3 = [5 – 10]×CQS IC50 vs. pH ≥ 5.5 = [1 – 2]×CQS IC50) that is cleanly associated with chr 7 (pfcrt) mutations (3, 4,11,13). In the case of pHcyt and QNR (Table 2, Fig. 7C) the situation is much more complex. First, a more “Gaussian” distribution of QNR values are seen and multiple genetic pathways to QNR appear to exist, in contrast to CQR in P. falciparum. Second, levels of QNR appear to be reasonably well correlated with pHcyt when those strains have inherited either or both the D chr 9 and chr 13 loci to become QNR via one common pathway (Fig. 7C), but not when they are QNR via the apparently less common D chr 6, D chr 7 pairwise interaction. Third, particularly high QNR appears to be reliably associated with particularly high pHcyt, regardless chr 7 and CQR status, whereas pHcyt vs. QNR may be somewhat more ambiguous at lower levels of QNR (Fig. 7C).
Based on the above observations and the fact that regulation of pHDV and pHcyt are linked, we predict that the sum of pHDV and pHcyt perturbations may better illustrate the altered physiology linked to QR, relative to pHcyt or pHDV values alone. PfNHE and PfCRT mutations are apparently common routes to producing the pHcyt and pHDV perturbations observed in various strains, but there could also be others. We suggest that the net difference in pH across the DV membrane, and also the other parameters whose regulation is intimately linked to regulation of this gradient (e.g. DV volume, osmolyte traffic, etc. see [13]) are, collectively, essential determinants of QR. A complete appreciation of QR physiology and its many effects on drug transport, target availability, drug – target binding and other aspects of the overall resistance mechanism is likely only obtained via considering all such perturbations collectively.
Acknowledgments
This work was supported by NIAID/NIH (RO1 AI056312; AI052312 to PDR). We thank our laboratory colleagues for experimental help, particularly B. Gligorijevic, K. Sullivan and L. Pordes for assistance with imaging and cell culture, and D. Chen for help with bioinformatics analysis. PDR acknowledges helpful conversations with Dr. R. Cooper.
Footnotes
Supported by NIH grants AI56312 & AI45759 to PDR
Abbreviations: CQ, chloroquine; MQ, mefloquine; AQ, amodiaquine; QN, quinine; QD, quinidine; CQR, chloroquine resistance (or resistant); PfCRT, Plasmodium falciparum chloroquine resistance transporter; MDR, multidrug resistance; QR, quinoline resistance; Pgp, P – glycoprotein; Pgh-1, Pgp homologue 1; PfMDR1, Plasmodium falciparum multidrug resistance protein; QNR, quinine resistance (or resistant); chr, chromosome; NHE, sodium proton exchange; pHDV, steady state digestive vacuolar pH; pHcyt, steady state cytosolic pH; DV, digestive vacuole; QTL, quantitative trait loci; PfNHE, P. falciparum sodium – proton exchanger; BCECF – AM (2′,7′-bis-(2-carboxyethyl) -5-(and-6)-carboxyfluorescein, acetoxymethyl ester); SCP, single cell photometry; ROI, region of interest; BSA, bovine serum albumin; CCCP (carbonyl cyanide 3-chlorophenylhydrazone); iRBC, infected Red blood cell; LSCM, laser scanning confocal microscopy; SDCM, spinning disk confocal microscopy; ps, parasitophorous space; NMDG, N – methyl – D- glucosamine; EIPA, ethyl isopropyl amiloride.
As the list of drugs in MDR profiles have grown, and as the variety of different MDR genotypes and phenotypes for a given cell type or micro organism has expanded enormously, the term “MDR” has become imprecise or confusing in most settings. Here, “MDR” means resistance to multiple antimalarials with distinctly different pharmacophore backbones (e.g. anti folates and quinolines), whereas “QR” means cross resistance to multiple quinolines (e.g. chloroquine, quinine, mefloquine etc.). In malaria, MDR is clearly multigenic (e.g. antifolate and quinoline resistance requires mutations in both pfdhfr and pfcrt genes for P. falciparum, respectively). Surprisingly, different forms of QR also appear to be multigenic. The best data currently available suggest multigenic pathways to QR vs. MDR differ, and therefore that the molecular mechanism(s) of QR vs. MDR are likely not identical.
Publisher's Disclaimer: This is a PDF file of an unedited manuscript that has been accepted for publication. As a service to our customers we are providing this early version of the manuscript. The manuscript will undergo copyediting, typesetting, and review of the resulting proof before it is published in its final citable form. Please note that during the production process errors may be discovered which could affect the content, and all legal disclaimers that apply to the journal pertain.
References
- 1.Baird JK. Effectiveness of antimalarial drugs. N Engl J Med. 2005;352:1565–77. doi: 10.1056/NEJMra043207. [DOI] [PubMed] [Google Scholar]
- 2.Snow RW, Guerra CA, Noor AM, Myint HY, Hay SI. The global distribution of clinical episodes of Plasmodium falciparum malaria. Nature. 2005;434:214–7. doi: 10.1038/nature03342. [DOI] [PMC free article] [PubMed] [Google Scholar]
- 3.Fidock DA, Nomura T, Talley AK, Cooper RA, Dzekunov SM, Ferdig MT, Ursos LMB, Sidhu ABS, Naude B, Deitsch KW, Su XZ, Wootton JC, Roepe PD, Wellems TE. Mutations in the P-falciparum digestive vacuole transmembrane protein PfCRT and evidence for their role in chloroquine resistance. Molecular Cell. 2000;6:861–871. doi: 10.1016/s1097-2765(05)00077-8. [DOI] [PMC free article] [PubMed] [Google Scholar]
- 4.Cooper RA, Ferdig MT, Su XZ, Ursos LM, Mu J, Nomura T, Fujioka H, Fidock DA, Roepe PD, Wellems TE. Alternative mutations at position 76 of the vacuolar transmembrane protein PfCRT are associated with chloroquine resistance and unique stereospecific quinine and quinidine responses in Plasmodium falciparum. Mol Pharmacol. 2002;61:35–42. doi: 10.1124/mol.61.1.35. [DOI] [PubMed] [Google Scholar]
- 5.Sidhu AB, Valderramos SG, Fidock DA. pfmdr1 mutations contribute to quinine resistance and enhance mefloquine and artemisinin sensitivity in Plasmodium falciparum. Mol Microbiol. 2005;57:913–26. doi: 10.1111/j.1365-2958.2005.04729.x. [DOI] [PubMed] [Google Scholar]
- 6.Demar M, Carme B. Plasmodium falciparum in vivo resistance to quinine: description of two RIII responses in French Guiana. Am J Trop Med Hyg. 2004;70:125–7. [PubMed] [Google Scholar]
- 7.Basco LK, Le Bras J. In vitro susceptibility of Cambodian isolates of Plasmodium falciparum to halofantrine, pyronaridine and artemisinin derivatives. Ann Trop Med Parasitol. 1994;88:137–44. doi: 10.1080/00034983.1994.11812851. [DOI] [PubMed] [Google Scholar]
- 8.Pettinelli F, Pettinelli ME, Eldin de Pecoulas P, Millet J, Michel D, Brasseur P, Druilhe P. Short report: High prevalence of multidrug-resistant Plasmodium falciparum malaria in the French territory of Mayotte. Am J Trop Med Hyg. 2004;70:635–7. [PubMed] [Google Scholar]
- 9.Pradines B, Hovette P, Fusai T, Atanda HL, Baret E, Cheval P, Mosnier J, Callec A, Cren J, Amalvict R, Gardair JP, Rogier C. Prevalence of in vitro resistance to eleven standard or new antimalarial drugs among Plasmodium falciparum isolates from Pointe-Noire, Republic of the Congo. J Clin Microbiol. 2006;44:2404–8. doi: 10.1128/JCM.00623-06. [DOI] [PMC free article] [PubMed] [Google Scholar]
- 10.Ferdig MT, Cooper RA, Mu JB, Deng BB, Joy DA, Su XZ, Wellems TE. Dissecting the loci of low-level quinine resistance in malaria parasites. Molecular Microbiology. 2004;52:985–997. doi: 10.1111/j.1365-2958.2004.04035.x. [DOI] [PubMed] [Google Scholar]
- 11.Bennett TN, Kosar AD, Ursos LM, Dzekunov S, Singh Sidhu AB, Fidock DA, Roepe PD. Drug resistance-associated pfCRT mutations confer decreased Plasmodium falciparum digestive vacuolar pH. Mol Biochem Parasitol. 2004;133:99–114. doi: 10.1016/j.molbiopara.2003.09.008. [DOI] [PubMed] [Google Scholar]
- 12.Dzekunov SM, Ursos LMB, Roepe PD. Digestive vacuolar pH of intact intraerythrocytic P-falciparum either sensitive or resistant to chloroquine. Molecular and Biochemical Parasitology. 2000;110:107–124. doi: 10.1016/s0166-6851(00)00261-9. [DOI] [PubMed] [Google Scholar]
- 13.Gligorijevic B, Bennett TN, McAllister R, Urbach J, Roepe P. Spinning Disk Confocal Microscopy of Intraerythrocytic Malarial Parasites II: Quantification of Digestive Vacuolar Volume. Biochemistry. 2006;45:12411 – 12423. doi: 10.1021/bi0610348. [DOI] [PubMed] [Google Scholar]
- 14.Wunsch S, Sanchez CP, Gekle M, Grosse-Wortmann L, Wiesner J, Lanzer M. Differential stimulation of the Na+/H+ exchanger determines chloroquine uptake in Plasmodium falciparum. J Cell Biol. 1998;140:335–45. doi: 10.1083/jcb.140.2.335. [DOI] [PMC free article] [PubMed] [Google Scholar]
- 15.Wellems TE, Panton LJ, Gluzman IY, do Rosario VE, Gwadz RW, Walker-Jonah A, Krogstad DJ. Chloroquine resistance not linked to mdr-like genes in a Plasmodium falciparum cross. Nature. 1990;345:253–5. doi: 10.1038/345253a0. [DOI] [PubMed] [Google Scholar]
- 16.Gardner MJ, Hall N, Fung E, White O, Berriman M, Hyman RW, Carlton JM, Pain A, Nelson KE, Bowman S, Paulsen IT, James K, Eisen JA, Rutherford K, Salzberg SL, Craig A, Kyes S, Chan MS, Nene V, Shallom SJ, Suh B, Peterson J, Angiuoli S, Pertea M, Allen J, Selengut J, Haft D, Mather MW, Vaidya AB, Martin DM, Fairlamb AH, Fraunholz MJ, Roos DS, Ralph SA, McFadden GI, Cummings LM, Subramanian GM, Mungall C, Venter JC, Carucci DJ, Hoffman SL, Newbold C, Davis RW, Fraser CM, Barrell B. Genome sequence of the human malaria parasite Plasmodium falciparum. Nature. 2002;419:498–511. doi: 10.1038/nature01097. [DOI] [PMC free article] [PubMed] [Google Scholar]
- 17.Bosia A, Ghigo D, Turrini F, Nissani E, Pescarmona GP, Ginsburg H. Kinetic characterization of Na+/H+ antiport of Plasmodium falciparum membrane. J Cell Physiol. 1993;154:527–34. doi: 10.1002/jcp.1041540311. [DOI] [PubMed] [Google Scholar]
- 18.Sanchez CP, Horrocks P, Lanzer M. Is the putative chloroquine resistance mediator CG2 the Na+/H+ exchanger of Plasmodium falciparum? Cell. 1998;92:601–2. doi: 10.1016/s0092-8674(00)81127-7. [DOI] [PubMed] [Google Scholar]
- 19.Sanchez CP, Wunsch S, Lanzer M. Identification of a chloroquine importer in Plasmodium falciparum. Differences in import kinetics are genetically linked with the chloroquine-resistant phenotype. J Biol Chem. 1997;272:2652–8. doi: 10.1074/jbc.272.5.2652. [DOI] [PubMed] [Google Scholar]
- 20.Cooper RA, Papakrivos J, Lane KD, Fujioka H, Lingelbach K, Wellems TE. PfCG2, a Plasmodium falciparum protein peripherally associated with the parasitophorous vacuolar membrane, is expressed in the period of maximum hemoglobin uptake and digestion by trophozoites. Mol Biochem Parasitol. 2005;144:167–76. doi: 10.1016/j.molbiopara.2005.07.009. [DOI] [PubMed] [Google Scholar]
- 21.Wellems TE, Wootton JC, Fujioka H, Su X, Cooper R, Baruch D, Fidock DA. P. falciparum CG2, linked to chloroquine resistance, does not resemble Na+/H+ exchangers. Cell. 1998;94:285–6. doi: 10.1016/s0092-8674(00)81471-3. [DOI] [PubMed] [Google Scholar]
- 22.Martiney JA, Ferrer AS, Cerami A, Dzekunov S, Roepe P. Chloroquine uptake, altered partitioning and the basis of drug resistance: evidence for chloride-dependent ionic regulation. Novartis Found Symp. 1999;226:265–77. doi: 10.1002/9780470515730.ch18. discussion 277–80. [DOI] [PubMed] [Google Scholar]
- 23.Bray PG, Janneh O, Raynes KJ, Mungthin M, Ginsburg H, Ward SA. Cellular uptake of chloroquine is dependent on binding to ferriprotoporphyrin IX and is independent of NHE activity in Plasmodium falciparum. J Cell Biol. 1999;145:363–76. doi: 10.1083/jcb.145.2.363. [DOI] [PMC free article] [PubMed] [Google Scholar]
- 24.Saliba KJ, Kirk K. pH regulation in the intracellular malaria parasite, Plasmodium falciparum. H(+) extrusion via a v-type h(+)-atpase. J Biol Chem. 1999;274(47):33213–9. doi: 10.1074/jbc.274.47.33213. [DOI] [PubMed] [Google Scholar]
- 25.Hoffman MM, Wei LY, Roepe PD. Are altered pHi and membrane potential in hu MDR 1 transfectants sufficient to cause MDR protein-mediated multidrug resistance? J Gen Physiol. 1996;108:295–313. doi: 10.1085/jgp.108.4.295. [DOI] [PMC free article] [PubMed] [Google Scholar]
- 26.Roos A, Boron WF. Intracellular pH. Physiol Rev. 1981;61:296–434. doi: 10.1152/physrev.1981.61.2.296. [DOI] [PubMed] [Google Scholar]
- 27.Lehane AM, Saliba KJ, Allen RJ, Kirk K. Choline uptake into the malaria parasite is energized by the membrane potential. Biochem Biophys Res Commun. 2004;320:311–7. doi: 10.1016/j.bbrc.2004.05.164. [DOI] [PubMed] [Google Scholar]
- 28.Grinstein S, Cohen S, Rothstein A. Cytoplasmic pH regulation in thymic lymphocytes by an amiloride-sensitive Na+/H+ antiport. J Gen Physiol. 1984;83:341–69. doi: 10.1085/jgp.83.3.341. [DOI] [PMC free article] [PubMed] [Google Scholar]
- 29.Brett CL, Donowitz M, Rao R. Evolutionary origins of eukaryotic sodium/proton exchangers. Am J Physiol Cell Physiol. 2005;288:C223–39. doi: 10.1152/ajpcell.00360.2004. [DOI] [PubMed] [Google Scholar]
- 30.Cha B, Oh S, Shanmugaratnam J, Donowitz M, Yun CC. Two histidine residues in the juxta-membrane cytoplasmic domain of Na+/H+ exchanger isoform 3 (NHE3) determine the set point. J Membr Biol. 2003;191:49–58. doi: 10.1007/s00232-002-1044-2. [DOI] [PubMed] [Google Scholar]
- 31.Maly K, Strese K, Kampfer S, Ueberall F, Baier G, Ghaffari-Tabrizi N, Grunicke HH, Leitges M. Critical role of protein kinase C alpha and calcium in growth factor induced activation of the Na(+)/H(+) exchanger NHE1. FEBS Lett. 2002;521:205–10. doi: 10.1016/s0014-5793(02)02867-3. [DOI] [PubMed] [Google Scholar]
- 32.Ammar YB, Takeda S, Hisamitsu T, Mori H, Wakabayashi S. Crystal structure of CHP2 complexed with NHE1-cytosolic region and an implication for pH regulation. Embo J. 2006;25:2315–25. doi: 10.1038/sj.emboj.7601145. [DOI] [PMC free article] [PubMed] [Google Scholar]