

Abstract
The topological architecture of the cerebral anatomical network reflects the structural organization of the human brain. Recently, topological measures based on graph theory have provided new approaches for quantifying large-scale anatomical networks. Diffusion MRI studies have revealed the efficient small-world properties and modular structure of the anatomical network in normal subjects. However, no previous study has used diffusion MRI to reveal changes in the brain anatomical network in early blindness. Here, we utilized diffusion tensor imaging to construct binary anatomical networks for 17 early blind subjects and 17 age- and gender-matched sighted controls. We established the existence of structural connections between any pair of the 90 cortical and sub-cortical regions using deterministic tractography. Compared with controls, early blind subjects showed a decreased degree of connectivity, a reduced global efficiency, and an increased characteristic path length in their brain anatomical network, especially in the visual cortex. Moreover, we revealed some regions with motor or somatosensory function have increased connections with other brain regions in the early blind, which suggested experience-dependent compensatory plasticity. This study is the first to show alterations in the topological properties of the anatomical network in early blindness. From the results, we suggest that analyzing the brain's anatomical network obtained using diffusion MRI data provides new insights into the understanding of the brain's re-organization in the specific population with early visual deprivation.
Introduction
The human brain is a complex natural system, which is capable of carrying out complicated behaviors. However, scientists know little about the neurobiological mechanisms behind higher-level brain functions. In recent years, several researchers have proposed network models and graph theory based topological measures as tools for increasing our understanding of the structural organization and functional mechanisms of the brain [1]–[10]. Recent studies that employed network models have revealed that brain networks exhibit small-world attributes [2], [6]–[13] and modular structure [14]–[16]. These findings support the view that the human brain has evolved a complex, but efficient, neural architecture to maximize the power of information processing [2], [17].
The cerebral anatomical network, which characterizes the global architecture of the anatomical connection pattern in the human brain, is critically important for understanding the underlying structural substrate of brain functions and can be expected to provide new insights into the ways that brain function is affected in certain disease states [4], [10]. To construct anatomical networks for various mammalian species, researchers have used axonal tracing methods to chart macroscopic connection patterns in the cerebral cortex [18]–[22]. However, the invasive nature of the procedure makes it an unlikely candidate for human connectivity analyses in vivo. Recently, noninvasive imaging methods, diffusion tensor imaging (DTI) coupled with fiber tracking algorithms, have come to serve as a feasible alternative to the tracer methods. By measuring the in vivo movement of water molecules within the brain tissues, DTI provides estimates of the direction of a local fiber bundle at each voxel [23]–[25]. Researchers can then infer inter-regional anatomical connections from local estimates using diffusion tensor tractography (DTT) [26]–[30].
Recently, several studies have constructed brain anatomical networks using diffusion MRI in healthy populations [9], [11], [13], [15], [31]. By calculating the anatomical connection probabilities between any two regions, some of these have modeled the brain as a non-directed weighted network [11], [31]. Similarly, Gong et al. constructed a binary anatomical network which used the existence/absence of regional connections [13], based on deterministic DTT techniques. In both cases the researchers employed the automated anatomical labeling (AAL) template [32] to parcellate brain regions. Moreover, to overcome the problem of fiber crossing in DTI, a diffusion spectral imaging (DSI) study suggested a method for constructing a high-resolution connection matrix for each subject with thousands of nodes defined at a voxel population level rather than a regional level [9]. Although the various studies proposed different strategies to define the nodes and connections of the anatomical network, all of them investigated normal people, and all revealed that the cortical networks of the human brain have a “small-world” topology, which is characterized by large clustering coefficient and short average path length [2], [33]. However, no diffusion MRI study has investigated changes in the brain anatomical network in early blind subjects, who lost sight at birth or within the first year of age (Table 1).
Table 1. Demographic data of the early blind subjects.
| Case number | Gender | Age, years | Age onset, years | Causes of blindness | Massage | Piano or guitar practicing |
| 1 | Male | 20.9 | 0 | Retinitis pigmentosa | Yes | Yes |
| 2 | Male | 24.6 | 0 | Optic nerve atrophy | Yes | No |
| 3 | Male | 19.1 | 0 | Retinitis pigmentosa | No | Yes |
| 4 | Male | 24.6 | 0 | Retinitis pigmentosa | Yes | No |
| 5 | Male | 22.4 | <1 | Congenital glaucoma | Yes | No |
| 6 | Male | 29.3 | 0 | Optic nerve hypoplasia | No | Yes |
| 7 | Male | 23.4 | <1 | Congenital glaucoma | Yes | No |
| 8 | Male | 20.8 | <1 | Congenital glaucoma | Yes | No |
| 9 | Male | 18.7 | 0 | Optic nerve hypoplasia | Yes | Yes |
| 10 | Male | 19.0 | 0 | Retrolental fibroplasia | Yes | Yes |
| 11 | Female | 15.6 | 0 | Optic nerve atrophy | No | No |
| 12 | Female | 18.4 | 0 | Retinitis pigmentosa | No | No |
| 13 | Female | 21.7 | 0 | Congenital glaucoma | Yes | Yes |
| 14 | Female | 22.8 | 0 | Retinitis pigmentosa | Yes | No |
| 15 | Female | 27.7 | 0 | Optic nerve atrophy | Yes | Yes |
| 16 | Female | 22.7 | 0 | Congenital cataract | No | No |
| 17 | Female | 24.9 | 0 | Optic nerve hypoplasia | Yes | No |
Note: “Yes” in the massage column refers to a blind has learned or engaged in massage for more than 1 year; “No” in the massage column refers to a blind has learned or engaged in massage for less than 1 year or has never learned massage; “Yes” in the piano or guitar practicing column refers to a blind has practiced one of these two instruments for more than 1 year; “No” the piano or guitar practicing column refers to a blind has practiced one of these two instruments for less than 1 year or has never practiced them.
Early visual deprivation may lead to both abnormal and plastic changes in the visual and other systems of the brain [34], [35]. Although some previous MRI studies have revealed the brain structural and functional changes in early blindness [36]–[42], no one has yet investigated the topological alterations of the brain anatomical network due to early visual deprivation. In the present study, we employed deterministic DTT to infer the existence/absence of network connections [13]. The entire cerebrum was parcellated into 90 regions (see Materials and Methods, Table 2) using the AAL template to define the network nodes. Then we applied graph theory approaches to examine the topological properties of the network constructed for each subject and performed statistical analyses to explore the differences between early blind and normally sighted subjects in the topological properties of the network.
Table 2. Cortical and subcortical regions defined in Automated Anatomical Labeling template image in standard stereotaxic space.
| Region Name | Abbreviation | Region Name | Abbreviation |
| Superior frontal gyrus, dorsolateral | SFGdor | Superior parietal gyrus | SPG |
| Superior frontal gyrus, orbital | SFGorb | Paracentral lobule | PCL |
| Superior frontal gyrus, medial | SFGmed | Postcentral gyrus | PoCG |
| Frontal gyrus, medial orbital | FGmedorb | Inferior parietal gyrus | IPG |
| Middle frontal gyrus | MFG | Supramarginal gyrus | SMG |
| Middle frontal gyrus, orbital | MFGorb | Angular gyrus | ANG |
| Inferior frontal gyrus, opercular | IFGoper | Precuneus | PCNU |
| Inferior frontal gyrus, triangular | IFGtri | Posterior cingulate gyrus | PCC |
| Inferior frontal gyrus, orbital | IFGorb | ||
| Gyrus rectus | REG | Insula | INS |
| Anterior cingulate gyrus | ACC | Thalamus | THA |
| Olfactory cortex | OLF | ||
| Superior temporal gyrus | STG | ||
| Precentral gyrus | PreCG | Superior temporal gyrus, temporal pole | STGp |
| Supplementary motor area | SMA | Middle temporal gyrus | MTG |
| Rolandic operculum | ROL | Middle temporal gyrus, temporal pole | MTGp |
| Median- and para-cingulate gyrus | MCC | Inferior temporal gyrus | ITG |
| Heschl gyrus | HES | ||
| Calcarine fissure and surrounding cortex | CAL | Hippocampus | HIP |
| Cuneus | CUN | Parahippocampal gyrus | PHIP |
| Lingual gyrus | LING | Amygdala | AMYG |
| Superior occipital gyrus | SOG | ||
| Middle occipital gyrus | MOG | Caudate nucleus | CAU |
| Inferior occipital gyrus | IOG | Lenticular nucleus, putamen | PUT |
| Fusiform gyrus | FG | Lenticular nucleus, pallidum | PAL |
Note: The abbreviations listed are those used in this paper, which differ slightly from the original abbreviations by Tzourio-Mazoyer et al. (2002).
Results
To construct the binary anatomical network for each subject, we first partitioned the cerebrum into 90 regions to define the nodes. Then we performed whole-brain fiber tracking based on the DTI data, and if at least three fibers had their end-points in regions u and v, we connected the two nodes, u and v, with an edge.
Altered topological properties of anatomical networks in early blindness
Based on the constructed network, we calculated the topological properties of the global network (see Materials and Methods) for each subject and show the mean values of these properties for the normal control (NC) and early blind (EB) groups in Table 3. Both groups exhibit efficient small-world properties and have almost identical path lengths (λ ≈ 1) but are more locally clustered (γ > 1) compared with the matched random networks. Two-sample t-tests indicated that the anatomical network for early blindness had a significantly increased characteristic path length (Lp) (p = 0.02), a reduced global efficiency (Eglob) (p = 0.01) and a decreased degree of connectivity (Kp) (p = 0.008).
Table 3. The mean values of the topological properties of the networks for the NC and EB groups.
| γ | γ | σ | Kp * | Lp * | Cp | Eglob * | Eloc | |
| NC | 1.7307 | 1.0810 | 1.5991 | 14.2523 | 2.1722 | 0.4974 | 0.5264 | 0.7429 |
| EB | 1.8310 | 1.0860 | 1.6846 | 13.1137 | 2.2414 | 0.4987 | 0.5116 | 0.7420 |
Significant group differences at p<0.05.
Hub regions in anatomical network for each group
First, we calculated the normalized betweenness centrality, bi and vulnerability Vi for each node of each subject's anatomical network. Then we calculated the mean bi and Vi of each node by averaging across subjects for each group. Figure 1 shows all 90 nodes sorted by the mean bi of the normal control group in descending order. To identify the hub regions, we examined the bi of each node in both networks (see Materials and Methods). For the control group, the identified hub nodes (19 total, Table 4) included 10 regions of the association cortex, 5 regions of subcortical structures, 3 paralimbic regions and 1 limbic region. The hubs for the early blind group included 7 regions of the association cortex, 5 regions of subcortical structures, 1 limbic region, 2 paralimbic regions and 1 region of primary cortex for a total of 16 regions (Table 5). The hubs that we located were predominantly in regions of heteromodal or unimodal association cortex which receive convergent inputs from multiple cortical regions [43].
Figure 1. Comparison between two groups with respect to the bi and Vi for each brain region.

The length of the bar indicates the mean values sorted by the mean bi of the NC group in descending order. Left two columns compare the bi values of the control with those of the early blind. Right two columns make the same comparison for the Vi values.
Table 4. Hub regions of the NC group.
| Regions | Class | bi | ki |
| Left precuneus | Association | 0.0907 | 34 |
| Right precuneus | Association | 0.0487 | 27 |
| Right putamen | Subcortical | 0.0455 | 25 |
| Right thalamus | Subcortical | 0.0444 | 24 |
| Right hippocampus | Limbic | 0.0429 | 24 |
| Left putamen | Subcortical | 0.0418 | 26 |
| Left insula | Paralimbic | 0.0404 | 24 |
| Left middle temporal gyrus | Association | 0.0296 | 22 |
| Right middle occipital gyrus | Association | 0.0285 | 23 |
| Left inferior fronto-triangular gyrus | Association | 0.0272 | 21 |
| Left superior occipital gyrus | Association | 0.0249 | 23 |
| Left thalamus | Subcortical | 0.0247 | 19 |
| Left caudate nucleus | Subcortical | 0.0247 | 19 |
| Right superior parietal gyrus | Association | 0.0239 | 19 |
| Left middle occipital gyrus | Association | 0.0235 | 22 |
| Right superior fronto-orbital gyrus | Paralimbic | 0.0234 | 19 |
| Left inferior fronto-orbital gyrus | Paralimbic | 0.0229 | 20 |
| Right superior frontal gyrus | Association | 0.0226 | 19 |
| Right superior occipital gyrus | Association | 0.0223 | 22 |
Table 5. Hub regions of the EB group.
| Regions | Class | bi | ki |
| Left precuneus | Association | 0.102 | 32 |
| Left insula | Paralimbic | 0.0529 | 25 |
| Right thalamus | Subcortical | 0.0515 | 22 |
| Left putamen | Subcortical | 0.05 | 24 |
| Right hippocampus | Limbic | 0.0451 | 20 |
| Right putamen | Subcortical | 0.0443 | 23 |
| Right precuneus | Association | 0.0424 | 24 |
| Left middle temporal gyrus | Association | 0.0382 | 22 |
| Right superior frontal gyrus | Association | 0.0325 | 20 |
| Right superior parietal gyrus | Association | 0.0259 | 17 |
| Right superior fronto-orbital gyrus | Paralimbic | 0.0254 | 17 |
| Left caudate nucleus | Subcortical | 0.0248 | 18 |
| Right postcentral gyrus | Primary | 0.0237 | 16 |
| Right middle occipital gyrus | Association | 0.0227 | 18 |
| Left superior occipital gyrus | Association | 0.0225 | 18 |
| Right caudate nucleus | Subcortical | 0.0214 | 16 |
Note: The regions in bold are the different hubs between the NC and EB groups.
Distribution of the altered regions in early blindness
Since the global properties, Lp, Eglob and Kp of the anatomical network were significantly altered in the early blind group, we further investigated the distribution of the regions which showed significant differences in these topological properties. For each brain region, we used a two-sample two-tailed t-test to detect statistical differences in the nodal properties between groups, and selected the statistical thresholds at three different p values (0.05, 0.01 and 0.005) (Figure 2). The Li, Ei_glob and Ki were significantly altered in many brain regions, especially in the inferior frontal and occipital lobes (Figure 2, 3).
Figure 2. Distribution of regions with significantly altered nodal properties in early blind subjects.

The length of the bar indicates the mean values of the topological measurements (Degree: Ki; Lp: Li; Eglobal: Ei_glob; Cp: Ci; Elocal: Ei_loc) of each altered brain region. Black bars represent normal group, and open bars represent early blind group. (Unstarred bars: significance with p<0.05; *: p<0.01; **: p<0.005).
Figure 3. Cortical regions with altered topological properties in early blind subjects (p<0.05).

Blue: regions with decreased Ki and Ei_glob and increased Li in the early blind; Red: regions with increased Ki and Ei_glob in the early blind; Top: left hemisphere (LH); Bottom: right hemisphere (RH).
Although the local properties, such as Cp and Eloc of the global anatomical network were not significantly altered in early blind subjects, we performed statistical comparison of Ci and Ei_loc for each node to reveal the local changes of these two properties. The Ci and Ei_loc were altered in several regions with a statistical threshold at p = 0.05, such as gyrus rectus, middle and inferior temporal gyrus (Figure 2).
Comparisons of backbone networks between groups
We identified the population-based backbone network of each group separately. Figure 4 reveals that the control and early blind groups have similar connection patterns in 90 regions, but that the early blind group has a sparser matrix than the control group (sparsity of NC: 0.0649; sparsity of EB: 0.0562, reduced 13.4%). This finding suggests fewer anatomical connections in the early blind group at the same threshold. This is also consistent with the above result that showed a significantly reduced degree of connectivity in the early blind.
Figure 4. Backbone networks for the NC and EB groups.

White matter changes in early blindness
Through statistical comparison of nodal properties, we revealed most of altered brain regions were located in the inferior frontal and occipital lobe in the anatomical network, to further investigate whether these changes were related to the alterations of the integrity of the white matter tracts connecting these two regions, we reconstructed the long-distance anatomical connections between the inferior frontal lobe and the occipital lobe: the inferior fronto-occipital (IFO) fasciculus. For each subject, the bilateral IFO fasciculi can be well reconstructed (Figure 5). Through the statistical analysis of the mean fractional anisotropy (FA) in IFO fasciculi between groups, we found that the early blind subjects have significantly lower FA values than the sighted subjects (p = 0.002) (Figure 6). The analysis results also revealed there was a significant main effect of hemisphere (p = 0.005) and no significant group-by-hemisphere interaction (p>0.1).
Figure 5. Representation of the reconstructed IFO fasciculi for a normal and blind subject.

The tracked fibers are overlaied on the individual's anatomical image (T1-weighted). Left: normal subject NC07; right: blind subject EB09.
Figure 6. Mean FA of bilateral IFO fasciculi for the NC and EB groups.

Open circles: mean values of the FA; error bars: standard deviations of the FA.
Discussion
The present study demonstrated changes in the anatomical network in early blindness using DTT for the first time. Compared with the normal controls, the early blind subjects showed disrupted global anatomical connection patterns, such as a lower degree of connectivity, a longer characteristic path length and a lower global efficiency. The brain regions with most significant topological changes were mainly located in the visual cortex, a finding which is consistent with previous MRI studies of the early blind [36]–[41], [44]. Therefore, our study suggests that investigating early blindness from the perspective of anatomical networks using DTI may be helpful for understanding of the brain's re-organization due to early visual deprivation.
Small-world anatomical networks
In this study, we revealed the small-world properties of the anatomical networks in both the controls and the early blind subjects. These findings are consistent with previous studies, which have revealed the small-world topologies of the human brain using various techniques, such as electroencephalography [45], [46], magnetoencephalography [3], functional MRI [5], [12], structural MRI [8] and diffusion MRI [9], [11], [13]. Small-world networks have high clustering coefficients and short characteristic path lengths and are thus good compromises between regular and random networks [33]. Small-world topologies can support both segregated/specialized and distributed/integrated information processing. Moreover, small-world networks are economical, tending to minimize wiring costs while supporting a high level of dynamical complexity [47]. Dynamic systems with small-world properties seem to confer resilience against pathological attack and display enhanced signal-propagation speed, computational power, and synchronizability [2], [6], [10]. Our findings provided support for the perspective that the human brain has evolved into a highly complex but efficient neural system [2], [48].
Altered anatomical networks in early blindness
The human brain is a large, dynamic system with an optimal balance between local specialization and global integration. Although small-world properties were present for both the normal control and early blind groups, the topological architectures of the anatomical networks were significantly altered in the early blind subjects.
Altered topological properties of global networks in early blindness
Statistical analysis of the topological properties at the global level revealed that the early blind showed a significantly decreased degree of connectivity, a decreased global efficiency and an increased characteristic path length compared with controls. A decreased degree implies that the connections in the network are relatively sparse. The lower global efficiency and longer characteristic path length indicate that information transfer and interactions between brain regions are slower and less efficient. Considering the interactions between these three topological properties, less degree will increase the overall travel distance. In turn, as global efficiency is conceptual identical to characteristic path length, global efficiency will decrease. However, no group difference was found in normalized lambda (λ), which includes a correction for a reduced degree in the network. The non-effect on lambda may suggest that the level of efficiency itself is not reduced, but that the main effect is that a number of (vital) cortical-cortical connections are missing/reduced in the early blind. In future studies we will investigate the “relative” network properties by constraining each network with the same number of nodes and connections to further investigate the alteration of network organization in the blind subjects.
For early blind, reduced cortical-cortical connections could be related to abnormal development of the cerebral white matter due to early visual deprivation. These results are consistent with previous studies which suggested that the loss of visual experience can alter the structural organization in both the gray matter and the white matter during a critical period of neurodevelopment [35], [49]–[51]. Recently, a structural MRI study found that the early blind had decreased gray matter volume in the early visual areas, accompanied by atrophy of the optic chiasm and the optic radiation [37]. It also corresponded with the findings of a previous DTI study on the same population, showing reduced visual network integrity in the early blind [39] and the above results of reduced FA in the IFO fasciculus.
Distribution of brain regions with altered topological properties in early blindness
Since we found changes in the global topological properties, such as Lp, Eglob and Kp between the two groups, we further investigated the distributions of the regions which showed significant differences in these nodal properties. Figures 2 and 3 indicate that most of regions with disrupted topological attributes were located in the occipital lobe.
The occipital lobe contains the visual processing center of the mammalian brain. In this study, we found that the superior and middle occipital gyrus, and the cuneus were the most significantly altered regions in the occipital lobe of the early blind, with decreased degree and global efficiency and increased characteristic path length. These changes suggest that these regions have reduced connections with other brain regions compared with normally sighted subjects. Be worth mentioning, in the present study the connections of the anatomical network are related to the number of fibers to be traced from one region to another, which is largely dependent on the FA values of the white matter tracts. Both previous [39] and current DTI studies with the same dataset have revealed reduced FA in the visual tracts, such as the optic radiation and IFO fasciculus of the early blind, Therefore, this will lead to less traceable fibers and less connectivity between regions at a group level concerning the selected threshold of 3 fibers.
Moreover, we found that the precentral gyrus, which contains the motor area, was the only region with increased degree and global efficiency in the early blind, when analyzed at a loose statistical threshold (p = 0.05). This finding indicated that the precentral gyrus had more or strengthened connections with other brain regions, therefore predicting better performance in information transfer and interaction than in sighted subjects. This finding could suggest experience-dependent compensatory plasticity [52], [53]. In the absence of visual experience, early blind subjects need more practice to perform the same routine activities of the sighted subjects, and they engage in much finer finger movements, such as tactile exploration of objects and Braille reading (all the early blind subjects), massage (12/17 early blind subjects) and piano or guitar practicing (7/17 early blind subjects). The enhanced motor activity in early blind subjects may increase the number, diameter and in particular myelination of the relevant axons, especially during the critical early period of neurodevelopment. This result is consistent with a previous study which revealed plasticity of the corticospinal tract in the early blind [40]. It is also supported by a VBM study that found significant white matter increases in the sensory-motor system of the early blind [37].
Compared with the altered regions in Li, Ei_glob and Ki, the regions with altered Ci and Ei_loc were different and much less. For early blind, only one region with increased local efficiency and clustering coefficient was the right gyrus rectus, and this region is also changed with increased characteristic path length and reduced global efficiency. It suggests increased short connections and decreased long connections of this region. Additionally, the regions with decreased local efficiency and clustering coefficient were located in the middle and inferior temporal gyrus, which suggests the short connections within the neighbors of these regions are much reduced.
Alteration of hub regions in anatomical networks of early blind
The measurement of the betweenness centrality and the analysis of the vulnerability allowed us to identify the most critical anatomical nodes in the brain, revealing quantitative information about the global damage that could be caused by a hypothetical failure of these nodes. In this study, we used the level of betweenness centrality to identify the hub regions of the anatomical networks [8], [13]. Most of the hub regions (14 regions), such as the precuneus, putamen, hippocampus, middle temporal gyrus, superior parietal gyrus and superior frontal gyrus, were the same in both the control and early blind groups (Table 4 and 5). We found that most of the hub regions that we identified were located in the association cortex, which plays a central role in receiving convergent inputs from multiple cortical regions [43]. These findings are in accordance with several previous studies in which other researchers have identified these association cortex regions as critical nodes in both structural and functional brain networks in human [5], [8], [11], [13], [15] and nonhuman primates [2], [54], [55]. Furthermore, some regions of subcortical structures, such as the thalamus, putamen and caudate nucleus, and some limbic and paralimibic regions, such as the hippocampus and insula, were also revealed as the hub regions of the anatomical networks, which are consistent with the findings of a previous DTI study [11].
However, compared with the normal control group, the early blind group lacked five hub regions, i.e. left middle occipital gyrus, right superior occipital gyrus, left inferior fronto-orbital gyrus, left inferior fronto-triangular gyrus and left thalamus. This suggests a decreased importance of the frontal and occipital regions or their connections in the early blind. In order to examine the relationship between the disruption of local white matter and the abnormal nodal properties, we reconstructed the long-distance anatomical connections (IFO fasciculus) which connect the inferior frontal lobe with the occipital lobe. By comparing the FA values of the IFO fasciculi between groups, we found that the early blind subjects had significantly lower FA values in the IFO fasciculi than did sighted subjects. This difference suggests a degree of disrupted integrity of the white matter tract. Previous DTI studies using the same dataset revealed disrupted integrity of the optic radiation [39] and plastic changes in the corticospinal tract [40] of the early blind. All these results suggest that local diffusion changes in the white matter can be revealed by the graph theoretical analysis of the anatomical network.
Two hub regions, the right postcentral gyrus and the right caudate nucleus, appeared in the early blind group, but not in the control group. This finding suggests that these two regions have important global roles in the early blind. The postcentral gyrus is known as the primary somatosensory cortex [56], [57]. As we discussed above, early blind subjects are likely to engage in more frequent tactile exploration of objects and in Braille reading than are sighted subjects. This may enhance the somatosensory ability of the early blind. Therefore, an increased importance of the postcentral gyrus in the anatomical network may suggest an experience-dependent compensatory plasticity due to early visual deprivation [34], [52], [53]. The other hub region, the caudate nucleus, together with the putamen, composes the dorsal striatum, which is the gateway to the basal ganglia. The dorsal striatum receives convergent excitatory afferents from the cortex and the thalamus and is the origin of the basal ganglia circuits involved in motor control [58], [59]. Although no study has investigated structural or functional changes in the caudate nucleus in the early blind, we speculate that the increased betweenness centrality of the caudate nucleus in the anatomical network demonstrates the functional importance of motor control for the early blind as a result of visual loss. This may also suggest striatal plasticity, which has been reported in previous studies [60], [61].
Functional relevance
Previous neuroimaging studies have focused on functional reorganization following blindness. The visual cortex of the early blind was activated during performing different tasks, such as language processing [62]–[64], tactile discrimination [65]–[67], auditory stimuli [68], [69] or when working on higher cognitive tasks [63]. The recruitment of regions that typically respond to visual stimuli has been attributed to altered connectivity between primary visual areas and brain regions subserving other sensory modalities [70]. Recently, functional MRI studies have demonstrated a general loss of functional connectivity in the early blind [36], [41], which has a correspondence with the reduced cortical-cortical connections revealed in this study. It is also suggested the resting-state functional connectivity is constrained by the anatomical structure of the human cerebral cortex [71]. In future studies, we will investigate the functional networks of the early blind to further address the relationship between altered structural and functional properties of the human brain network.
Methodological issues
The most essential elements of a network are the nodes and edges. The definition of the nodes and edges has a great effect on the constructed network. Therefore, we need to address some methodological issues about how we carried out the network construction:
First, because this is an exploratory study, we applied the AAL template and automatic registration by the software of statistical parametric mapping (SPM, http://www.fil.ion.ucl.ac.uk/spm) to define the nodes for each subject's network. Previous researchers have proposed different parcellation strategies for the cerebral cortex [5], [8], [12], [15]. And one fMRI study, by employing different parcellation schemes to construct the functional networks, suggested that the topological organization of the brain network can be affected by the brain parcellation atlases [72]. Recently, Hagmann et al. have proposed a more fine grained representation which is defined at a voxel population level rather than a regional level to partition the cerebral cortex into thousands of regions [15]. In future studies, such advanced parcellation method should be employed to investigate the brain network in specific/diseased populations, in order to localize the alterations of the topological organization more accurately. Another related concern is the registration between the template and individual images. An automatic registration technique by SPM can not guarantee an exact match of every anatomical location across the subjects, so it may cause the network nodes to have slight location errors [73]. In future studies, we will further confirm our results by applying different parcellation schemes and registration techniques.
Second, in this study, we employed deterministic DTT to define the edges of the anatomical network. However, the “fiber crossing” problem is a limitation of deterministic tractography algorithms, because the tracking always stops when it reaches fiber crossing regions with low factional anisotropy values [28]. This will result in the loss of some existing fibers, and hence some edges of the network. Recent studies have proposed advanced imaging techniques, such as DSI [74], [75] or high angular resolution diffusion imaging (HARDI) with Q-ball reconstruction of multiple fiber orientations [76], [77], for solving the “fiber crossing” problem. Another limitation of deterministic tractography, especially for long-distance fiber bundles, is erroneous tracking results due to noise and resolution limitations [28]. To solve this issue, several researchers have used probabilistic fiber tracking algorithms [30], [78], [79]. By modeling a probability distribution of the fiber orientations within a voxel, these statistical methods can identify fiber connections missed by deterministic tracking approaches. However, the number of gradient directions in our diffusion dataset is not sufficient to accurately estimate the probability density function of the fiber orientations. Therefore, future studies with more advanced diffusion imaging techniques or tractography methods could yield a more complete and accurate anatomical network for each subject.
Another issue about the choice of a binary or weighted network needs addressing. For a weighted network, a challenge is to decide on the most representative measure of structural connectivity. Several candidate measures, such as fiber numbers, mean fiber length, fiber density, and mean fraction anisotropy can be selected as the connectivity measure [9], [31], [80]. But the physiological meaning of these measures is unclear. It is also hard to validate which measure describes the information transfer of neural signals most accurately. In this work, we constructed the binary network by just taking into consideration the existence/absence of regional connections. However, a weighted network with a proper connectivity measure may better reflect network changes in specific/diseased populations.
Materials and Methods
Subjects
This study included 17 early blind subjects (10 males, 7 females; mean age 22 years, range 16–29 years) and 17 age and gender-matched normally sighted controls (10 males, 7 females; mean age 23 years, range 19–28 years). All blind subjects were recruited from the Special Education College of Beijing Union University. Onset of blindness was at birth or within the first year of life for all blind individuals. The demographic data of the early blind are shown in Table 1. All participants were right-handed, based on the Edinburgh handedness inventory [81]. Each participant provided written informed consent before their MRI examination, and the Medical Research Ethics Committee of Xuanwu Hospital of Capital Medical University approved the study. We used this dataset in one of our previous studies on early blindness, which focused on the diffusion changes of the white matter in early blind subjects [39].
Data acquisition
DTI was performed with a 3.0 T Siemens Trio MR system using a standard head coil. Head motion was minimized with restraining foam pads provided by the manufacturer. Diffusion weighted images were acquired employing a single-shot echo planar imaging (EPI) sequence in alignment with the anterior-posterior commissural plane. The Integral Parallel Acquisition Technique (iPAT) was used with an acceleration factor of 2. Acquisition time and image distortion from susceptibility artifacts can be reduced by the iPAT method. Diffusion sensitizing gradients were applied along 12 non-linear directions (b = 1000 s/mm2) together with an acquisition without diffusion weighting (b = 0 s/mm2). The imaging parameters were 45 continuous axial slices with a slice thickness of 3 mm and no gap, field of view = 256 mm×256 mm, repetition time/echo time = 6000/87 ms, acquisition matrix = 128×128. The reconstruction matrix was 256×256, resulting in an in-plane resolution of 1 mm×1 mm. For each participant, a sagittal T1-weighted 3D image was also collected using a magnetization prepared rapid gradient echo (MP-RAGE) sequence. The imaging parameters for this were a field of view of 22 cm, repetition time/echo time = 24/6 ms, flip angle = 35° and voxel-dimensions of 1 mm×1 mm×1 mm.
Data preprocessing
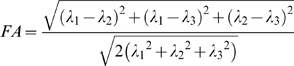
Image distortions and motion artifacts in the DTI dataset were corrected by applying affine alignment of each diffusion-weighted image to the b = 0 image, using FMRIB's Diffusion Toolbox (FSL, version 3.3; www.fmrib.ox.ac.uk/fsl). After this process, the diffusion tensor elements were estimated by solving the Stejskal and Tanner equation [23], [24], and then the reconstructed tensor matrix was diagonalized to obtain three eigenvalues (λ1, λ2, λ3) and eigenvectors. The FA of each voxel was calculated according to the following formula:
 |
DTT was implemented with DTIstudio, Version 2.40 software (H. Jiang, S. Mori; Johns Hopkins University), by using the “fiber assignment by continuous tracking” method [82]. All tracts in the dataset were computed by seeding each voxel with an FA greater than 0.2. Tractography was terminated if it turned an angle greater than 50 degrees or reached a voxel with an FA less than 0.2 [83].
Construction of anatomical networks
We constructed an anatomical network for each subject based on fiber connectivity from DTT with the main procedures as follows: First, we automatically segmented the cerebrum into 90 cortical and subcortical regions (45 for each hemisphere, regions of cerebellum were excluded, see Table 2) using the AAL template (see Gong et al. 2009 for details), which has been used in several previous studies [5], [11], [12], [17], [84]–[86]. Each region represents a node of the network. Second, we used the streamline fiber tracking method to obtain a map of all the fibers in the brain. If at least three fibers had their end-points in regions u and v, we connected the two nodes, u and v, with an edge. A threshold of three fibers ensured that the average size of the largest connected component of the network was 90 across all subjects. The number of fibers between regions only indicated the existence/absence of an edge. In this way we constructed a binarized anatomical network for each subject and represented it in a symmetric 90×90 matrix.
Graph theoretical analysis
We investigated the topological properties of the anatomical network at the global and regional (nodal) levels, quantifying the global network architecture in terms of the small-worldness, clustering coefficient (Cp), characteristic path length (Lp), local efficiency (Eloc) and global efficiency (Eglob) of the whole brain network. We described the regional properties in terms of degree (Ki), clustering coefficient (Ci), shortest path length (Li), local efficiency (Ei_loc), global efficiency (Ei_glob), betweenness centrality (Bi) and vulnerability (Vi) of the node i. Based on the constructed anatomical network of each subject, we looked for significant differences in global and nodal properties between the normally sighted and early blind groups.
Topological properties of the network
Because we constructed an N×N (N = 90) binary graph, consisting of the nodes (brain regions) and undirected edges between nodes for each subject, here we only provide brief, formal definitions of each of the network properties used in this study.
Degree, clustering coefficient, shortest path length, and small-worldness
The degree Ki of a node i is defined as the number of connections to that node. Highly connected nodes have a large degree. The degree Kp of a graph is the average of the degrees of all nodes in the graph:
which is a measure that is used to evaluate the degree of sparsity of a network.
The clustering coefficient Ci of a node i is defined as the number of existing connections among the node's neighbors divided by all their possible connections:
where Ei is the number of existing connections among the node's neighbors [33]. The clustering coefficient of a network is the average of the clustering coefficient of all nodes:
in which Cp quantifies the extent of local cliquishness or local efficiency of information transfer of a network [33], [87].
The mean shortest path length Li of a node i is:
in which Li,j is the smallest number of edges that must be traversed to make a connection between node i and node j. The characteristic path length of a network is the average of the shortest path length between the nodes:
in which Lp quantifies the ability to propagate parallel information or global efficiency (in terms of 1/Lp) of a network [87].
The concept of “small-world” was originally proposed by Watts and Strogatz [33]. Compared with random networks, small-world networks have similar characteristic path lengths but higher clustering coefficients, that is
where the  and
and  are the characteristic path length and clustering coefficient of the real network, the
  and
and  are the mean characteristic path length and clustering coefficient of 100 matched random networks that preserve the same number of nodes, edges, and degree distribution as the real network [2], [88]. These two conditions can be summarized into a scalar quantitative measurement, small-worldness,
which is typically greater than 1 for small-world networks [5], [8], [12], [89].
Network efficiency
Small-world networks are very efficient in terms of global and local communication. They have high global efficiency Eglob and local efficiency Eloc [17], [87].
The global efficiency Ei_glob of a node i is defined as:
The global efficiency of the network Eglob, a measure of the global efficiency of the parallel information transfer in the network, is defined by the inverse of the “harmonic mean” of the shortest path length between pairs of nodes:
The local efficiency Ei_loc of a node i can be calculated as:
where the subgraph Gi is the set of nodes that are the direct neighbors of the node i. This measure reveals how much the network is fault tolerant, showing how efficient the communication is among the first neighbors of the node i when it is removed. The mean local efficiency of a graph is defined as:
which is the mean of the local efficiency of all the nodes in the graph.
Betweenness centrality and vulnerability
Betweenness centrality is widely used to identify the most central nodes in a network, which are associated to those nodes that act as bridges between the other nodes. The betweenness Bi of a node i is defined as the number of shortest paths between pairs of other nodes that pass through the node i [90], [91]. The normalized betweenness bi was then calculated as:
The nodes with the largest normalized betweenness values were considered to be pivotal nodes (i.e., hubs) in the network. Specifically, nodes were identified as hubs in the network if bi was greater than 1.5 times the average betweenness of the network (i.e., bi>1.5mean) [92].
The vulnerability analysis can quantitatively measure the damage on the network performance caused by the hypothetical failure of its elements [93]. The vulnerability Vi of a node i is defined as the changes in global efficiency of the network when node i and its edges are removed. The vulnerability can be calculated as:
where Eglob' is the global efficiency of the network after removing node i and its edges. Vulnerability is also an important measure as betweenness centrality for characterizing the influence of nodes in a network. Group differences in Bi and Vi reflect the effects of the disease on the global roles of regions in the anatomical network.
Backbone network of each group
The backbone network across the population of each group was calculated using Gong's method [13]. Non-parametric one-tailed sign tests (p = 10−4, uncorrected) were applied to identify the consistent anatomical connections in each group.
Reconstruction of inferior fronto-occipital fasciculus
Based on anatomical knowledge of fiber projections, several studies have suggested tracking protocols for the IFO fasciculus [94]–[96]. According to the published tracking protocols, we identified the first ROI at the middle point between the posterior edge of the cingulun and the posterior edge of the parieto-occipital sulcus on a coronal slice [95]. For the second ROI, a coronal slice is selected at the anterior edge of the genu of corpus collasum and the entire hemisphere is delineated [95]. All ROIs were identified on the individual's FA-weighted color maps. Fiber bundles that passed through both ROIs were selected as belonging to the IFO fasciculus.
For each subject, we can reconstruct the bilateral IFO fasciculi successfully (Figure 5). After that, we calculated the mean FA for each fiber tract by averaging the FA values across the voxels that form the three-dimensional tracts derived from tractography. Then we compared the mean FA values of the bilateral IFO fasciculi between the normal control and early blind groups.
Statistical analysis
Based on the binary network constructed for each subject, we performed statistical comparisons of the Lp, Cp, Eglob, Eloc and Kp values of the global networks between groups using a two-sample two-tailed t-test with a threshold of p = 0.05. Furthermore, we investigated the distributions of the regions which showed significant differences in their nodal properties.
We first calculated the mean FA values of the IFO fasciculus for each hemisphere of each subject. A two-factor analysis of variance (ANOVA) (group as a between-subjects factor and hemisphere as a within-subject factor) was used to assess between-group differences in FA values. The tests were considered significant when the p values were less than 0.05 (two-tailed).
Acknowledgments
We appreciate the English language assistance of Drs. Rhoda E. and Edmund F. Perozzi.
Footnotes
Competing Interests: The authors have declared that no competing interests exist.
Funding: This work was supported by the Natural Science Foundation of China, Grant Nos. 30730035 and 30870694; the National Key Basic Research and Development Program (973) of China, Grant No. 2004CB318107; the External Cooperation Program of the Chinese Academy of Sciences, Grant No. GJHZ200826; the Program for New Century Excellent Talents in University, No. NCET-07-0568; and the Research Foundation for the Winner of CAS President's Award. The funders had no role in study design, data collection and analysis, decision to publish, or preparation of the manuscript.
References
- 1.Sporns O, Chialvo DR, Kaiser M, Hilgetag CC. Organization, development and function of complex brain networks. Trends Cogn Sci. 2004;8:418–425. doi: 10.1016/j.tics.2004.07.008. [DOI] [PubMed] [Google Scholar]
- 2.Sporns O, Zwi JD. The small world of the cerebral cortex. Neuroinformatics. 2004;2:145–162. doi: 10.1385/NI:2:2:145. [DOI] [PubMed] [Google Scholar]
- 3.Stam CJ. Functional connectivity patterns of human magnetoencephalographic recordings: a ‘small-world’ network? Neurosci Lett. 2004;355:25–28. doi: 10.1016/j.neulet.2003.10.063. [DOI] [PubMed] [Google Scholar]
- 4.Sporns O, Tononi G, Kotter R. The human connectome: A structural description of the human brain. PLoS Comput Biol. 2005;1:e42. doi: 10.1371/journal.pcbi.0010042. [DOI] [PMC free article] [PubMed] [Google Scholar]
- 5.Achard S, Salvador R, Whitcher B, Suckling J, Bullmore E. A resilient, low-frequency, small-world human brain functional network with highly connected association cortical hubs. J Neurosci. 2006;26:63–72. doi: 10.1523/JNEUROSCI.3874-05.2006. [DOI] [PMC free article] [PubMed] [Google Scholar]
- 6.Bassett DS, Bullmore E. Small-world brain networks. Neuroscientist. 2006;12:512–523. doi: 10.1177/1073858406293182. [DOI] [PubMed] [Google Scholar]
- 7.Sporns O, Tononi G, Edelman GM. Theoretical neuroanatomy: relating anatomical and functional connectivity in graphs and cortical connection matrices. Cereb Cortex. 2000;10:127–141. doi: 10.1093/cercor/10.2.127. [DOI] [PubMed] [Google Scholar]
- 8.He Y, Chen ZJ, Evans AC. Small-world anatomical networks in the human brain revealed by cortical thickness from MRI. Cereb Cortex. 2007;17:2407–2419. doi: 10.1093/cercor/bhl149. [DOI] [PubMed] [Google Scholar]
- 9.Hagmann P, Kurant M, Gigandet X, Thiran P, Wedeen VJ, et al. Mapping human whole-brain structural networks with diffusion MRI. PLoS ONE. 2007;2:e597. doi: 10.1371/journal.pone.0000597. [DOI] [PMC free article] [PubMed] [Google Scholar]
- 10.Bullmore E, Sporns O. Complex brain networks: graph theoretical analysis of structural and functional systems. Nat Rev Neurosci. 2009 doi: 10.1038/nrn2575. [DOI] [PubMed] [Google Scholar]
- 11.Iturria-Medina Y, Sotero RC, Canales-Rodriguez EJ, Aleman-Gomez Y, Melie-Garcia L. Studying the human brain anatomical network via diffusion-weighted MRI and Graph Theory. Neuroimage. 2008;40:1064–1076. doi: 10.1016/j.neuroimage.2007.10.060. [DOI] [PubMed] [Google Scholar]
- 12.Liu Y, Liang M, Zhou Y, He Y, Hao Y, et al. Disrupted small-world networks in schizophrenia. Brain. 2008;131:945–961. doi: 10.1093/brain/awn018. [DOI] [PubMed] [Google Scholar]
- 13.Gong G, He Y, Concha L, Lebel C, Gross DW, et al. Mapping anatomical connectivity patterns of human cerebral cortex using in vivo diffusion tensor imaging tractography. Cereb Cortex. 2009;19:524–536. doi: 10.1093/cercor/bhn102. [DOI] [PMC free article] [PubMed] [Google Scholar]
- 14.Chen ZJ, He Y, Rosa-Neto P, Germann J, Evans AC. Revealing modular architecture of human brain structural networks by using cortical thickness from MRI. Cereb Cortex. 2008;18:2374–2381. doi: 10.1093/cercor/bhn003. [DOI] [PMC free article] [PubMed] [Google Scholar]
- 15.Hagmann P, Cammoun L, Gigandet X, Meuli R, Honey CJ, et al. Mapping the structural core of human cerebral cortex. PLoS Biol. 2008;6:e159. doi: 10.1371/journal.pbio.0060159. [DOI] [PMC free article] [PubMed] [Google Scholar]
- 16.Meunier D, Achard S, Morcom A, Bullmore E. Age-related changes in modular organization of human brain functional networks. Neuroimage. 2009;44:715–723. doi: 10.1016/j.neuroimage.2008.09.062. [DOI] [PubMed] [Google Scholar]
- 17.Achard S, Bullmore E. Efficiency and cost of economical brain functional networks. PLoS Comput Biol. 2007;3:e17. doi: 10.1371/journal.pcbi.0030017. [DOI] [PMC free article] [PubMed] [Google Scholar]
- 18.Young MP. The organization of neural systems in the primate cerebral cortex. Proc Biol Sci. 1993;252:13–18. doi: 10.1098/rspb.1993.0040. [DOI] [PubMed] [Google Scholar]
- 19.Stephan KE, Kamper L, Bozkurt A, Burns GA, Young MP, et al. Advanced database methodology for the Collation of Connectivity data on the Macaque brain (CoCoMac). Philos Trans R Soc Lond B Biol Sci. 2001;356:1159–1186. doi: 10.1098/rstb.2001.0908. [DOI] [PMC free article] [PubMed] [Google Scholar]
- 20.Felleman DJ, Van Essen DC. Distributed hierarchical processing in the primate cerebral cortex. Cereb Cortex. 1991;1:1–47. doi: 10.1093/cercor/1.1.1-a. [DOI] [PubMed] [Google Scholar]
- 21.Scannell JW, Burns GA, Hilgetag CC, O'Neil MA, Young MP. The connectional organization of the cortico-thalamic system of the cat. Cereb Cortex. 1999;9:277–299. doi: 10.1093/cercor/9.3.277. [DOI] [PubMed] [Google Scholar]
- 22.Burns GA, Young MP. Analysis of the connectional organization of neural systems associated with the hippocampus in rats. Philos Trans R Soc Lond B Biol Sci. 2000;355:55–70. doi: 10.1098/rstb.2000.0549. [DOI] [PMC free article] [PubMed] [Google Scholar]
- 23.Basser PJ, Mattiello J, LeBihan D. Estimation of the effective self-diffusion tensor from the NMR spin echo. J Magn Reson B. 1994;103:247–254. doi: 10.1006/jmrb.1994.1037. [DOI] [PubMed] [Google Scholar]
- 24.Westin CF, Maier SE, Mamata H, Nabavi A, Jolesz FA, et al. Processing and visualization for diffusion tensor MRI. Med Image Anal. 2002;6:93–108. doi: 10.1016/s1361-8415(02)00053-1. [DOI] [PubMed] [Google Scholar]
- 25.Mori S, Zhang J. Principles of diffusion tensor imaging and its applications to basic neuroscience research. Neuron. 2006;51:527–539. doi: 10.1016/j.neuron.2006.08.012. [DOI] [PubMed] [Google Scholar]
- 26.Behrens TE, Johansen-Berg H, Woolrich MW, Smith SM, Wheeler-Kingshott CA, et al. Non-invasive mapping of connections between human thalamus and cortex using diffusion imaging. Nat Neurosci. 2003;6:750–757. doi: 10.1038/nn1075. [DOI] [PubMed] [Google Scholar]
- 27.Basser PJ, Pajevic S, Pierpaoli C, Duda J, Aldroubi A. In vivo fiber tractography using DT-MRI data. Magn Reson Med. 2000;44:625–632. doi: 10.1002/1522-2594(200010)44:4<625::aid-mrm17>3.0.co;2-o. [DOI] [PubMed] [Google Scholar]
- 28.Mori S, van Zijl PC. Fiber tracking: principles and strategies - a technical review. NMR Biomed. 2002;15:468–480. doi: 10.1002/nbm.781. [DOI] [PubMed] [Google Scholar]
- 29.Nucifora PG, Verma R, Lee SK, Melhem ER. Diffusion-tensor MR imaging and tractography: exploring brain microstructure and connectivity. Radiology. 2007;245:367–384. doi: 10.1148/radiol.2452060445. [DOI] [PubMed] [Google Scholar]
- 30.Parker GJ, Wheeler-Kingshott CA, Barker GJ. Estimating distributed anatomical connectivity using fast marching methods and diffusion tensor imaging. IEEE Trans Med Imaging. 2002;21:505–512. doi: 10.1109/TMI.2002.1009386. [DOI] [PubMed] [Google Scholar]
- 31.Zalesky A, Fornito A. A DTI-Derived Measure of Cortico-Cortical Connectivity. IEEE Trans Med Imaging. 2009 doi: 10.1109/TMI.2008.2012113. [DOI] [PubMed] [Google Scholar]
- 32.Tzourio-Mazoyer N, Landeau B, Papathanassiou D, Crivello F, Etard O, et al. Automated anatomical labeling of activations in SPM using a macroscopic anatomical parcellation of the MNI MRI single-subject brain. Neuroimage. 2002;15:273–289. doi: 10.1006/nimg.2001.0978. [DOI] [PubMed] [Google Scholar]
- 33.Watts DJ, Strogatz SH. Collective dynamics of ‘small-world’ networks. Nature. 1998;393:440–442. doi: 10.1038/30918. [DOI] [PubMed] [Google Scholar]
- 34.Cohen LG, Celnik P, Pascual-Leone A, Corwell B, Falz L, et al. Functional relevance of cross-modal plasticity in blind humans. Nature. 1997;389:180–183. doi: 10.1038/38278. [DOI] [PubMed] [Google Scholar]
- 35.Sur M, Leamey CA. Development and plasticity of cortical areas and networks. Nat Rev Neurosci. 2001;2:251–262. doi: 10.1038/35067562. [DOI] [PubMed] [Google Scholar]
- 36.Liu Y, Yu C, Liang M, Li J, Tian L, et al. Whole brain functional connectivity in the early blind. Brain. 2007;130:2085–2096. doi: 10.1093/brain/awm121. [DOI] [PubMed] [Google Scholar]
- 37.Noppeney U, Friston KJ, Ashburner J, Frackowiak R, Price CJ. Early visual deprivation induces structural plasticity in gray and white matter. Curr Biol. 2005;15:R488–490. doi: 10.1016/j.cub.2005.06.053. [DOI] [PubMed] [Google Scholar]
- 38.Shimony JS, Burton H, Epstein AA, McLaren DG, Sun SW, et al. Diffusion tensor imaging reveals white matter reorganization in early blind humans. Cereb Cortex. 2006;16:1653–1661. doi: 10.1093/cercor/bhj102. [DOI] [PMC free article] [PubMed] [Google Scholar]
- 39.Shu N, Li J, Li K, Yu C, Jiang T. Abnormal diffusion of cerebral white matter in early blindness. Hum Brain Mapp. 2009;30:220–227. doi: 10.1002/hbm.20507. [DOI] [PMC free article] [PubMed] [Google Scholar]
- 40.Yu C, Shu N, Li J, Qin W, Jiang T, et al. Plasticity of the corticospinal tract in early blindness revealed by quantitative analysis of fractional anisotropy based on diffusion tensor tractography. Neuroimage. 2007;36:411–417. doi: 10.1016/j.neuroimage.2007.03.003. [DOI] [PubMed] [Google Scholar]
- 41.Yu C, Liu Y, Li J, Zhou Y, Wang K, et al. Altered functional connectivity of primary visual cortex in early blindness. Hum Brain Mapp. 2008;29:533–543. doi: 10.1002/hbm.20420. [DOI] [PMC free article] [PubMed] [Google Scholar]
- 42.Jiang J, Zhu W, Shi F, Liu Y, Li J, et al. Thick visual cortex in the early blind. J Neurosci. 2009;29:2205–2211. doi: 10.1523/JNEUROSCI.5451-08.2009. [DOI] [PMC free article] [PubMed] [Google Scholar]
- 43.Mesulam MM. From sensation to cognition. Brain. 1998;121 (Pt 6):1013–1052. doi: 10.1093/brain/121.6.1013. [DOI] [PubMed] [Google Scholar]
- 44.Pan WJ, Wu G, Li CX, Lin F, Sun J, et al. Progressive atrophy in the optic pathway and visual cortex of early blind Chinese adults: A voxel-based morphometry magnetic resonance imaging study. Neuroimage. 2007;37:212–220. doi: 10.1016/j.neuroimage.2007.05.014. [DOI] [PubMed] [Google Scholar]
- 45.Micheloyannis S, Pachou E, Stam CJ, Vourkas M, Erimaki S, et al. Using graph theoretical analysis of multi channel EEG to evaluate the neural efficiency hypothesis. Neurosci Lett. 2006;402:273–277. doi: 10.1016/j.neulet.2006.04.006. [DOI] [PubMed] [Google Scholar]
- 46.Stam CJ, Jones BF, Nolte G, Breakspear M, Scheltens P. Small-world networks and functional connectivity in Alzheimer's disease. Cereb Cortex. 2007;17:92–99. doi: 10.1093/cercor/bhj127. [DOI] [PubMed] [Google Scholar]
- 47.Bassett DS, Meyer-Lindenberg A, Achard S, Duke T, Bullmore E. Adaptive reconfiguration of fractal small-world human brain functional networks. Proc Natl Acad Sci U S A. 2006;103:19518–19523. doi: 10.1073/pnas.0606005103. [DOI] [PMC free article] [PubMed] [Google Scholar]
- 48.Kaiser M, Hilgetag CC. Nonoptimal component placement, but short processing paths, due to long-distance projections in neural systems. PLoS Comput Biol. 2006;2:e95. doi: 10.1371/journal.pcbi.0020095. [DOI] [PMC free article] [PubMed] [Google Scholar]
- 49.Sengpiel F, Kind PC. The role of activity in development of the visual system. Curr Biol. 2002;12:R818–826. doi: 10.1016/s0960-9822(02)01318-0. [DOI] [PubMed] [Google Scholar]
- 50.Crair MC, Gillespie DC, Stryker MP. The role of visual experience in the development of columns in cat visual cortex. Science. 1998;279:566–570. doi: 10.1126/science.279.5350.566. [DOI] [PMC free article] [PubMed] [Google Scholar]
- 51.Hubel DH. Effects of deprivation on the visual cortex of cat and monkey. Harvey Lect. 1978;72:1–51. [PubMed] [Google Scholar]
- 52.Ptito M, Kupers R. Cross-modal plasticity in early blindness. J Integr Neurosci. 2005;4:479–488. doi: 10.1142/s0219635205000951. [DOI] [PubMed] [Google Scholar]
- 53.Gizewski ER, Gasser T, de Greiff A, Boehm A, Forsting M. Cross-modal plasticity for sensory and motor activation patterns in blind subjects. Neuroimage. 2003;19:968–975. doi: 10.1016/s1053-8119(03)00114-9. [DOI] [PubMed] [Google Scholar]
- 54.Sporns O, Honey CJ, Kotter R. Identification and classification of hubs in brain networks. PLoS ONE. 2007;2:e1049. doi: 10.1371/journal.pone.0001049. [DOI] [PMC free article] [PubMed] [Google Scholar]
- 55.Parvizi J, Van Hoesen GW, Buckwalter J, Damasio A. Neural connections of the posteromedial cortex in the macaque. Proc Natl Acad Sci U S A. 2006;103:1563–1568. doi: 10.1073/pnas.0507729103. [DOI] [PMC free article] [PubMed] [Google Scholar]
- 56.Carlson M. Characteristics of sensory deficits following lesions of Brodmann's areas 1 and 2 in the postcentral gyrus of Macaca mulatta. Brain Res. 1981;204:424–430. doi: 10.1016/0006-8993(81)90602-8. [DOI] [PubMed] [Google Scholar]
- 57.Fromm C, Wise SP, Evarts EV. Sensory response properties of pyramidal tract neurons in the precentral motor cortex and postcentral gyrus of the rhesus monkey. Exp Brain Res. 1984;54:177–185. doi: 10.1007/BF00235829. [DOI] [PubMed] [Google Scholar]
- 58.Bolam JP, Hanley JJ, Booth PA, Bevan MD. Synaptic organisation of the basal ganglia. J Anat. 2000;196 (Pt 4):527–542. doi: 10.1046/j.1469-7580.2000.19640527.x. [DOI] [PMC free article] [PubMed] [Google Scholar]
- 59.Gerfen CR. Molecular effects of dopamine on striatal-projection pathways. Trends Neurosci. 2000;23:S64–70. doi: 10.1016/s1471-1931(00)00019-7. [DOI] [PubMed] [Google Scholar]
- 60.Kreitzer AC, Malenka RC. Striatal plasticity and basal ganglia circuit function. Neuron. 2008;60:543–554. doi: 10.1016/j.neuron.2008.11.005. [DOI] [PMC free article] [PubMed] [Google Scholar]
- 61.Charpier S, Deniau JM. In vivo activity-dependent plasticity at cortico-striatal connections: evidence for physiological long-term potentiation. Proc Natl Acad Sci U S A. 1997;94:7036–7040. doi: 10.1073/pnas.94.13.7036. [DOI] [PMC free article] [PubMed] [Google Scholar]
- 62.Buchel C, Price C, Frackowiak RS, Friston K. Different activation patterns in the visual cortex of late and congenitally blind subjects. Brain. 1998;121 (Pt 3):409–419. doi: 10.1093/brain/121.3.409. [DOI] [PubMed] [Google Scholar]
- 63.Amedi A, Raz N, Pianka P, Malach R, Zohary E. Early ‘visual’ cortex activation correlates with superior verbal memory performance in the blind. Nat Neurosci. 2003;6:758–766. doi: 10.1038/nn1072. [DOI] [PubMed] [Google Scholar]
- 64.Burton H, Snyder AZ, Conturo TE, Akbudak E, Ollinger JM, et al. Adaptive changes in early and late blind: a fMRI study of Braille reading. J Neurophysiol. 2002;87:589–607. doi: 10.1152/jn.00285.2001. [DOI] [PMC free article] [PubMed] [Google Scholar]
- 65.Sadato N, Pascual-Leone A, Grafman J, Ibanez V, Deiber MP, et al. Activation of the primary visual cortex by Braille reading in blind subjects. Nature. 1996;380:526–528. doi: 10.1038/380526a0. [DOI] [PubMed] [Google Scholar]
- 66.Sadato N, Pascual-Leone A, Grafman J, Deiber MP, Ibanez V, et al. Neural networks for Braille reading by the blind. Brain. 1998;121 (Pt 7):1213–1229. doi: 10.1093/brain/121.7.1213. [DOI] [PubMed] [Google Scholar]
- 67.Burton H, McLaren DG, Sinclair RJ. Reading embossed capital letters: an fMRI study in blind and sighted individuals. Hum Brain Mapp. 2006;27:325–339. doi: 10.1002/hbm.20188. [DOI] [PMC free article] [PubMed] [Google Scholar]
- 68.Kujala T, Palva MJ, Salonen O, Alku P, Huotilainen M, et al. The role of blind humans' visual cortex in auditory change detection. Neurosci Lett. 2005;379:127–131. doi: 10.1016/j.neulet.2004.12.070. [DOI] [PubMed] [Google Scholar]
- 69.Weeks R, Horwitz B, Aziz-Sultan A, Tian B, Wessinger CM, et al. A positron emission tomographic study of auditory localization in the congenitally blind. J Neurosci. 2000;20:2664–2672. doi: 10.1523/JNEUROSCI.20-07-02664.2000. [DOI] [PMC free article] [PubMed] [Google Scholar]
- 70.Wittenberg GF, Werhahn KJ, Wassermann EM, Herscovitch P, Cohen LG. Functional connectivity between somatosensory and visual cortex in early blind humans. Eur J Neurosci. 2004;20:1923–1927. doi: 10.1111/j.1460-9568.2004.03630.x. [DOI] [PubMed] [Google Scholar]
- 71.Honey CJ, Sporns O, Cammoun L, Gigandet X, Thiran JP, et al. Predicting human resting-state functional connectivity from structural connectivity. Proc Natl Acad Sci U S A. 2009 doi: 10.1073/pnas.0811168106. [DOI] [PMC free article] [PubMed] [Google Scholar]
- 72.Wang J, Wang L, Zang Y, Yang H, Tang H, et al. Parcellation-dependent small-world brain functional networks: A resting-state fMRI study. Hum Brain Mapp. 2008 doi: 10.1002/hbm.20623. [DOI] [PMC free article] [PubMed] [Google Scholar]
- 73.Amunts K, Schleicher A, Burgel U, Mohlberg H, Uylings HB, et al. Broca's region revisited: cytoarchitecture and intersubject variability. J Comp Neurol. 1999;412:319–341. doi: 10.1002/(sici)1096-9861(19990920)412:2<319::aid-cne10>3.0.co;2-7. [DOI] [PubMed] [Google Scholar]
- 74.Wedeen VJ, Hagmann P, Tseng WY, Reese TG, Weisskoff RM. Mapping complex tissue architecture with diffusion spectrum magnetic resonance imaging. Magn Reson Med. 2005;54:1377–1386. doi: 10.1002/mrm.20642. [DOI] [PubMed] [Google Scholar]
- 75.Wedeen VJ, Wang RP, Schmahmann JD, Benner T, Tseng WY, et al. Diffusion spectrum magnetic resonance imaging (DSI) tractography of crossing fibers. Neuroimage. 2008;41:1267–1277. doi: 10.1016/j.neuroimage.2008.03.036. [DOI] [PubMed] [Google Scholar]
- 76.Tuch DS. Q-ball imaging. Magn Reson Med. 2004;52:1358–1372. doi: 10.1002/mrm.20279. [DOI] [PubMed] [Google Scholar]
- 77.Hess CP, Mukherjee P, Han ET, Xu D, Vigneron DB. Q-ball reconstruction of multimodal fiber orientations using the spherical harmonic basis. Magn Reson Med. 2006;56:104–117. doi: 10.1002/mrm.20931. [DOI] [PubMed] [Google Scholar]
- 78.Behrens TE, Woolrich MW, Jenkinson M, Johansen-Berg H, Nunes RG, et al. Characterization and propagation of uncertainty in diffusion-weighted MR imaging. Magn Reson Med. 2003;50:1077–1088. doi: 10.1002/mrm.10609. [DOI] [PubMed] [Google Scholar]
- 79.Friman O, Farneback G, Westin CF. A Bayesian approach for stochastic white matter tractography. IEEE Trans Med Imaging. 2006;25:965–978. doi: 10.1109/tmi.2006.877093. [DOI] [PubMed] [Google Scholar]
- 80.Iturria-Medina Y, Canales-Rodriguez EJ, Melie-Garcia L, Valdes-Hernandez PA, Martinez-Montes E, et al. Characterizing brain anatomical connections using diffusion weighted MRI and graph theory. Neuroimage. 2007;36:645–660. doi: 10.1016/j.neuroimage.2007.02.012. [DOI] [PubMed] [Google Scholar]
- 81.Oldfield RC. The assessment and analysis of handedness: the Edinburgh inventory. Neuropsychologia. 1971;9:97–113. doi: 10.1016/0028-3932(71)90067-4. [DOI] [PubMed] [Google Scholar]
- 82.Mori S, Crain BJ, Chacko VP, van Zijl PC. Three-dimensional tracking of axonal projections in the brain by magnetic resonance imaging. Ann Neurol. 1999;45:265–269. doi: 10.1002/1531-8249(199902)45:2<265::aid-ana21>3.0.co;2-3. [DOI] [PubMed] [Google Scholar]
- 83.Mori S, Kaufmann WE, Davatzikos C, Stieltjes B, Amodei L, et al. Imaging cortical association tracts in the human brain using diffusion-tensor-based axonal tracking. Magn Reson Med. 2002;47:215–223. doi: 10.1002/mrm.10074. [DOI] [PubMed] [Google Scholar]
- 84.Salvador R, Suckling J, Coleman MR, Pickard JD, Menon D, et al. Neurophysiological architecture of functional magnetic resonance images of human brain. Cereb Cortex. 2005;15:1332–1342. doi: 10.1093/cercor/bhi016. [DOI] [PubMed] [Google Scholar]
- 85.Salvador R, Suckling J, Schwarzbauer C, Bullmore E. Undirected graphs of frequency-dependent functional connectivity in whole brain networks. Philos Trans R Soc Lond B Biol Sci. 2005;360:937–946. doi: 10.1098/rstb.2005.1645. [DOI] [PMC free article] [PubMed] [Google Scholar]
- 86.Liang M, Zhou Y, Jiang T, Liu Z, Tian L, et al. Widespread functional disconnectivity in schizophrenia with resting-state functional magnetic resonance imaging. Neuroreport. 2006;17:209–213. doi: 10.1097/01.wnr.0000198434.06518.b8. [DOI] [PubMed] [Google Scholar]
- 87.Latora V, Marchiori M. Efficient behavior of small-world networks. Phys Rev Lett. 2001;87:198701. doi: 10.1103/PhysRevLett.87.198701. [DOI] [PubMed] [Google Scholar]
- 88.Maslov S, Sneppen K. Specificity and stability in topology of protein networks. Science. 2002;296:910–913. doi: 10.1126/science.1065103. [DOI] [PubMed] [Google Scholar]
- 89.Humphries MD, Gurney K, Prescott TJ. The brainstem reticular formation is a small-world, not scale-free, network. Proc Biol Sci. 2006;273:503–511. doi: 10.1098/rspb.2005.3354. [DOI] [PMC free article] [PubMed] [Google Scholar]
- 90.Freeman L. A set of measures of centrality based upon betweenness. Sociometry. 1977;40:35–41. [Google Scholar]
- 91.Girvan M, Newman ME. Community structure in social and biological networks. Proc Natl Acad Sci U S A. 2002;99:7821–7826. doi: 10.1073/pnas.122653799. [DOI] [PMC free article] [PubMed] [Google Scholar]
- 92.He Y, Chen Z, Evans A. Structural insights into aberrant topological patterns of large-scale cortical networks in Alzheimer's disease. J Neurosci. 2008;28:4756–4766. doi: 10.1523/JNEUROSCI.0141-08.2008. [DOI] [PMC free article] [PubMed] [Google Scholar]
- 93.Costa LF, Rodrigues FA, Travieso G, Villas Boas PR. Characterization of complex networks: A survey of measurements. Adv Phys. 2007;56:167–242. [Google Scholar]
- 94.Rodrigo S, Naggara O, Oppenheim C, Golestani N, Poupon C, et al. Human subinsular asymmetry studied by diffusion tensor imaging and fiber tracking. AJNR Am J Neuroradiol. 2007;28:1526–1531. doi: 10.3174/ajnr.A0584. [DOI] [PMC free article] [PubMed] [Google Scholar]
- 95.Wakana S, Caprihan A, Panzenboeck MM, Fallon JH, Perry M, et al. Reproducibility of quantitative tractography methods applied to cerebral white matter. Neuroimage. 2007;36:630–644. doi: 10.1016/j.neuroimage.2007.02.049. [DOI] [PMC free article] [PubMed] [Google Scholar]
- 96.Hua K, Zhang J, Wakana S, Jiang H, Li X, et al. Tract probability maps in stereotaxic spaces: Analyses of white matter anatomy and tract-specific quantification. Neuroimage. 2008;39:336–347. doi: 10.1016/j.neuroimage.2007.07.053. [DOI] [PMC free article] [PubMed] [Google Scholar]