Abstract
In this paper, we present a volume-based mucosa-based polyp candidate determination scheme for automatic polyp detection in computed colonography. Different from most of the existing computer-aided detection (CAD) methods where mucosa layer is a one-layer surface, a thick mucosa of 3-5 voxels wide fully reflecting partial volume effect is intentionally extracted, which excludes the direct applications of the traditional geometrical features. In order to address this dilemma, fast marching-based adaptive gradient/curvature and weighted integral curvature along normal directions (WICND) are developed for volume-based mucosa. In doing so, polyp candidates are optimally determined by computing and clustering these fast marching-based adaptive geometrical features. By testing on 52 patients datasets in which 26 patients were found with polyps of size 4-22 mm, both the locations and number of polyp candidates detected by WICND and previously developed linear integral curvature (LIC) were compared. The results were promising that WICND outperformed LIC mainly in two aspects: (1) the number of detected false positives was reduced from 706 to 132 on average, which significantly released our burden of machine learning in the feature space, and (2) both the sensitivity and accuracy of polyp detection have been slightly improved, especially for those polyps smaller than 5mm.
Keywords: volume-based mucosa, geometrical feature analysis, virtual colonoscopy, computer-aided detection, weighted integral curvature in normal directions (WICND)
I. Introduction
Colorectal cancer remains the second leading cause of cancer mortality in the United States [1], and American Cancer Society (ACS) estimates that there will be about 108,070 new cases of colon cancer in 2008. It has been generally recognized that early removal of the identified colon polyps is the most efficient and successful means to prevent the colorectal cancer [2]. In recent years, the use of three-dimensional (3D) imaging to produce virtual anatomic models of the colon, an emerging technique termed virtual colonoscopy (VC), provides a minimally invasive diagnostic tool for detection of colorectal polyps [3-12]. However, the major obstacles of VC, such as time-consuming case interpretation time, less diagnosis performance in terms of poor visibility, conspicuity and accuracy of polyp detection, still remain [13-16].
Computer-aided detection (CAD) of colonic polyps becomes attractive because of its potentials to overcome the above difficulties, which is offering the “second opinion” about clinically-important polyps to the radiologists. Still, applying CAD for colonic polyp detection is rather challenging due to various objective and subjective reasons: (1) varying shapes, sizes and even textures of clinically-important polyps constitute the major objective factor impacting diagnosis performance of CAD. Besides, numerous colon folds and bulk of feces with colonic lavage could mimic polypoid shapes and therefore hamper the detection rate, and (2) subjective reasons that hinder the improvements of CAD come from its input, the segmented and cleansed colon lumen obtained by either hard segmentation [17], discrete-label or continuous-space soft segmentation [18-20]. Depending upon how the partial volume effect (PVE) is interpreted, we believe that the polyps' actual sizes and geometrical shapes could possibly suffer from either incomplete or over-complete segmentation, which undoubtedly result in oversized or shrinking polyp surface. Therefore, developing partial volume-based segmentation algorithms that minimize the subjective interaction deserves researchers' higher attention.
In computed tomography (CT) imaging, colon mucosa which is the innermost surface closest to the lumen might be displayed as a stripe of 3-5 voxels wide due to significant PVE. For CAD system based on sophisticated geometrical feature analysis, the way of extracting mucosa layer directly determines the initial detection of polyp candidates. In the past several years, various mucosa extraction approaches as well as the associated feature analysis have been developed. Nappi et al. extracted the colon as a thick region that encompasses the entire colon. However, it appeared to serve the purpose of segmentation only, without presenting any volume-related geometrical features in their continuing work [21]. Summers et al. utilized many of the geometrical features on the colon wall inner surface, such as the mean, Gaussian, and principal curvatures [22-23]. Yoshida et al. and Nappi et al. further characterized the curvature measures by shape index and smoothness to distinguish the polyp candidates from the normal colon wall tissue [24-28]. Paik et al. and Kiss et al. presented another solution for the polyp detection where normal and sphere fitting as the references to extract some geometrical features on the mucosa layer [29-33]. C. van Wijk et al. developed a novel method which computed the curvatures using space-variant derivative operations in a strip along the edge of the colon [34]. Nevertheless, most of the aforementioned peer papers take either edge detection or hard thresholding as part of the segmentation to convert a thick mucosa region into a sheer surface boundary before making any geometrical analysis. Therefore such extracted geometrical measurements like gradient and curvature are believed to ignore the correlation within mucosa region in the direction of thickness, and a more sophisticated version is expected for volume-based mucosa. Another issue worth to be mentioned is the adaptability of geometrical features to the trivial variations on the colon wall. Considering the traditional gradient/curvature, the way that they are computed by fixing the number of neighbors when taking convolution operator, is prone to be affected by the neighboring geometrically-different entities. Such computational inaccuracy potentially increases the chances of false positives and negatives.
Major contributions of this paper are outlined as follows: (1) the actual thickness of the colon wall due to PVE was uniquely characterized by a volume-based mucosa of 3-5 voxels wide by employing maximum a posterior-expectation maximization (MAP-EM) segmentation algorithm [35-36, 38-39], where PVE corresponding to distinct tissue types were interpreted as percentage distribution maps, (2) geometrical features like gradient/curvature were adapted from traditional fixing-neighbor to the fast marching-based adaptive version, capable of identifying geometrically-different entities, and (3) a new technique termed “Weighted Integral Curvature along Normal Directions (WICND)” was proposed for the sake of volume-based mucosa, by which the inner and outer partners within mucosa region could communicate with each other and a more refined curvature value along normal directions was reasonably assigned. In the final step of detecting initial polyp candidates, neighboring voxels with similar geometrical features were grouped together to form the suspected patches on the colon wall, where those patches hit and missed the true polyps were called “true positive” and “false positive” respectively. A good initial detection scheme is believed to minimize false positives without any loss of true positives. When comparing to our previously-developed linear integral curvature (LIC) [40], both the sensitivity and accuracy of polyp detection were slightly improved, especially for those polyps smaller than 5mm. Most importantly, the number of reported false positives was dramatically reduced.
The remainder of this paper is organized as follows. Section II briefly summarizes the overall structure of the initial polyp detection scheme, Section III aims to give a clear picture about MAP-EM segmentation algorithm for fully interpreting PVE, and Section IV presents new geometrical features of fast marching-based adaptive gradient/curvature and WICND, followed by Section V where real patients' CT data were tested to validate the effectiveness of WICND over LIC. Finally, Section VI outlines our future work and concludes some remarks.
II. Overview of Polyp Candidate Determination Scheme
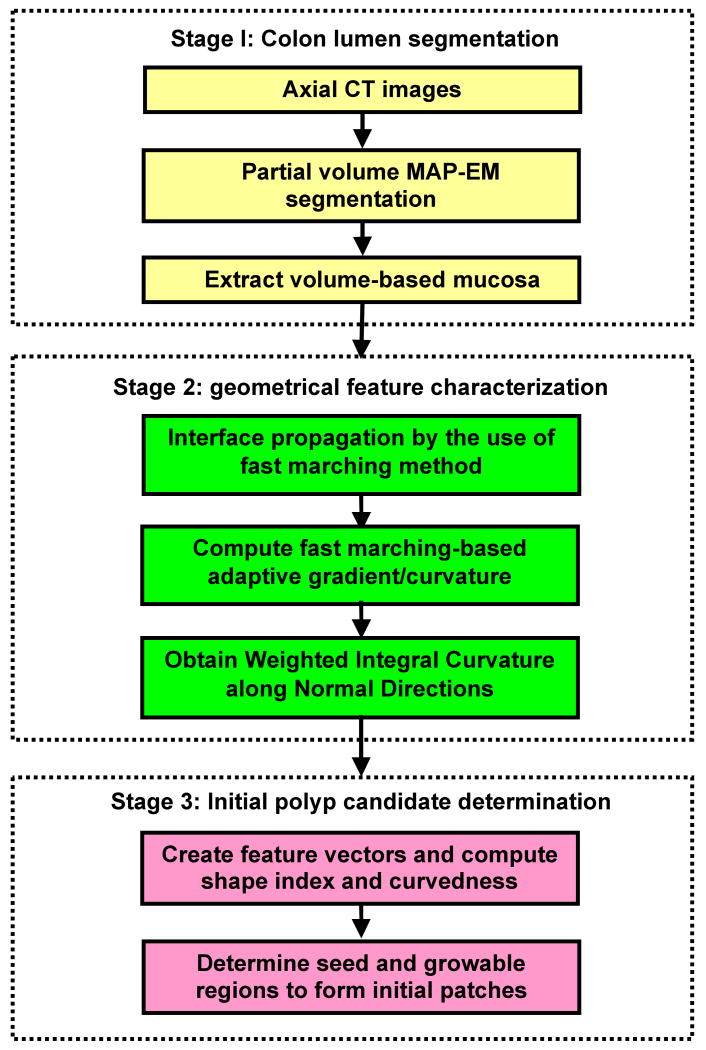
The flowchart of our initial polyp detection scheme is depicted in Figure 1 as follows. First of all, axial abdominal CT images were processed, and the colon lumen was segmented by a partial-volume MAP-EM segmentation pipeline, the core of which was an iterative expectation-maximization (EM) algorithm [35-36]. Accompanied by a well-cleansed colon lumen in CT values, four percentage distribution maps in the range of [0, 1] corresponding to air, fat, muscle and bone classes were generated as well, the less the value, the more severe PVE. Secondly, a volume-based mucosa of 3-5 voxels wide was extracted by identifying those voxels whose air class mixture percentage was between 0 and 1. Thirdly, interface propagation based on fast marching method [37] was applied to the thick mucosa, such that the fast marching-based adaptive gradient/curvature was computed by measuring the correlation between adjacent geometrical structures. After taking integral of the adaptive curvature along normal directions, a WICND value was uniquely assigned to each voxel. Finally, polyp candidates were formed by clustering all the neighboring voxels with the same geometrical properties.
Figure 1.
Schematic flowchart of polyp candidate determination.
III. Partial Volume MAP-EM Segmentation of Colon Wall
The core of partial volume-based MAP-EM segmentation pipeline is an iterative expectation-maximization (EM) algorithm as the maximum a posteriori (MAP) solution of estimating tissue mixture percentages for individual voxel. Each tissue type is assumed to follow an independent normal distribution across the field-of-view (FOV). In doing so, the summation of all tissue mixtures leads to the mean density value at one voxel, and the summation of all tissue mixtures' unobservable random processes leads to the observed image density at one voxel, which follows a normal distribution as well. By modeling the underline mixture percentages as a Markov random field, the conditional expectation of the posteriori distribution of the tissue mixtures reaches to its maximum value when proceeding from current estimation to the next update after a finite number of iterations. This MAP-EM framework provides a theoretical solution to PVE, which has been a major cause of quantitative imprecision in medical image processing. Comprehensive numerical analysis has demonstrated its effectiveness [38-39].
As a typical example, the raw CTC colon images, the cleansed colon lumen and the estimated mixture percentage map associated with air class only were shown by Figure 2 as the first, second and third rows respectively, where the brightest white area corresponds to 100% pure colon lumen, while the grey area describes how the colon percentage varies from 100% down to 0%. In terms of characterizing mucosa region, we consider directly extracting all the grey areas, without taking gradient operation or edge detection to avoid any risk of losing PVE.
Figure 2.
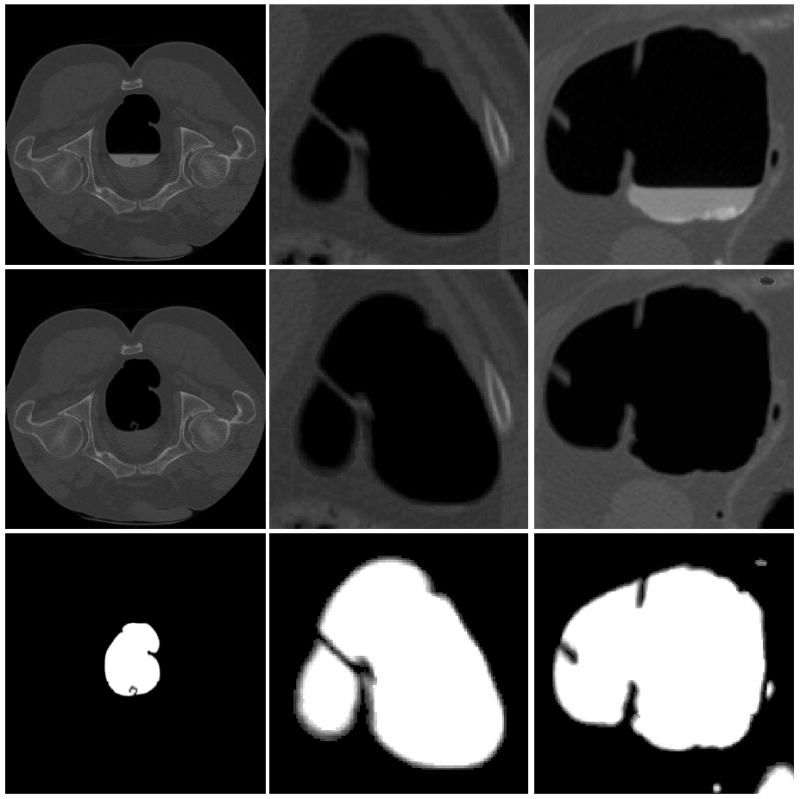
Illustration of the segmented colon lumen as well as the colon tissue mixture distribution map, with the first row corresponding to the original raw CT colon data, while the second and third rows representing the cleansed colon lumen and segmented colon mixture distribution map.
IV. Determination of Polyp Candidates
In this section, we begin with introducing the fast marching-based adaptive gradient/curvature, from its motivation, rationale to the methodology, and finally extend to the derivation of the most important geometrical feature of WICND.
A. Fast marching-based adaptive gradient/curvature
A.1. Motivation: interference caused by neighboring geometrical structures
The term “adaptive” refers to the capability of gradient/curvature to be immune to the neighboring geometrically-different structures. In other words, the “adaptive” gradient / curvature is able to differentiate the group of voxels belonging to the same structure from those voxels belonging to different geometries. Suppose we have two spheres located in the same area as shown by Figure 3(a), where a blurred area representing PVE was intentionally created for the left one while the right one was kept sharp and clean. Traditional gradient computed in the manner of fixing neighbors when taking kernel-based convolution is believed to yield irregular magnitudes as well as directions, due to the fact that the neighboring pixels belonging to the other sphere were mistakenly counted in, as illustrated by Figure 3(b). In practice, colon wall has much more complicated geometry shapes that geometrically-different structures significantly overlap within small area, and when applied to CAD, more false negatives and positives are possibly reported because of the induced computational inaccuracy.
Figure 3.
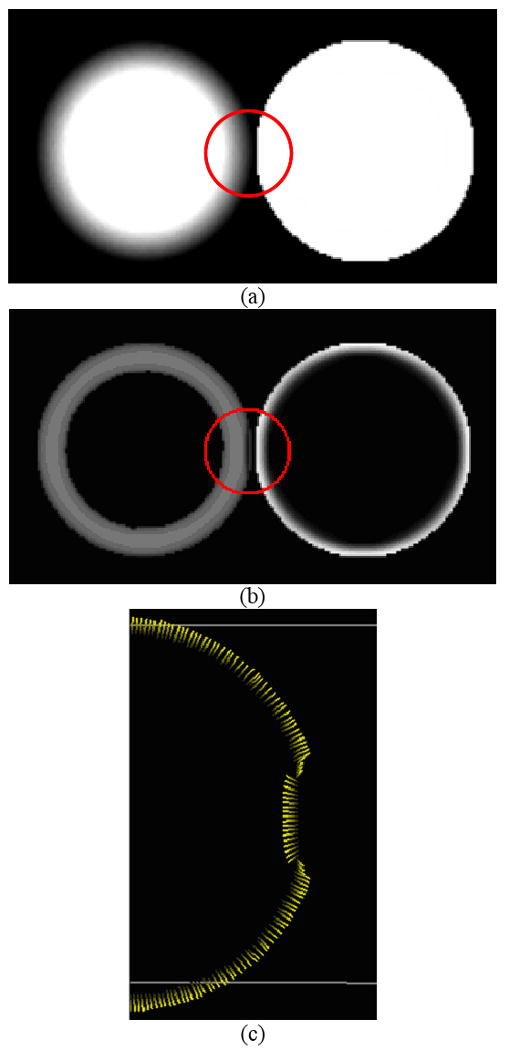
Illustration of the neighboring geometrical structure, (a) two spheres located in the same 3D images, (b) the irregular gradient magnitudes by the use of fixed neighbors, and (c) the distorted gradient directions by the use of fixed neighbors.
A.2. Rationale: interface propagation via fast marching algorithm and its application to the thick mucosa for building up an arriving-time map
Fast marching algorithm developed by Sethian in 1998 [37] is basically a solution to the problem of interface propagation, which includes burning flames, waves in water and physical boundaries. When given an arbitrary region, such as the one in Figure 4(a), the interface is defined as the curve, or surface, separating the area inside of the region from the area outside of the region, where three different velocity components are formulated to describe the strict expend or contract motion of the surface, (1) local to part of the surface, (2) global properties of the surface, and (3) independent of the surface. In practice, it is more convenient to ignore the separate directions of these velocity components and simply use a scalar-valued function F to describe the velocity normal to the interface.
Figure 4.
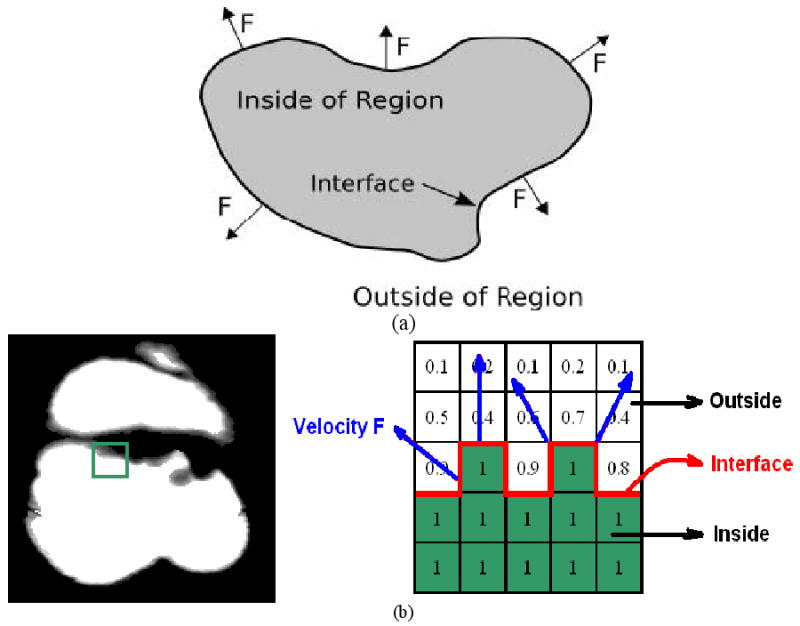
Application of fast marching method to calculate adaptive gradient/curvature, (a) definition of interface propagation, and (b) the adaptation to the case of partial volume colon wall.
When applied to the case of thick mucosa as described by the air class mixture percentage map, the problem of interface propagation could be easily built up as depicted in Figure 4(b) by defining interface as well as velocity F. As shown by Figure 4(b), the interface which is exactly the boundary between 100% colon and PVE area, is expending outward given the speed F which is defined as a constant everywhere in our study, such that an arriving time map marching from the boundary is eventually built up. The advantage of applying fast marching algorithm is the capability of identifying geometrically-different structures since the interface is marching along the shortest path, in other words, only the closest voxels to the interface are calculated when approximating the next time step values. As a result, neighboring voxels belonging to different geometrical entities are effectively excluded which exactly meets our goal.
Finally, we would like to emphasize that “interface propagation via fast marching” is not intended to delineate the boundary between colonic wall and lumen, but between geometrically different structures all belonging to colon wall, such as polyps, folds, remaining fecal and possible artifacts. When measuring local geometrical features such as gradient and curvature of a suspicious patch of a polyp candidate, the involved convolution operator often mistakenly takes other entities as part of itself, most likely the nearby folds and other small bumps located in the second-order neighboring area, which would definitely lead to the inaccurate magnitude as well as direction. This exactly stimulated the application of “interface propagation via fast marching” in differentiating among different geometrical entities on the colon wall to ensure noticeable improvement regarding computational accuracy.
A.3. Methodology: definition of fast marching-based adaptive gradient/curvature
In what follows, the derivation of fast marching-based adaptive gradient, denoted by is summarized by the following steps.
Extracting all the voxels whose air class mixture percentages are between 0% and 100%, for the purpose of maintaining the original PVE. Figure 5 fully described this process with the extracted thick mucosa highlighted in green.
Taking the boundary (highlighted by red solid line in Figure 5 as the interface to be propagated, arriving time for each voxel within the mucosa region is calculated one-by-one. As such, an arriving time map marching from the boundary is eventually built up, denoted by £. For its stopping rule, we simplified our implementation by running 10-round forward and 5-round backward fast marching process, both starting from the boundary. Given the priori knowledge about mucosa layer that it is normally 3-5 voxels thick, such a stripe of 15 voxels wide is sufficient to cover the entire mucosa region.
Given arriving time map £ generated by step (2), calculate sobel gradient for each voxel xi belonging to £ by convolving £ with sobel kernel [41], denoted by
- Finally when calculating fast marching-based adaptive gradient for voxel xj, each voxel xk located in the second-order neighboring area defined by x-, y- and z-dimensions is further inspected by measuring the inner product of , both of which come from step (3). If is smaller than pre-defined threshold ε, then voxel xk is believed to belong to geometrically-different entity, and therefore needs to be removed from the computation of . Once collecting all the 3D neighboring voxels , is computed in a manner of regular convolution [42], i.e., given a sub-image I = I(x, y, z) around voxel xj formed by its neighbors , two separable filters f0 (x), f1 (x) representing smoothing and first derivative operators used as convolution filters are used to formally compute smoothed partial derivatives
(1)
Figure 5.
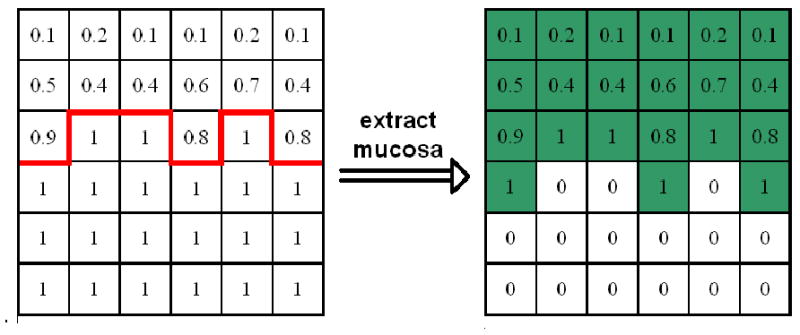
Extraction of mucosa layer with partial volume effect.
Different from standard gradient operator that considers every neighboring voxel and fixes the total number of involved neighbors when taking convolution, our new version inspects each neighbor xk one by one to see whether it satisfies or not. As a result, the number of collected {xk} varies from to with those voxels violating the criterion to be automatically removed. Following the same arguments, computing fast marching-based adaptive curvature is straightforward.
As a summary to this section, we re-tested the sample image shown in Figure 3(a) by following the above (1-4) steps for the purpose of calculating , with the new results shown in Figure 6. Compared to Figure 3, it has been demonstrated that fast marching-based adaptive gradient/curvature could efficiently identify geometrically-different structures with the improved computational accuracy in terms of both magnitudes and directions.
Figure 6.
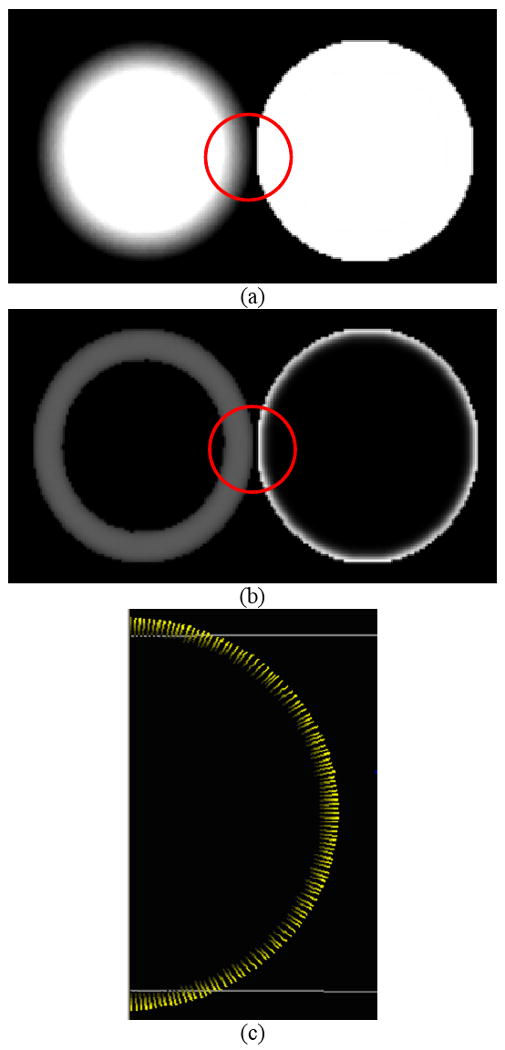
Fast marching-based adaptive gradient magnitude testing on the sample image containing two spheres, (a) two spheres located in the same 3D images, (b) corrected gradient magnitudes by fast marching-based adaptive method, and (c) corrected gradient directions by fast marching-based adaptive method.
B. Weighted integral curvature along normal directions (WICND)
B.1. Definition of the path along ± normal directions
So far, each voxel belonging to the volume-based mucosa has been uniquely assigned two geometrical feature values, fast marching-based adaptive gradient and curvature . However, those voxels on the inner and outer mucosa region along the same normal direction are still independent to each other without further communication during fast marching propagation. Different from sheer surface, the correlation between neighboring voxels in the case of thick mucosa not only exists in the first- or second-order spatial domain, but also appears along the path that is determined by normal directions, as depicted by Figure 7. Moreover, it is reasonable to claim that voxels on the inner and outer mucosa region suffer from different noise levels as well as partial volume distortions, otherwise, very close geometrical structures are supposed to be observed. Therefore, via the communication/interaction in between, fast marching-based adaptive curvatures is expected to be further smoothed and refined.
Figure 7.
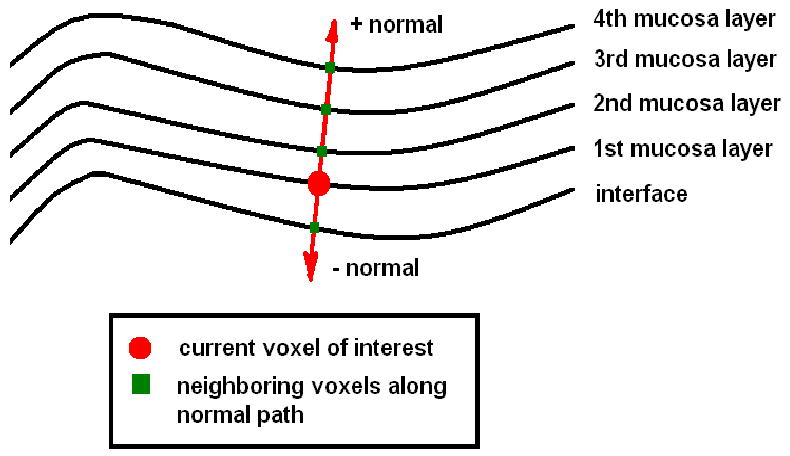
Voxels along the path determined by ± normal directions.
B.2. How to assign different weights to each voxel along the ± normal directions path
Given voxel xi, there are two associated normal directions denoted by . To assign a group of gaussian distributed weights {Wi (xj)} to each voxel xj on the path of , two parameters, i.e., relative distance and local smoothness ratio are accordingly designed to fully determine the standard deviation {σj} in the form of
| (2) |
and
| (3) |
where a, b are predefined constants.
-
Relative distance
This parameter characterizes the relative distance of voxel xj to the central voxel xi, where the distances are measured by their arriving times tj, ti via fast marching propagation. The farther voxel xj to voxel xi, the smaller the relative distance, and vice versa. Therefore is represented by(4) -
Local smoothness ratio
Another parameter that affects σj is to measure the local smoothness of voxel xj relative to the global smoothness change along . Given a small group of samples with similar properties, removing any of them is not supposed to have dramatic changes on the whole, which inspires the definition of local smoothness ratio as follows
where n denotes the total number of {xj} along , and θjk is the measure of correlation between fast marching-based adaptive gradients of voxels xj and xk along respectively, that is(5) (6)
It is noted that, the numerator of Eq.(5) describes the smoothness of remaining normal path after removing voxel j from , while the denominator of Eq.(5) always represents the global smoothness of . Therefore, it is reasonable to claim that is intended to capture the local smoothness of voxel xj relative to the global path of . The smoother voxel xj compared to the global path , the closer to value 1.
For real CT colon data where mucosa is normally 3-5 voxels thick, the local property especially the smoothness variation, still could be reflected to some extent by Eq. (5). For the simplest case that we only have three points, Eq. (5) could give us a hint on whether these three points are aligned in a row or in the form of a triangular by inspecting 3 possible combinations. For the case of five points, Eq. (5) is going to check all the 10 combinations before generating a score implying the degree of smoothness.
Based on the arguments outlined by (2)-(6), the definition of weighted integral curvature along normal directions (WICND) in continuous space is straightforward.
| (7) |
where is the fast marching-based adaptive curvature of current voxel x j.
In our previous work [40], Wang et al. proposed a linear integral curvature (LIC) aiming to reflect a more general “tendency” by taking integral along principle curvature directions. As a comparison, our newly proposed WICND has the following advantages.
WICND bridges the gap between voxels on the inner and outer mucosa region along the normal direction path, such that the in-between communication could further smooth and refine . However, LIC still focused on the correlation in the first- and second-order spatial domain, ignoring extra correlation in the thickness direction.
Instead of using the fixing-parameter convolution kernel as LIC did, WICND takes even more adaptive scheme to self-adjust its Gaussian kernel by introducing two parameters, and , which reflect the relative distance and local smoothness ratio respectively.
As a concluding remark to this section, other geometrical features like curvedness and shape index [24] could be further calculated based on WICND, which also inherit the adaptability as well as immunity to the neighboring geometrically-different structures. Therefore, such group of fast marching-based adaptive geometrical features including gradient, curvature, curvedness and shape index, could characterize and sort out polyp candidates by the use of clustering algorithm.
V. Experimental Results
In what follows, the efficiency of the proposed WICND was evaluated by 52 patient datasets downloaded from the website of the VC Screening Resource Center (https://imaging.nci.nih.gov/ncia/). For each patient, two CT images were acquired from the supine and prone positions, represented by two volume images of more than 300 slices of 512×512 array size each. Among the 26 patients where polyps were found, via VC navigation, the total number of polyps whose size were larger or equal to 10mm is 24, 41 between 5mm and 10mm, and 24 even smaller than 5mm. The largest one was measured with a size of 22cm.
Each patient data was first segmented by partial volume-based MAP-EM algorithm, followed by volume-based mucosa extraction as described in Section III. Secondly, fast marching-based gradient and curvature , as well as our proposed WICND, were computed individually following the steps outlined in Section IV. Finally, simple clustering rule minimizing the number of missing polyps or false negative was applied by considering shape index and curvedness as the feature vector [24], which could be briefly summarized into the following steps, (1) voxels that have shape index and curvedness between a predefined range, are selected as seed regions, (2) starting with seed regions, a growable region by clustering spatially connected voxels to the seed regions are designated as candidate patches with their shape index and curvedness within the predefined minimum and maximum values. Since the topic of this paper is the initial polyp detection as the first step of CAD, finding a single group of parameters that is robust and optimum to all those 26 data sets is our ultimate goal. Table 1 summarized the threshold values for determining both seed and growable regions.
Table 1.
Threshold values for determining both seed and growable regions
| Shape index | curvedness | |
|---|---|---|
| Seed region | (0, 0.125) | (0.02, 0.5) |
| Growable region | (0, 0.255) | (0.01, 0.6) |
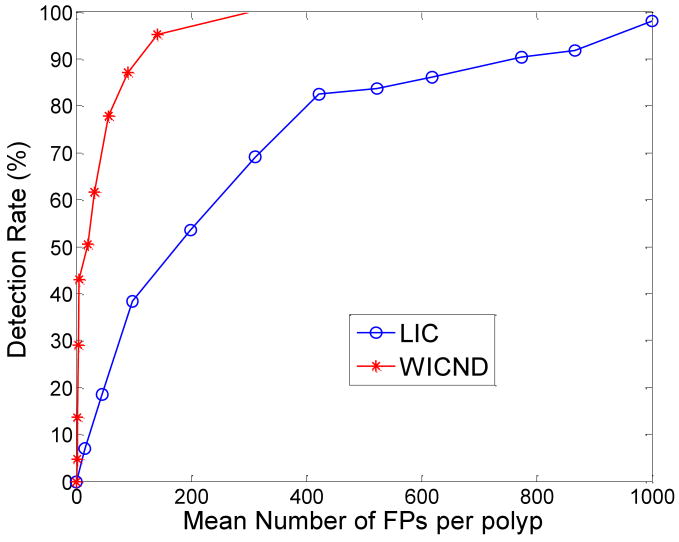
WICND versus our previously developed LIC based on two scanning positions, supine and prone, were summarized by Tables 2 in terms of by-polyp detection rate. Besides, some practical issues like computational complexity, the parameters involved and also the sensitivity are discussed as well. In addition, by altering shape index and curvedness thresholds, two FROC curves shown in Figure 8 corresponding to WICND and LIC respectively were plotted whose comparison result was in great favor of WICND.
Table 2.
Performance of WICND versus LIC
| Size of polyps | Detection Rate of WICND | Detection rate of Previous LIC | ||
|---|---|---|---|---|
| Supine | Prone | Supine | Prone | |
| Large polyps (>=10mm) | 100% | 100% | 100% | 100% |
| median polyps (5mm-10mm) | 100% | 89.5% | 95.2% | 95% |
| Small polyps (<5mm) | 91.7% | 75% | 75% | 58.3% |
Figure 8.
FROC curves corresponding to WICND and LIC, which favor the use of WICND.
Some comments are accordingly drawn as follows:
We did notice some differences between prone and supine data when testing WICND according to Table 2. For those medium-sized polyps, the listed sensitivities of WICND for prone cases were slightly, not significantly inferior to that for supine cases, and the possible explanations could be summarized into four factors, (1) we believe that gravity plays a partial role in affecting prone cases where polyps might have been distorted a little bit in terms of shape, (2) by altering parameter set, we occasionally encountered the cases that prone outperformed supine, (3) the VC data sample pool was not large enough to reach a general conclusion, and (4) the training samples for finding optimal parameter set were exactly the same as testing samples for getting preliminary results as listed in Table 2-3. Therefore, we are going to test more patient data in our future work for making more general evaluations regarding WICND. Generally speaking, WICND has improved the by-polyp detection rate when compared to LIC, especially for small and medium sized polyps. For the sake of by-patient detection rate, numerical analysis showed that both WICND and previous LIC achieved 100% accuracy.
In terms of averaged number of false positives, we have four choices depending upon different combinations, (1) traditional fix-neighbor gradient/curvature only, (2) fast marching-based adaptive gradient/curvature only, (3) our previous LIC, and (4) newly proposed WICND which includes case (2) already. For those 26 patient datasets with polyps, the resulting numbers of false positives are listed in Table 3, which showed that WICND did a great job in reducing false positives with minimum number of false positives of 132. Even compared to case (2) where fast marching-based adaptive gradient/curvature was employed, the improvement was as high as 20%. Therefore, the effectiveness of WICND makes our future work of feature extraction/selection as well as machine learning, become much easier.
For the sake of computational complexity, WICND is much faster than LIC due to the fact that the integral path of WICND along normal direction is generally much shorter than that of LIC along curvature directions. More specifically, the typical thickness of mucosa region is between 3-5 voxels, while for LIC, it is manually and empirically set. More specifically, different line lengths are designed for different sizes of polyps, which is practically set to 20mm. Such long integral length along curvature directions of our previous LIC considerably increased the computational complexity.
Those polyps that are prone to be missed by either WICND or previous LIC can be briefly summarized into the following categories, (1) sizes are too small. Throughout our experiments, polyps no larger than 5mm account for most of the missing cases, (2) irregular or incomplete shapes, for example, only portion of the shape are exposed or polyp itself has already been distorted by neighboring structures as illustrated by Figure 9 as follows.
Finally, in order to demonstrate that the performance of 132 false positives per polyp by WICND in determining initial polyp candidates could be further improved and reach at a clinical acceptance of 3-10 false positives, we would like to emphasize the strength of a much more sophisticated machine learning scheme other than standard classification as proposed by our group in Wang's work [35], where an ellipsoid model was constructed for each initial polyp candidate and three features, geometrical, CT intensity distribution or texture, and morphological features were extracted from the constructed ROI, followed by a two-level classifier to reduce false positives in the initial patches, instead of a standard classifier. It has been validated that, for such a delicate classifier combined with LIC, the mean number of false positives per polyp was nearly 2.8 while maintaining 100% polyp detection sensitivity, even though its averaged number of initially determined polyp candidates was as high as 706 via our testing. In addition, both LIC and the delicate classification scheme developed by Wang et al. were essentially working on sheer surface-oriented features, which is the reason why we could not achieve the best performance by directly transferring to the case of volume-based mucosa as we discussed in this paper. Therefore, designing a new classification scheme for dealing with volume-based features is our major concern and currently under investigation. In summary, it is encouraging to see that the initial detection performance has been significantly improved by reducing the mean number of FPs from 706 to 132 by case when comparing WICND to LIC. Validated by our previous classification scheme [40], we strongly believe that the current 132 false positives could be further reduced by a factor of 13-44 with our well-designed classifier.
Table 3.
Number of false positives from four different choices for detecting polyps
| fix-neighbor gradient /curvature | fast marching-based adaptive gradient/curvature | LIC | WICND | |
|---|---|---|---|---|
| Averaged number of False positives | 531 | 163 | 706 | 132 |
Figure 9.
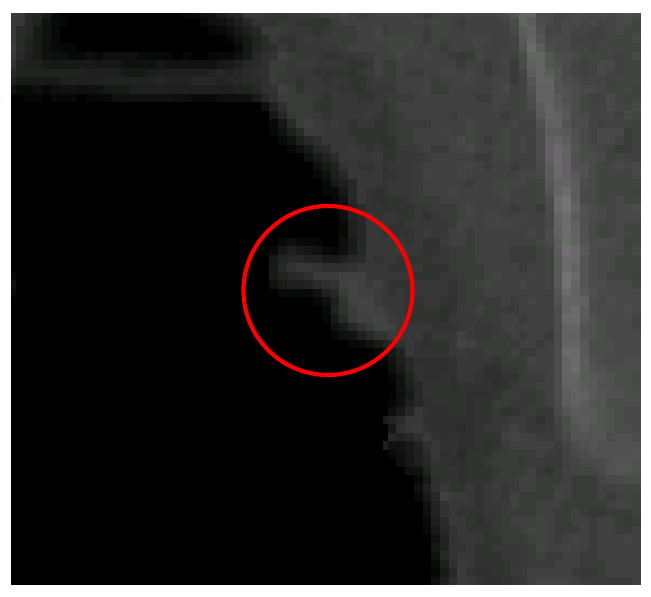
An example of distorted polyp by neighboring folds.
VI. Discussion and Future Work
In this paper, we proposed a new fast marching-based adaptive curvature algorithm, referred to as weighted integral curvature along normal directions (WICND), which is based on fast marching interface propagation method and aims to connect voxels on the inner and outer mucosa layer together by taking weighted integral along normal direction. Followed by a clustering algorithm to group voxels with close geometrical features, a polyp candidate determination scheme is built up for final automatic polyp detection. With minimum number of false positive patches without any significant loss of true positive polyps, our proposed polyp detection scheme is believed to outperform other methods, which greatly release the burden of following false positive reduction module.
Still in some extreme cases where polyps might hidden behind polyps, or partly buried by surrounding tissues, our proposed WICND could not detect them either. In dealing with these abnormal cases, more efforts should be put onto the preprocessing cleansing part and anatomical analysis as well.
Finally, our future work can be categorized into two aspects, (1) to investigate more geometrical or texture features based on volume-based mucosa, and (2) to design a supervised/unsupervised pattern recognition learning module to realize feature selection and training, avoiding the possible occurrence of “curse of dimension”. Although linear discrimination for training internal features has been investigated in our previous work, it has been found out that this linear discriminator could not automatically identify which feature is more important, and which is less. Our future work is to take this challenge, if necessary, nonlinear discriminator would be seriously taken.
Acknowledgments
This work was partly supported by NIH Grant #CA082402 and #CA120917 of the National Cancer Institute. H. Lu was supported by the National Nature Science Foundation of China under Grant 30470490.
References
- 1.O'Brien MJ, Winawer SJ, Zauber AG, Gottlieb LS, Sternberg SS, Diaz B, Dickersin GR, Ewing, Geller S, Kasimian D et al. The national polyp study: Patient and polyp characteristics associated with high-grade dysplasia in colorectal adenomas. Gastroenterology. 1990;98:371–379. [PubMed] [Google Scholar]
- 2.Winawer SJ, Fletcher RH, Miller L, Godlee F, Stolar MH, Mulrow CD, Woolf SH, Glick SN, Ganiats TG, Bond JH, Rosen L, Zapka JG, Olsen SJ, Giardiello FM, Sisk JE, Van Antwerp R, Brown-Davis C, Marciniak DA, Mayer RJ. Colorectal cancer screening: Clinical guidelines and rationale. Gastroenterology. 1997;112:594–642. doi: 10.1053/gast.1997.v112.agast970594. [DOI] [PubMed] [Google Scholar]
- 3.Coin C, Wollett F, Coin J, Rowland M, Deramos R, Dandrea R. Computerized radiology of the colon: A potential screening technique. Comput Radiology. 1983;7(1):215–221. doi: 10.1016/0730-4862(83)90145-2. [DOI] [PubMed] [Google Scholar]
- 4.Vining D, Gelfand D, Bechtold R, Scharling E, Grishaw E, Shifrin R. Annual Meeting of American Roentgen Ray Society. New Orleans: 1994. Technical feasibility of colon imaging with helical CT and virtual reality; p. 104. [Google Scholar]
- 5.Lorensen W, Jolesz F, Kikinis R. Interactive Tech and New Med Paradigm for Health Care. IOS Press; Washington DC: 1995. The exploration of cross-sectional data with a virtual endoscope; pp. 221–230. [Google Scholar]
- 6.Hong L, Kaufman A, Wei Y, Viswambharan A, Wax M, Liang Z. IEEE Symposium on Frontier in Biomedical Visualization. IEEE CS Press; Los Alamitos: 1995. 3D virtual colonoscopy; pp. 26–32. [Google Scholar]
- 7.Hong L, Liang Z, Viswambharant A, Kaufman A, Wax M. Reconstruction and visualization of 3D models of colonic surface. IEEE Transactions on Nuclear Science. 1997;44(3):1297–1302. [Google Scholar]
- 8.Hong L, Muraki S, Kaufman A, Bartz D, He T. Virtual voyage: Interactive navigation in the human colon. Computer Graphics Proceedings, Annual Conference Series, SIGGRAPH. 1997:27–34. [Google Scholar]
- 9.Pickharder P, Choi J, Hwang I, Butler J, Puckett M, Hildebrandt H, Wong R, Nugent P, Mysliwiec P, Schindler W. Computed tomographic virtual colonoscopy to screen for colorectal neoplasia in asymptomatic adults. New England Journal of Medicine. 2003;349(23):2191–2200. doi: 10.1056/NEJMoa031618. [DOI] [PubMed] [Google Scholar]
- 10.Yee J, Akerkar G, Hung R, Steinauer-Gebauer A, Wall S, McQuaid K. Colorectal neoplasia: performance characteristics of CT colonoscopy for detection in 300 patients. Radiology. 2001;219(2):685–692. doi: 10.1148/radiology.219.3.r01jn40685. [DOI] [PubMed] [Google Scholar]
- 11.Johnson D, Harmsen W, Wilson L, MacCarty R, Welch T, Ilstrup D, Ahlqist D. Prospective blinded evaluation of CT colonoscopy for screen detection of colorectal polyps. Gastroenterology. 2003;125(2):311–319. doi: 10.1016/s0016-5085(03)00894-1. [DOI] [PubMed] [Google Scholar]
- 12.Ferrucci J. Colon cancer screening with virtual colonoscopy: promise, polyps, politics. American Journal of Roentgenology. 2001;177(3):975–988. doi: 10.2214/ajr.177.5.1770975. [DOI] [PubMed] [Google Scholar]
- 13.Johnson CD, Dachman AH. CT colonography: The next colon screening examination. Radiology. 2000;216:331–341. doi: 10.1148/radiology.216.2.r00au47331. [DOI] [PubMed] [Google Scholar]
- 14.Dachman AH, Kuniyoshi JK, Boyle CM, Samara Y, Hoffmann KR, Rubin DT, Hanan I. CT colonography with three-dimensional problem solving for detection of colonic polyps. Amer J Roentgenol. 1998;171:989–995. doi: 10.2214/ajr.171.4.9762982. [DOI] [PubMed] [Google Scholar]
- 15.Fletcher JG, Johnson CD, MacCarty RL, Welch TJ, Reed JE, Hara AK. CT colonography: Potential pitfalls and problem-solving techniques. Amer J Roentgenol. 1999;172:1271–1278. doi: 10.2214/ajr.172.5.10227501. [DOI] [PubMed] [Google Scholar]
- 16.Yoshida H, Masutani Y, MacEneaney P, Rubin D, Dachman AH. Computerized detection of colonic polyps in CT colonography based on volumetric features: A pilot study. Radiology. 2002;222:327–336. doi: 10.1148/radiol.2222010506. [DOI] [PubMed] [Google Scholar]
- 17.Li L, Lu H, Li X, Huang W, Tudorica A, Christodoulou C, Krupp L, Liang Z. MRI volumetric analysis of multiple sclerosis: Methodology and validation. IEEE Transactions on Nuclear Science. 2003;50(5):1686–1692. [Google Scholar]
- 18.Liang Z, Jaszczak R, Coleman E. Parameter estimation of finite mixtures using the EM algorithm and information criteria with application to medical image processing. IEEE Transactions on Nuclear Science. 1992;39(4):1126–1133. [Google Scholar]
- 19.Sanjay-Gopal S, Hebert T. Bayesian pixel classification using spatially variant finite mixtures and the generalized EM algorithm. IEEE Transactions on Image Processing. 1998;7(7):1014–1028. doi: 10.1109/83.701161. [DOI] [PubMed] [Google Scholar]
- 20.Zhang Y, Brady M, Smith S. Segmentation of brain MR images through a hidden Markov random field model and the expectation-maximization algorithm. IEEE Transactions on Medical Imaging. 2001;20(1):45–57. doi: 10.1109/42.906424. [DOI] [PubMed] [Google Scholar]
- 21.Näppi J, Dachman AH, MacEneaney P, et al. Automated knowledge-guided segmentation of colonic walls for computerized detection of polyps in CT colonography. J Comput Assist Tomogr. 2002;26:493–504. doi: 10.1097/00004728-200207000-00003. [DOI] [PubMed] [Google Scholar]
- 22.Summers R, Beaulieu C, Pusanik L, Malley J, Jeffrey R, Glazer D, Napel S. Automated polyp detection at CT Colonography: Feasibility study. Radiology. 2000;216(1):284–290. doi: 10.1148/radiology.216.1.r00jl43284. [DOI] [PubMed] [Google Scholar]
- 23.Summers R, Johnson C, Pusanik L, Malley J, Youssef A, Reed J. Automated polyp detection at CT Colonography: Feasibility assessment in a human population. Radiology. 2001;219(1):51–59. doi: 10.1148/radiology.219.1.r01ap0751. [DOI] [PubMed] [Google Scholar]
- 24.Yoshida H, Nappi J. Three-dimensional computer-aided diagnosis scheme for detection of colonic polyps. IEEE Transactions on Medical Imaging. 2001;20(12):1261–1274. doi: 10.1109/42.974921. [DOI] [PubMed] [Google Scholar]
- 25.Yoshida H, Masutani Y, Maceneaney P, Rubin D, Dachman A. Computerized detection of colonic polyps at CT colonography on the basis of volumetric features: Pilot study. Radiology. 2002;222(2):327–336. doi: 10.1148/radiol.2222010506. [DOI] [PubMed] [Google Scholar]
- 26.Yoshida H, Nappi J, MacEneaney P, Rubin D, Dachman A. Computer-aided diagnosis scheme for detection of polyps at CT colonography. Radiographics. 2002;22(4):963–979. doi: 10.1148/radiographics.22.4.g02jl16963. [DOI] [PubMed] [Google Scholar]
- 27.Nappi J, Yoshida H. Automated detection of polyps with CT Colonography: Evaluation of volumetric features for reduction of false-positive findings. Academic Radiology. 2002;9(4):386–397. doi: 10.1016/s1076-6332(03)80184-8. [DOI] [PubMed] [Google Scholar]
- 28.Nappi J, Frimmel H, Dachman A, Yoshida H. Computerized detection of colorectal masses in CT colonography based on fuzzy merging and wall-thickening analysis. Medical Physics. 2004;31(4):860–872. doi: 10.1118/1.1668591. [DOI] [PubMed] [Google Scholar]
- 29.Paik D, Beaulieu C, Jeffrey R, Karadi C, Napel S. Detection of polyps in CT Colonography: A comparison of a computer-aided detection algorithm to 3D visualization methods. Radiology. 1999;213(P):197. [Google Scholar]
- 30.Paik D, Beaulieu C, Jeffrey R, Yee J, Steinauer-Gebauer A, Napel S. Computer aided detection of polyps in CT colonography: Method and free-response ROC evaluation of performance. Radiology. 2000;217(P):370. [Google Scholar]
- 31.Paik D, Beaulieu C, Mani A, Prokesch R, Lee J, Napel S. Evaluation of computer-aided detection in CT colonography: Potential applicability to a screening population. Radiology. 2001;221(P):332. [Google Scholar]
- 32.Kiss G, Cleynenbreugel J, Thomeer M, Marchal G, Suetens P. Computer aided diagnosis for virtual colonography by geometrical model fitting. Proc. of 7th International Workshop on Vision, Modeling, and Visualization; Germany. 2002. pp. 27–34. [Google Scholar]
- 33.Kiss G, Cleynenbreugel J, Thomeer M, Suetens P, Marchal G. Computer-aided diagnosis in virtual colonography via combination of surface normal and sphere fitting methods. European Radiology. 2002;12(1):77–81f. doi: 10.1007/s003300101040. [DOI] [PubMed] [Google Scholar]
- 34.Wijk C, Truyen R, Gelder RE, Vliet LJ, Vos FM. On normalized convolution to measure curvature features for automatic polyp detection. MICCAI, LNCS. 2004;3216:200–208. [Google Scholar]
- 35.Wang Z, Liang Z, Li X, Li L, Li B, Eremina D, Lu H. An improved electronic colon cleansing method for detection of colonic polyps by virtual colonoscopy. IEEE Transactions on Biomedical Engineering. 2006;53(12):1635–1646. doi: 10.1109/TBME.2006.877793. [DOI] [PMC free article] [PubMed] [Google Scholar]
- 36.Eremina D, Li X, Zhu W, Wang J, Liang Z. Investigation on an EM framework for partial volume image segmentation. Proceedings of SPIE Medical Imaging. 2006;6144:D1–D9. [Google Scholar]
- 37.Sethian JA. Level set methods and fast marching methods evolving interfaces in computational geometry, fluid mechanics, computer vision, and materials science. Cambridge University Press; 1999. [Google Scholar]
- 38.Liang Z, Wang S, Lu H, Wang J. IEEE Nuclear Science Symposium (NSS) and Medical Imaging Conference (MIC) Hawaii: 2007. Model Parameter Estimation and Tissue Mixture Segmentation by a MAP-EM Algorithm. [Google Scholar]
- 39.Wang S, Lu H, Liang Z. International Workshop on Combinatorial Image Analysis. Buffalo: 2008. A Theoretical Solution to Partial Volume MAP-EM Tissue Mixture Segmentation for CT/MRI Imaging Modalities. [Google Scholar]
- 40.Wang Z, Liang Z, Li L, Li X, Anderson J, Harrington D. Reduction of false positives by internal features for polyp detection in CT-based virtual colonoscopy. Med Phys. 2005;32(12) doi: 10.1118/1.2122447. [DOI] [PMC free article] [PubMed] [Google Scholar]
- 41.Gonzalez RC, Woods RE. Digital Image Processing (2nd Edition) (Hardcover) Prentice Hall; 2002. [Google Scholar]
- 42.Monga O, Benayoun S. Using partial derivatives of 3D images to extract typical surface features. Proceedings of the third annual conference of AI, simulation and planning in high autonomy systems, integrating perception, planning and action. 1992:225–236. [Google Scholar]


