Abstract
The purpose of the present study was to use capacitive coupling of pulsed electromagnetic field (CC-PEMF) and hydroxyapatite nanoparticles (HAp) as a countermeasure to prevent osteoporosis induced by simulated microgravity. We used the hind-limb suspension (HLS) rat model to simulate microgravity-induced bone losses for 45 days. In order to compare the resulting changes, mineralogical (bone mineral density [BMD], calcium [Ca], and phosphorus [P]), biochemical (osteocalcin, alkaline phosphatase [ALP], and type I collagen), and histological (scanning electron microscopy) parameters were adopted. As a countermeasure to the above, the effect of PEMF and HAp application were examined. Three-month-old female Wistar rats were randomly divided into control (n = 8), HLS (n = 8), HLS with PEMF (n = 8), HLS with HAp nanoparticles (n = 8), and HLS with HAp and PEMF (n = 8). We observed: 1) significant decrease (p < 0.01) in BMD, Ca, P, type I collagen, and ALP activity in femur and tibia in hind-limb bone and serum osteocalcin in HLS rats as compared with the ground control. 2) Nonsignificant increase in BMD (p < 0.1), Ca (p < 0.1), P (p < 0.5), type I collagen (p < 0.1), and ALP activity (p < 0.5) in femur and tibia in hind-limb bone and serum osteocalcin (p < 0.5) in HLS + PEMF rats compared with HLS rats. 3) Significant increase in BMD (p < 0.02), Ca (p < 0.05), P (p < 0.05), type I collagen (p < 0.02), and ALP activity (p > 0.02) in femur and tibia in hind-limb bone with a nonsignificant increase in serum osteocalcin (p > 0.1) in HLS + HAp rats compared to HLS rats. 4) Significant increase in BMD (p > 0.01). Ca (p > 0.01). P (p > 0.01). type I collagen (p > 0.01). and ALP activity (p > 0.01) in femur and tibia in hind-limb bone and serum osteocalcin (p > 0.02) were also observed. Results suggest that a combination of low level PEMF and Hap nanoparticles has potential to control bone loss induced by simulated microgravity.
Keywords: hydroxyapatite nanoparticles, simulated microgravity, osteocalcin, type I collagen
Introduction
Removal of gravity during long-duration space flight results in a loss of homeostasis in the skeleton. which adapts to the new environment by shedding calcium1 at a rate that is almost 10 times greater than that in a postmenopausal women2,3 and loss of bone mineral density (BMD).4–6 Microgravity changes the metabolic environment of bone leading to site-specific alterations in bone remodeling. Bone formation is decreased and bone resorption is increased,7 which results in significant bone loss with a consequent increase in fracture risk. Over the past few years, several countermeasures have been examined to prevent bone loss during exposure to microgravity, including pharmacological therapy with calcitonin and bisphosphonates and several active and passive exercise regimes, but positive outcomes have been limited.8,9 The hind-limb elevation model (hind-limb suspension [HLS]: tail-suspended model) in rats has been shown to simulate the bone turnover and muscle changes seen in growing rats during space flight.10,11 This model mimics microgravity, which affects musculoskeletal systems, metabolic changes altering bone formation compared with those recorded for biosatellite animals.12
We have demonstrated that capacitive coupling of pulsed electromagnetic fields (CC-PEMF) exposure promote the restoration of the bone loss in osteoporotic rat bones.13–15 Other studies have also shown PEMF to have effects on many aspects of bone formation and healing. These include induced endothelial cell proliferation and capillary formation, which are integral to angiogenesis in the revascularization of healing bone fractures.16
Hydroxyapatite [HAp; Ca10(PO4)6-(OH)2] nanoparticles are chemically similar to the mineral component of bones and hard tissues in mammals. It is one of the few materials that are classified as bioactive, which means that it will support bone growth and osteointegration when used in orthopedics. Crystalline HAp particles are the typical mineral used in repair and may promote osteoblast cell adhesion.17,18 These particles are plate-shaped and hundreds of nanometers long.19,20 It is suggested that the basic inorganic building blocks of bone may be these nanosized apatite particles.21 Tens to hundreds of these nanoblocks, in the collagen matrix, combine into self-assembled biomaterials that have remarkable physical and chemical features22 such as unique mechanical strength, insensitivity to growth/dissolution, and flexible structure.23 Thus, features of HAp nanoparticles may more closely approximate features of HAp during biomineralization. Therefore, HAp nanoparticles may promote the adhesion, proliferation, and synthesis of alkaline phosphatase (ALP) in osteoblasts and lead to more rapid repair of hard tissue injury.24,25
In the view of the above and the demands of long-term spaceflight, it seems imperative that we look for some acceptable method to counter the problem of osteoporosis. Efficacy of electrostimulation has been identified as a safe and noninvasive method to counter bone loss. Since the loss of HAp is inevitable, it is suggested that it should also be used as an input to control the regime loss. A small current induced due to electostimulation may be a trigger to precipitate HAp crystals at the affected site. In the present work, we have adapted a synergistic effect of these two methods.
Materials and methods
Animals
Female Wistar rats (90 days old and of similar mean weight, 230–250 gm body wt.) were obtained from the animal facility of Jawaharlal Nehru University, New Delhi. The animal experiment protocol was approved by the Institutional Animal Ethics Committee (IAEC code no. 07/2008) at Jawaharlal Nehru University, New Delhi. Animals were randomly divided into following five groups: control, HLS, HLS with HAp nanoparticle (HLS + N), HLS with PEMF (HLS + P), HLS with PEMF and HAp (HLS + P + N). Eight animals were taken from each group.
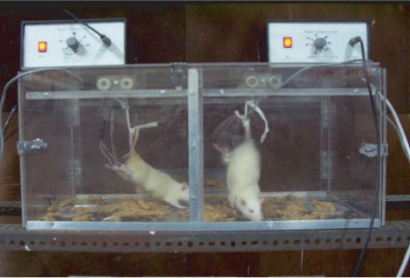
The HLS model (tail-suspended model) mimics microgravity. For the HLS model, rats were fixed with a tail harness (Figure 1) which raised their hind-limbs 1 cm off the cage floor by a 30° head-down angle. The rats retained this position for 45 days. Tail suspension was also maintained during nanoparticle and PEMF treatments.
Figure 1.
Pulsed electromagnetic field treatment by bone stimulator.
Treatments
Nanoparticle treatment
Silicon-substituted hydroxyapatite (Si-HAp) nanopowder (cat. no. 677418) purchased from Sigma-Aldrich Chemicals (St. Louis, MO, USA) was used in the present investigation. The biological activity of Si-HAp was shown to be enhanced by substitution of Si ions into a fraction of hydroxyapatite lattice phosphate sites.26 Therefore, we used Si-substituted hydroxyapatite nanopowder instead of pristine HAp nanopowder (Table 1).
Table 1.
Properties of Si-HAp
| Molecular formula | [Ca5(OH)(PO4)3]x |
| Molecular weight | 502.31 |
| Form | Nanopowder, solid |
| Contains | 5 wt. % silica as dopant (synthetic) |
| Particle size | <200 nm (BET) |
Abbreviations: HAp, hydroxyapatite nanoparticle; Si, silicon.
In preparation of a solution of Si-HAp, Si-HAp nanopowder is mostly insoluble. To prepare the homogenous solution for injection, we added the nanopowder to phosphate-buffered saline (PBS; 1x, pH 7.4) and dispersed the particles within the PBS solution with an Elma Ultrasonicator (Elma Hans Schmidbauer GmbH and Co KG, Singen, Germany) for 15 min at 130 KHz, 25 °C.
20 mg/250 gm body weight of this Si-HAp solution was injected intraperitoneally daily for 45 days.
PEMF treatment
Bone stimulator
Our device, known as an electrical bone stimulator, has been used to treat fractures and control osteoporosis.13–15 It emits a PEMF, which is applied to the chosen site of the long bone. The bone stimulator (Table 2) is connected to a pair of capacitor electrodes, which are applied over the skin. It emits low level electromagnetic energy.
Table 2.
We used a bone stimulator with following specifications for exposure
| Carrier frequency | 14.0 MHz |
| Modulated frequency | 16.0 Hz |
| Amplitude | 10 V (peak to peak) |
| Output wave shape | Square |
| Electrode diameter | 1 cm |
| Average electric field between electrodes | 7.8 Volt/m |
Calibration was done with the help of an Iwatsu oscilloscope (SS–5711 C; Iwatsu Electric Co., Ltd., Tokyo, Japan) and the output of our bone stimulator was given by a pair of electrodes to both hind limbs of each rat in the groups, HLS + P and HLS + P + N (Figure 1) for 45 days, four hours per day. Treatments were given for 45 days simultaneously to examine the efficacy of the countermeasure as compared with all other groups.
Mineralogical analysis
Bone samples preparation
Rats were sacrificed by an intraperitonial overdose of phenobarbital sodium. The femur and tibia of the hind limbs of all rat groups were dissected and freed from soft tissues and stored at −20 °C for various assays. The volumes of all fresh bones were measured by submersion of bone in a water-filled container with a scale sensitivity of 0.01 ml. After measuring the volume, bones were lyophilized for 10 hours and powdered down into fine particles with mortar and pestle. Powdered samples were kept at 60 °C overnight in vacuum oven to determine total dry bone weight (organic + inorganic contents).
Mineral and organic content
Bone samples were kept at 700 °C in a muffled furnace (Widsons Scientific Works, Delhi, India) for 10 hours. The ash weight indicated the bone mineral content (BMC). The difference in dry bone and ash weight measured as organic content and parameters were calculated by the following formula (BMC = ash weight [mg]):
Archimedes’ principle was applied to determine BMD (gm/cm3).
Calcium analysis
Calcium content was determined in rat bone samples by atomic absorption spectroscopy (AAS). Before analysis, powdered bone samples were digested in acid and then calcium was quantified by flame atomic absorption spectrophotometry (AA-6800; Shimadzu Scientific Instruments, Columbia, MD, USA). Bone powder (50 mg) from each sample was digested in 5 ml of aquaregia and heated in Teflon bomb at 100 °C for 10 hours. Subsequently, the digested samples were diluted with Milli-Q® (Millipore, Billerica, MA, USA) pure water and 100 ml stock solution was made. Stock solution (5 ml) was added with 95 ml of 0.5% lanthanum chloride and filtered through 0.45 μm pore size filter. The standards of different calcuim concentrations (ie, 1 ppm, 2 ppm, 4 ppm, 5 pmm, and 10 pmm) were prepared from commercial standard solution (Ranbaxy Laboratories Ltd, Gurgaon, India). The standards and sample solutions were read against the blank solution. The concentration of calcium in the samples were calculated by equation obtained from the standard curve (R2 = 0.944).
Phosphorus analysis
Phosphorus analysis of bone samples was performed by vanadomolybdophosphoric acid colorimetric method in UV–VIS spectrophotometer (Varian AA-20; Varian Analytical Instruments, Palo Alto, CA, USA). 50 mg of dry bone powder from each sample was digested in mixture of 1 ml H2SO4 and 5 ml of HNO3 and heated till the volume became 1 ml (complete removal of HNO3). Thereafter the solution was neutralized and 100 ml sample stock solution was prepared with double-distilled water. 5 ml of sample stock solution was added to 30 ml of double-distilled water and 15 ml of Vanadate-Molybdate reagent (VMR) and filtered through 0.45 μm pore size filter paper (Millipore). Phosphorus concentrations were evaluated with respect to standard solutions of 0.2 ppm, 0.4 ppm, 0.6 ppm, 0.8 ppm, and 1 ppm concentration from phosphate (KH2PO4) standard stock solution. The standards and samples were read against the blank solution at 470 nm wavelength. The readings of sample solutions, standard, and blank were noted. The concentration of phosphorus in the samples was calculated by standard curve (R2 = 0.9976).
X-ray diffraction
The procured bone samples were cleaned well to remove macroscopic adhering impurities. In order to avoid soot and crack formation during heat treatment, the bone samples were boiled in distilled water for two hours. After boiling, the bone samples were immersed in 2% NaCl solution as a preservative for two hours and then these were degreased by immersing in acetone-ether mixture (in the ratio of 3:2 for two hours). Thereafter samples were stored at −20 °C until assay. The bone samples were then preheated overnight at 700 °C (Widsons Scientific Works). X-ray diffraction (XRD) patterns were obtained with a X’Pert Philips Analytical X-ray diffractometer (PANalytical India, Delhi, India) with CuKα (λ = 1.543 Å) incident radiation and operated at 45 kV and 35 mA. The XRD peaks were recorded in the range of 10°–90°.
Histological analysis
Scanning electron microscopy
The femur and tibia of each of the five groups of rats were dissected and stripped of all soft tissues. Transverse sections of 0.5 cm thickness of femur and tibia hind-limb were made in all the five groups of bone samples. These were fixed in 2% glutaraldehyde. Before doing any scanning electron microscope (SEM) characterization, the bone samples were dried and mounted on circular disc stubs with adhesive. Gold coatings were applied at a thickness of about 20 nanometers, which is too thin to interfere with the dimensions of surface features. Coating was done with the help of sputter coater. The samples were placed in a small vacuum chamber. After introducing the argon gas in the chamber, an electric field was applied to cause removal of electron from the argon atoms and made them positively charged. The Ar ions were then attracted to a negatively charged piece of coated material. The Ar ions acted like sand in a sandblaster, which struck gold or carbon atoms from the surface of the foil. These gold atoms now settled onto the surface of the sample and produced a gold coating. SEM images were obtained on low vacuum SEM (Leo 435 VP; Carl Zeiss SMT, Cambridge, UK) at the National Facilities of Electron Microcopy, AIIMS, New Delhi, India.
Biochemical analysis
ALP activity estimation in bone sample
Phosphatases are enzymes which catalyze the splitting of a phosphate from monophosphoric esters. ALP, a mixture of isoenzymes from liver, bone, intestine, and placenta, has maximum enzyme activity at about pH 10.5. ALP measurements are of particular interest in the investigation of bone diseases. Paranitrophenyl phosphate, which is colorless, is hydrolyzed by ALP at pH 10.5 and 37 °C to form yellow-colored free paranitrophenol. The addition of NaOH stops the enzyme activity and the final color shows maximum absorbance at 405 nm. Process is same as in serum, but for bone ALP estimation, a homogenate was prepared for the assay.
Femur and tibia were removed and cleaned of all adherent soft tissues, stored at −20 °C until assayed. Samples of the bone (femur and tibia) were washed with physiological saline (0.9% NaCl) and blotted on filter paper. Each bone was homogenized in 2 ml of glycine buffer (pH 10.4) using a high-performance homogenizer. Homogenized samples were centrifuged for 20 min at 8000 g and 4 °C. The activity of ALP in supernatant of the femur and tibia were determined by Ecoline Alk Phosphatase analysis kit (Merck, Darmstadt, Germany). A working solution (substrate solution; disodium paranitrophenyl phosphate) of each vial was dissolved in 10 ml buffer (ready to use and was supplied with kit).1 ml of working solution and 200 μl of sample supernatant were taken in a microcentrifuge tube. Before proceeding further, a temperature-controlled spectrophotometer (Varian AA-20) was calibrated at 405 nm wavelengths to zero with the blank. Absorbance reading was done at one-minute time intervals (0 min, 1 min, 2 min, 3 min, and 4 min) at 37 °C. ALP activity (IU/L) is liberated by millimoles of purine nucleoside phosphorylase (PNP) per minute at 37 °C incubation per liter sample. A0 (absorbance at 0 min), A1 (absorbance at 1 min), A2 (absorbance at 2 min), A3 (absorbance at 3 min), and A4 (absorbance at 4 min) were read against blank (distilled water) and average change in absorbance per minute (Abs/min) was determined. Calculation of PNP per minute in m.mol/L or ALP activity in IU/L in the test sample was carried out. At 37 °C, temperature factor (tf) at is equal to 1 and multiplication factor is 2757 (when 200 μl samples are taken).
Type I collagen estimation in bone samples
Bone samples were decalcified with EDTAG (0.5 M EDTA in 0.05 M Tris/HCl) and homogenized in 2 ml 0.05 M Tris/HCl with proteinase inhibitor. Homogenized samples were lyophilized in vacuum drier for eight hours. Lyophilized samples were extracted with 2 ml of 0.5 M acetic acid for 48 hours. The acetic acid soluble collagen was separated by centrifugation at 15000 g for 45 min. Supernatant of centrifuged material was transferred in a microcentifuge tube and the residue was subjected to subsequent digestion with pepsin (1 mg of pepsin/10 mg of lyophilized bone) in 2 ml of 0.5 M acetic acid (pH 2.0) for 48 hours. The pepsin-soluble collagens were separated by centrifugation at 15000 g for 45 min. The pepsin-insoluble bone matrix was extracted with 0.05 M Tris/HCl, pH 7.5, containing 4.0 M guanidine hydrochloride for 24 hours. All three separated supernatant were fractionated by differential salt precipitation. Type I collagen molecules were precipitated with NaCl added to a final concentration of 2.6 M, pH 7.4, by stirring for 24 hours and centrifuged at 15000 g for 45 min. Collected collagen precipitates were dissolved in 2 ml of 0.5 M acetic acid to make test sample stock solution. After preparation of sample stock solution, type I collagen standards were made with purified type I collagen from rat tail tendon (C7661-5MG; Sigma-Aldrich), 100 ml of 1% Sirius Red (Direct Red 80, 43665, Fluka; Sigma-Aldrich) solution was prepared in 0.5 M acetic acid and was preserved for standard solution and test sample preparation.
The calibration graph was prepared using aliquots of type I collagen standard solution (Abs at 540 nm). The concentration of type I collagen was calculated in test samples with the help of an equation obtained by the calibrated graph. The sum of acid-soluble and enzyme collagen was considered as total collagen.
Osteocalcin estimation from serum
Osteocalcin from rat serum was measured by Rat Osteocalcin EIA Kit (cat. no. BT-490; Biochemical Technologies, Inc., Stoughton, MA, USA).
Assay principal
This sandwich ELISA Kit is specific for rat osteocalcin only. Both carboxylated and decarboxylated rat osteocalcin are recognized. Rat osteocalcin can be measured directly from serum, heparinized plasma, bone extracts, and serum-free cell culture supernates. A monoclonal antibody directed against the N-terminal region of osteocalcin is bound to the polystyrene wells. After incubation with sample, the plate is washed followed by incubation with a second antibody (goat polyclonal) of high specificity for the C-terminus of rat osteocalcin. Detection is achieved by a third incubation using a horseradish peroxidase conjugate of a donkey anti-goat immunoglobulin G (IgG) and subsequent enzyme assay. The osteocalcin concentration is proportional to color development. Standards of highly purified rat osteocalcin are used to generate a standard curve.
Sample preparation
Serum was diluted to 1/20 dilution with sample buffer, provided with the Rat Osteocalcin EIA Kit.
We followed the following procedure to measure the osteocalcin: Stock standard (100 ng/ml) was diluted with sample buffer in the range of 0.33 ng/ml to 20 ng/ml to make six standards in the range of 0.25 to 20 ng/ml. 0.3, 1.0, 2.5, 5.0, 10, and 20 ng/ml for standard curve.100 μl of sample buffer (blank), standards, controls, and unknowns were pipetted into designated duplicate wells of ELISA plates provided with the kit and kept for incubation at 2–8 °C for 18–24 hours. Wells were aspirated completely and washed three times with 0.3ml PBS wash buffer.100 μl of the osteocalcin antiserum was added to each well and incubated in water bath at 37 °C for one hour. Again, plates were washed three times and100 μl of the diluted donkey anti-goat IgG peroxidase was added to each well and incubated at room temperature for one hour. One volume of 3,3,5,5-tetramethylbenzidine (TMB) solution (BT-497; Sigma-Aldrich) was mixed with one volume of hydrogen peroxide solution (BT-498; Sigma-Aldrich) and kept aside. Again, the plate was washed three times with washing buffer and immediately 100 μl of substrate mix was added to all wells and incubated at room temperature in the dark for 30 min. Finally, 100 μl of stop solution was added to all wells and absorbance was measured at 450 nm within 15 min.
Statistical analysis
All the experimental results were compared with control group where statistical analysis was done by one-way analysis of variance in mean ± standard deviation.
Results
Mineralogical analysis
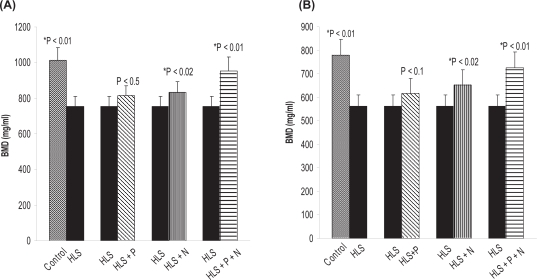
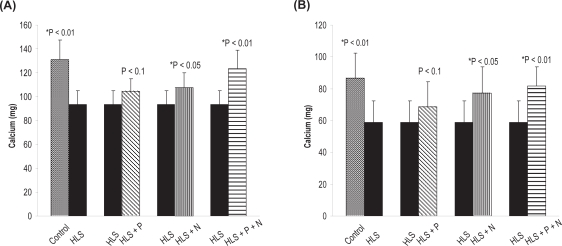
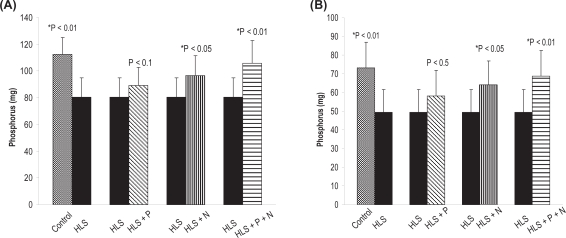
To find out the deposition of hydroxyapatite crystal into osteoid, we measured the BMD, calcium, and phosphorus content of the hind limb of all five rat groups (control, HLS, HLS + P, HLS + N, HLS + P + N groups; n = 8). The detailed results of BMD, calcuim, and phosphorus content in femur and tibia for different groups are presented in Figures 2(a, b), 3(a, b), and 4(a,b), respectively.
Figure 2.
(A) BMD (mg/ml) in femur. (B) BMD (mg/ml) in tibia. Nonsignificant increase in HLS and HLS + P.
Notes: *Indicates significant difference between: 1) control and HLS; 2) HLS and HLS + N; 3) HLS and HLS + P + N.
Abbreviations: BMD, bone mineral density; HLS, hind-limb suspension; HLS + N, hind-limb suspension + nanoparticle (Si-HAp); HLS + P, hind-limb suspension + PEMF; HLS + P + N, hind-limb suspension + PEMF + nanoparticle; PEMF, pulsed electromagnetic field.
Figure 3.
(A) Calcium content in femur. (B) Calcium content in tibia. Nonsignificant increase in HLS and HLS + P.
Notes: *Indicates significant difference between: 1) control and HLS, 2) HLS and HLS + N, 3) HLS and HLS + P + N.
Abbreviations: HLS, hind-limb suspension; HLS + N, hind-limb suspension + nanoparticle (Si-HAp); HLS + P, hind-limb suspension + PEMF; HLS + P + N, hind-limb suspension + PEMF + nanoparticle; PEMF, pulsed electromagnetic field.
Figure 4.
(A) Phosphorus content in femur. (B) phosphorus content in tibia. Nonsignificant increase in HLS and HLS + P.
Notes: *Indicates significant difference between: 1) control and HLS, 2) HLS and HLS + N, 3) HLS and HLS + P + N.
Abbreviations: HLS, hind-limb suspension; HLS + N, hind-limb suspension + nanoparticle (Si-HAp); HLS + P, hind-limb suspension + PEMF; HLS + P + N, hind-limb suspension + PEMF + nanoparticle; PEMF, pulsed electromagnetic field.
The body weights at euthanasia (Table 3) suggest that with the application of PEMF+HAp, there is a reversal in the tendency of weight loss. This is evidenced by measured values of BMD, calcium, and phosphorus.
Table 3.
Body weights at euthanasia
| Control (gm) | HLS (gm) | HLS +P (gm) | HLS + HAp (gm) | HLS + P + N (gm) |
|---|---|---|---|---|
| 291.25 ± 8.8 | 227.12 ± 6.5 | 238.87 ± 6.4 | 252.98 ± 7.8 | 271.6 ± 9.2 |
Note: Values are means ± SE.
Abbreviations: HAp, hydroxyapatite nanoparticle; HLS, hind-limb suspension; HLS + P, hind-limb suspension + PEMF; HLS + P + N, hind-limb suspension + PEMF + nanoparticle; PEMF, pulsed electromagnetic field; SE, standard error.
X-ray diffraction
The XRD method show the higher intensity record at an angle of 2θ = 32°, which is the characteristic diffraction angle for calcium hydroxyapatite. This also confirmed the crystallographic of deposits. The higher peak intensity in treated groups as compared to HLS indicated more deposition of hydroxyapatite in crystalline form. The detailed results are presented in Table 4. See Table 5 for the crystallographic parameters of HAp crystal deposited into the bone matrix.
Table 4.
Physical parameter of HAp crystal deposited into the bone matrix
| Values Groups | 2θ | PDF Index name | Chemical formula | Density/volume/Z | c(A°) | a(A°) | d(A°) |
|---|---|---|---|---|---|---|---|
| Control | 32° | Calcium Phosphate Hydroxide | Ca5(PO4)3(OH)
a/c = 1.370 |
3.14/530.14/2.00 | 6.8810 | 9.4320 | 2.817 |
| HLS | 32° | Calcium Phosphate Hydroxide | Ca5(PO4)3(OH)
a/c = 1.370 |
3.14/530.14/2.00 | 6.8810 | 9.4320 | 2.817 |
| HLS + P | 32° | Calcium Phosphate Hydroxide | Ca5(PO4)3(OH)
a/c = 1.370 |
3.14/530.14/2.00 | 6.8810 | 9.4320 | 2.817 |
| HLS + N | 32° | Calcium Phosphate Hydroxide | Ca5(PO4)3(OH)
a/c = 1.370 |
3.14/530.14/2.00 | 6.8810 | 9.4320 | 2.817 |
| HLS + P + N | 32° | Calcium carbonate Phosphate Fluoride Hydroxide | Ca10(PO4)5Co3(OH)F
a/c = 1.371 |
3.05/527.04/1.00 | 6.8660 | 9.4147 | 2.717 |
Note: Z, charge.
Abbreviations: HAp, hydroxyapatite nanoparticle; HLS, hind-limb suspension; HLS + N, hind-limb suspension + nanoparticle (Si-HAp); HLS + P, hind-limb suspension + PEMF; HLS + P + N, hind-limb suspension + PEMF + nanoparticle; PDF, ; PEMF, pulsed electromagnetic field.
Table 5.
Crystallographic parameter of HAp crystals deposited into the bone matrix
| Crystal system | Hexagonal |
| Space group | P63/m |
| Space group number | 176 |
Abbreviation: HAp, hydroxyapatite nanoparticle.
Scanning electron microscopy
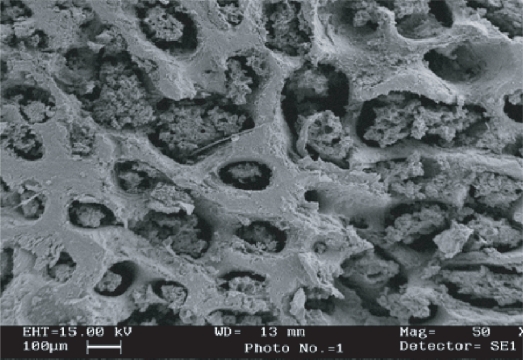
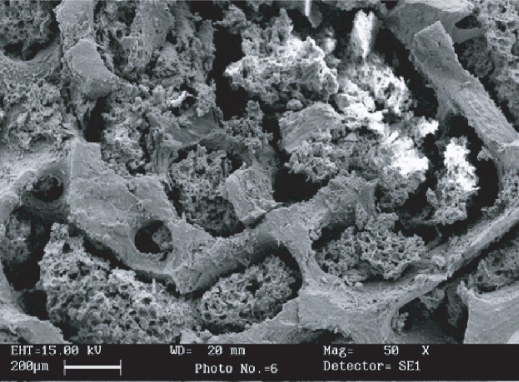
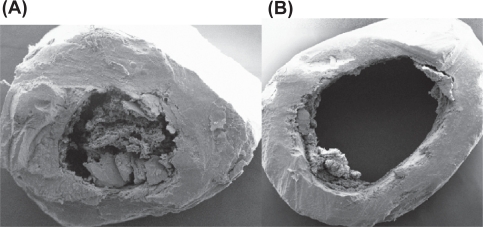
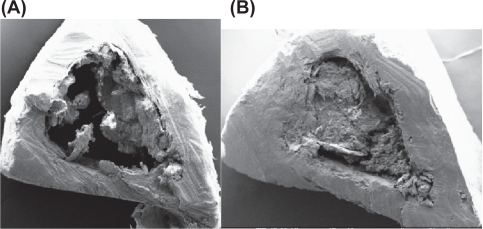
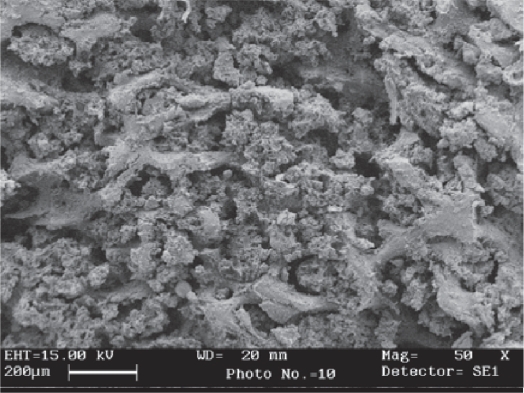
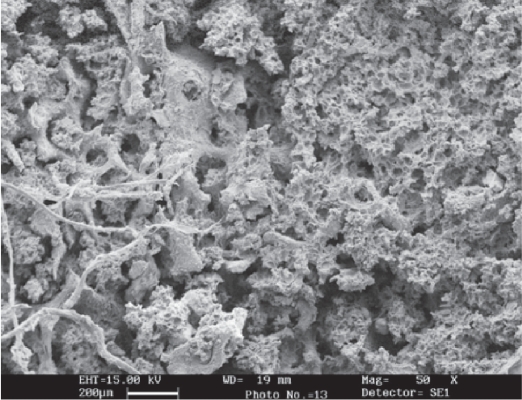
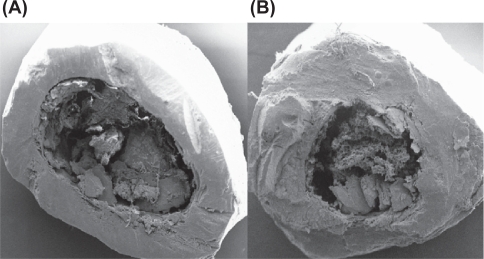
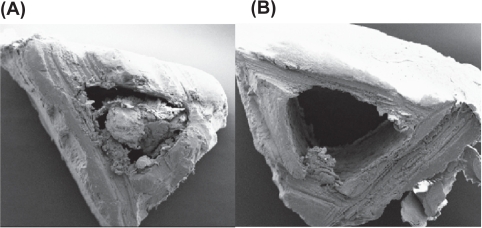
SEM was performed in all groups of bone samples to evaluate the changes in cortex and cancellous part of bone. Transverse section of femur and tibia bone of control, HLS, and treated (HLS + P, HLS + N, HLS + P + N) rats were analyzed. More compactness in cancellous part and mineral deposition in control and treated bone were found compared to HLS bone (Figures 5–8). Similar results were also obtained in cortical thickness among various rat groups (Figures 9–12). It was observed that bone marrow was attached to the cortex in treated groups was visible in normal controls. There was a deposition of white matter in HLS + P + N group rats, which may be a deposit of hydroxyapatite particles.
Figure 5.
SEM image of cancellous part of femur (Control).
Abbreviation: SEM, scanning electron microscope.
Figure 8.
SEM image of cancellous part of femur (HLS + PEMF + HAp).
Abbreviations: HAp, hydroxyapatite nanoparticle; HLS, hind-limb suspension; PEMF, pulsed electromagnetic field; SEM, scanning electron microscope.
Figure 9.
(A) SEM image of cortical part of femur (Control). (B) SEM image of cortical part of femur (HLS).
Abbreviations: HLS, hind-limb suspension; SEM, scanning electron microscope.
Figure 12.
(A) SEM image of cortical part of tibia (HLS + P). (B) SEM image of cortical part of tibia (HLS + N + P).
Abbreviations: HLS + P, hind-limb suspension + PEMF; HLS + N + P, hind-limb suspension + nanoparticle + PEMF; PEMF, pulsed electromagnetic field; SEM, scanning electron microscope.
Biochemical analysis
Osteocalcin, ALP, and type I collagen were measured in all five rat groups.
Alkaline phosphatase activity
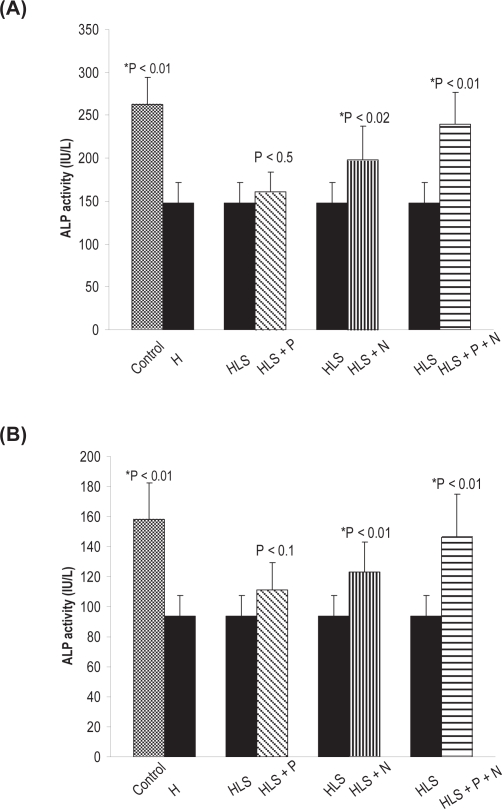
Alkaline phosphatase is involved in mineralization process and is a good marker of osteoblastic activity. ALP activity was measured in the femur and tibia of all rat groups. The result shows a significant increase. Detailed results of ALP activity in femur and tibia for the different groups are presented in (Figure 13a, b). It is evident that there is more activity in the femur as compared to tibia.
Figure 13.
(A) ALP activity in femur. (B) ALP activity in tibia. Nonsignificant increase in HLS and HLS + P.
Notes: *Indicates significant difference between: 1) control and HLS, 2) HLS and HLS + N, 3) HLS and HLS + P + N.
Abbreviations: ALP, alkaline phosphatase; HLS, hind-limb suspension; HLS + N, hind-limb suspension + nanoparticle (Si-Hap); HLS + P, hind-limb suspension + PEMF; HLS + P + N, hind-limb suspension + PEMF + nanoparticle; PEMF, pulsed electromagnetic field.
Type I collagen estimation in femur and tibia
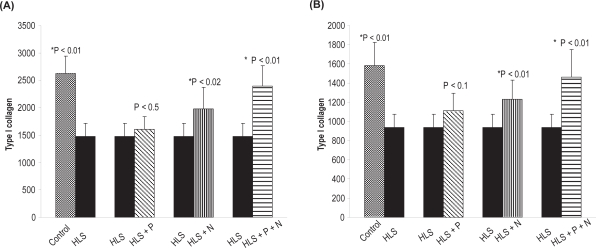
Sirius Red, a strong anionic dye, stains collagen by reacting via its sulphonic acid groups, with the basic group present in collagen molecule. Collagen extracted with acetic acid and pepsin from bone samples of different groups was analyzed. The detailed results of type I collagen in the femur and tibia for different rat groups are presented in Figure 14 a, b.
Figure 14.
(A) Total type I collagen (μg/mg of dry weight) in femur. (B) Total type I collagen (μg/mg of dry weight) in tibia. Nonsignificant increase in HLS and HLS + P.
Notes: *Indicates significant difference between: 1) control and HLS, 2) HLS and HLS + N, 3) HLS and HLS + P + N.
Abbreviations: HLS, hind-limb suspension; HLS + N, hind-limb suspension + nanoparticle (Si-HAp); HLS + P, hind-limb suspension + PEMF; HLS + P + N, hind-limb suspension + PEMF + nanoparticle; PEMF, pulsed electromagnetic field.
Osteocalcin estimation in serum
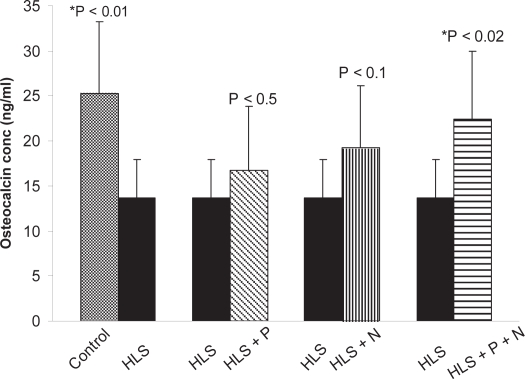
Osteocalcin, also known as bone Gla protein, is a marker of bone formation. It is the most abundant and widely studied noncollagenous protein produced by osteoblasts. The detailed results of osteocalcin concentration in serum of different groups are presented in Figure 15.
Figure 15.
Total osteocalcin present in serum of different groups.
Notes: *Indicates significant difference between: 1) control and HLS, 2) HLS and HLS + P + N.
Abbreviations: HLS, hind leg-suspension; HLS + P + N, hind-limb suspension + pulsed electromagnetic field + nanoparticle.
Discussion
It may be mentioned that to start with we have used ninety-day-old rats, which implies that the period of observation extends from growing to maturing stage. After 45 days of HLS, we observed a significant decrease in BMD in HLS rats compared to ground control rats. However, there was a significant increase in BMD in treated rats compared to HLS rats (Figure 2 a, b), Correspondingly a decrease in calcium and phosphorus levels in HLS rats and increased levels in the treated rats (except HLS+P) corroborate the loss and regain of bone mass, respectively (Figures 3, 4).
Various crystallographic specifications for control and various treated samples were carried under identical situation. It may be noted that the 2θ position for samples remained unchanged for a given intensity maximum. The crystal size and type indicated by c and a (axial distance or edge length) values and corresponding α, β, γ (axial angles) in control and treated samples are approximately the same. This provides support to our finding that treatment with nanoparticles and PEMF combined has a positive impact on restoring the bone loss. In HAp + PEMF treated sample rats, the peak position for the maximum intensity (100%) shift to slightly altered h, k, l and d values, while the 2θ position remains unchanged. From Table 4, it is apparent that due to the application of PEMF in HLS + P + N rats there is a change in density, volume of cell, and Z (charge). A change in the possible molecular composition may be caused by precipitation of HAp nanoparticles with negatively charged cationic region in collagen molecules at the osteoporotic site. An application of PEMF with the injection of HAp help in the deposition of extra carbon (C) and floride (F) in the bone matrix.
Alkaline phosphatase is produced in the bone’s cycle formation phase and, is therefore an excellent indicator of bone formation activity.27 Osteocalcin is the most abundant noncollagenous protein in bone, and its concentration in serum is closely linked to bone metabolism and serves as a biological marker for the clinical assessment of bone disease, although its precise mechanism of action is unclear. Osteocalcin influences bone mineralization in part through its ability to bind with high affinity to the mineral component of bone, hydroxyapatite.28 It is observed that higher serum-osteocalcin levels are relatively well correlated with increases in BMD during treatment with anabolic bone formation drugs for osteoporosis. A significant increase in ALP and osteocalcin with increased BMD in HLS + HAp and HLS + HAp + PEMF rats compared to HLS rats indicate that enhanced bone formation has taken place. Although ALP and osteocalcin are the two primary bone markers for bone formation, use of type I collagen as reliable markers have also been tested. Increase in type I collagen in treated group rats suggests that mineralization has taken place with utmost fidelity.
An important but unsolved question is how the cells can recognize the particle size of HAp nanoparticles. It is well known that cells are inherently sensitive to their surroundings. It is suggested that the dissolution of HAp nanoparticles (small size and poor crystallinity) will increase concentrations of calcium and phosphate in the medium and thereby may alter the gene expression, alkali phosphate and proteins.29 We observed significant increase in ALP activity, type I collagen. and osteocalcin concentration in HLS + HAp group rats. It indicates that 20 mg/250 gm body weight of Si-HAp can induce and enhance the expression level of bone formation marker genes. Furthermore, the zeta potential measurements can provide the interfacial properties of the nanoparticles. HAP particles have a negative zeta potential in water at pH 7.4.30 Since the electronic potential of cell membranes is known to be always negative; the positive or weakly negative particles are suitable for adsorption by cells. Another possible explanation is that the quantity of proteins adsorbed on particles positively correlates with their specific surface area.31 Nanosized particles adsorbed significantly greater amounts of proteins, and induce enhancement of subsequent cell adhesion and proliferation 32 in HLS + HAp and HLS + HAp + PEMF group rats. It is suggested that PEMF helps to accelerate the process.
The bilayer lipid structure of the plasma membrane and the electrical double layer at its inner and outer surfaces make the cell membrane a real capacitor, ie, a charge storage system. EMF exposure depolarizes the cell membrane of osteoblast to alter the uptake of calcium ions and increases the concentration of intracellular free calcium in osteoblast cytoplasm. Calcium influx is driven by induced polarization of plasma membrane when bone cells are exposed to external electric field via a classical second messenger mechanism and this eventually leads to a mitogenic effect. Electrical stimulation elevates the transmembrane voltage and results in the elevation of electrical conductivity of the cell membrane.33 Due to this effect, the function of cell membrane protein, lipids, as well as expression of genes alters and this leads to cell proliferation. In spite of four hours per day therapy by bone stimulator, in the PEMF-treated group (HLS+PEMF), we did not observe a significant increase in BMD, calcuim, phosphatase, or ALP activity. Type I collagen, osteocalcin, and also the cortical thickness of femur and tibia bone in HLS + P rats were less than in other treated rat groups (HLS + P + N, HLS + N). This is attributed to the lack of adequate calcium in the body system (HLS + P). However, the beneficial effect of low-intensity electric stimulation (PEMF) on bone has been demonstrated in other models, such as sciatic neurectomy and ovariectomy.13–15,34
HAp and PEMF both have a propensity to enhance the expression level of bone formation marker by different mechanisms. PEMF increase growth factors such as insulin-like growth factor II (IGF-II), IGF-I, tumor growth factor- β (TGF-β) mRNA; modulate Ca2+ binding to CaM, upregulation of mRNA for bone morphogenetic protein-2 (BMP-2) and BMP-4.35,36
Conclusion
HAp nanoparticles adsorb significantly greater amounts of proteins and induce enhancement of subsequent cell adhesion and proliferation. When we used them synergistically, an increase in BMD, calcuim, phosphatase, ALP, type I collagen, and osteocalcin levels in HLS + P + N treated rats were observed as compared to HLS + N and HLS + P treated rats. Also, the mineral levels achieved after (HAp + PEMF) are comparable to ground animal data, suggesting that the treatment closely offsets the bone loss induced by microgravity. Hence, PEMF along with HAp is a positive countermeasure to prevent osteoporosis in simulated microgravity.
Figure 6.
SEM image of cancellous part of femur (HLS).
Abbreviations: HLS, hind-limb suspension; PEMF, pulsed electromagnetic field; SEM, scanning electron microscope.
Figure 7.
SEM image of cancellous part of femur (HLS + P).
Abbreviations: HLS, hind-limb suspension + pulsed electromagnetic field; SEM, scanning electron microscope.
Figure 10.
(A) SEM image of cortical part of femur (HLS + P). (B) SEM image of cortical part of femur (HLS + P + N).
Abbreviations: HLS + P, hind-limb suspension + PEMF; HLS + P + N, hind-limb suspension + PEMF + nanoparticle; SEM, scanning electron microscope.
Figure 11.
(A) SEM image of cortical part of tibia (Control). (B) SEM image of cortical part of tibia (HLS).
Abbreviations: HLS, hind-limb suspension; SEM, scanning electron microscope.
Footnotes
Disclosure
The authors report no conflicts of interest in this work.
References
- 1.Li J, Sarosi I, Yan XQ, et al. RANK is the intrinsic hematopoietic cell surface receptor that controls osteoclastogenesis and regulation of bone mass and calcium metabolism. Proc Natl Acad Sci U S A. 2000;97:566–571. doi: 10.1073/pnas.97.4.1566. [DOI] [PMC free article] [PubMed] [Google Scholar]
- 2.Iki M, Kajita E, Dohi Y, et al. Age, menopause, bone turnover markers and lumbar bone loss in healthy Japanese women. Maturitas. 1996;25:59–67. doi: 10.1016/0378-5122(96)01042-0. [DOI] [PubMed] [Google Scholar]
- 3.Sirola J, Kroger H, Honkanen R, et al. Factors affecting bone loss around menopause in women without HRT: a prospective study. Maturitas. 2003;45:159–167. doi: 10.1016/s0378-5122(03)00150-6. [DOI] [PubMed] [Google Scholar]
- 4.Convertino VA, Sandler H. Exercise countermeasures for spaceflight. Acta Astronaut. 1995;35:253–270. doi: 10.1016/0094-5765(95)98731-n. [DOI] [PubMed] [Google Scholar]
- 5.Rambaut PC, Leach CS, Whedon GD. A study of metabolic balance in crew members of Skylab IV. Acta Astronaut. 1979;6:1313–1322. doi: 10.1016/0094-5765(79)90123-1. [DOI] [PubMed] [Google Scholar]
- 6.Whedon GD, Lutwak L, Reid J, et al. Mineral and nitrogen balance study: results of metabolic observations on Skylab II 28-day orbital mission. Acta Astronaut. 1975;2:297–309. doi: 10.1016/0094-5765(75)90097-1. [DOI] [PubMed] [Google Scholar]
- 7.Smith BJ, King JB, Lucas EA, Akhter MP, Arjmandi BH, Stoecker BJ. Skeletal unloading and dietary copper depletion are detrimental to bone quality of mature rats. J Nutr. 2002;132:190–196. doi: 10.1093/jn/132.2.190. [DOI] [PubMed] [Google Scholar]
- 8.Derendorf H. Pharmacokinetic/pharmacodynamic consequences of space flight. J Clin Pharmacol. 1994;34:684–691. doi: 10.1002/j.1552-4604.1994.tb02024.x. [DOI] [PubMed] [Google Scholar]
- 9.Czarnik TR, Vernikos J. Physiological changes in spaceflight that may affect drug action. J Gravit Physiol. 1999;6:161–164. [PubMed] [Google Scholar]
- 10.Jee WSS, Wronski TJ, Morey ER, Kimmel DB. Effects of spaceflight on trabecular bone in rat. Am J Physiol. 1983;244:310–314. doi: 10.1152/ajpregu.1983.244.3.R310. [DOI] [PubMed] [Google Scholar]
- 11.Ilyina-Kakueva EI, Portugalov VV, Krivenkova NP. Spaceflight effects on the skeletal muscles of rats. Aviat Space Environ Med. 1976;47:700–703. [PubMed] [Google Scholar]
- 12.Wimalawansa SM, Wimalawansa SJ. A novel pharmacological approach of musculoskeletal losses associated with simulated microgravity. J Musculoskel Neuron Interact. 2000;11:35–41. [PubMed] [Google Scholar]
- 13.Behari J, Arya VP, Alex ZC. Bone fracture healing using a capacitatively coupled RF field. J Bioelect. 1991;10:1, 231–239. [Google Scholar]
- 14.Jayanand Behari J, Lochan R. Effects of low level pulsed radio frequency fields on induced osteoporosis in rat bone. Indian J Exp Biol. 2003;41:581–586. [PubMed] [Google Scholar]
- 15.Jayanand Behari J. Treatment of Induced Osteoporosis Using Capacitively Coupled Electromagnetic Field Exposure. New Delhi, India: Proceeding of International Union of Radio Science (URSI); 2005. [Google Scholar]
- 16.Bassett CAL, Pawluk RJ, Pilla A. Acceleration of fracture repair by electromagnetic fields. A surgically non-invasive method. Ann NY Acad Sci. 1974;238:242–262. doi: 10.1111/j.1749-6632.1974.tb26794.x. [DOI] [PubMed] [Google Scholar]
- 17.Balasundaram G, Fleet JC, Weaver CM, Friedman AM, Weatherman RV, Webster TJ.Nanomaterials for osteoporosis treatment Bioengineering Conference, Proceedings of the IEEE 31st Annual Northeast2005 April 2–3170–171.DOI 10.1109/NEBC.2005.1431977. [Google Scholar]
- 18.Balasundaram G, Sato M, Webster TJ. Using hydroxyapatite nanoparticles and decreased crystallinity to promote osteoblast adhesion similar to functionalizing with RGD. Biomaterials. 2006;27:2798–2805. doi: 10.1016/j.biomaterials.2005.12.008. [DOI] [PubMed] [Google Scholar]
- 19.Weiner S, Wagner HD. The material bone: structure-mechanical function relations. Annu Rev Mater Sci. 1998;28:271–278. [Google Scholar]
- 20.Mann S. Biomineralization: Principles and concepts in bioinorganic materials chemistry. Oxford, UK: Oxford University Press; 2001. pp. 97–98. [Google Scholar]
- 21.Tang R, Wang L, Orme CA, Bonstein T, Bush PJ, Nancollas GH. Dissolution at the nanoscale: self-preservation of biominerals. Angew Chem Int Ed Engl. 2004;43:2697–2701. doi: 10.1002/anie.200353652. [DOI] [PubMed] [Google Scholar]
- 22.Alivisatos AP. Biomineralisation. Naturally aligned nanocrystrals. Science. 2000;289:736–737. doi: 10.1126/science.289.5480.736. [DOI] [PubMed] [Google Scholar]
- 23.Boskey AL, DiCarlo E, Paschalis E, et al. Comparison of mineral quality and quantity in iliac crest biopsies from high- and low-turnover osteoporosis and FT-IR microspectroscopic investigation. Osteoporos Int. 2005;16:2031–2038. doi: 10.1007/s00198-005-1992-3. [DOI] [PMC free article] [PubMed] [Google Scholar]
- 24.Cerroni L, Filocamo R, Fabbri M, Piconi C, Caropreso S, Condò SG. Growth of osteoblast-like cells on porous hydroxyapatite ceramics: an in vitro study. Biomol Eng. 2002;19:119–124. doi: 10.1016/s1389-0344(02)00027-8. [DOI] [PubMed] [Google Scholar]
- 25.Yuasa T, Miyamoto Y, Ishikawa K, et al. Effect of apatite cements on proliferation and differentiation of human osteoblasts in vitro. Biomaterials. 2004;25:1159–1166. doi: 10.1016/j.biomaterials.2003.08.003. [DOI] [PubMed] [Google Scholar]
- 26.Kim SR, Lee JH, Kim YT, et al. Synthesis of Si, mg substituted hydroxyapatites and their sintering behaviors. Biomaterials. 2003;24:1389–1398. doi: 10.1016/s0142-9612(02)00523-9. [DOI] [PubMed] [Google Scholar]
- 27.Epstein S. Serum and urinary markers of bone remodeling: assessment of bone remodeling: assessment of bone turnover. Endocr Rev. 1988;9:437–448. doi: 10.1210/edrv-9-4-437. [DOI] [PubMed] [Google Scholar]
- 28.Hauschka PV. Calcium-dependent alpha-helical structure in osteocalcin. Biochemistry. 1982;21:2538–2547. doi: 10.1021/bi00539a038. [DOI] [PubMed] [Google Scholar]
- 29.Wassell DT, Hall RC, Embery G. Adsorption of bovine serum albumin onto hydroxyapatite. Biomaterials. 1995;16:697–702. doi: 10.1016/0142-9612(95)99697-k. [DOI] [PubMed] [Google Scholar]
- 30.Cai Y, Liu Y, Yan W, et al. Role of hydroxyapatite nanoparticles size in bone cell proliferation. J Mater Chem. 2007;17:3780–3787. [Google Scholar]
- 31.Rouahi M, Champion E, Gallet O, Jada A, Anselme K. Physicochemical characteristics and protein adsorption potential of hydroxyapatite particles: Influence on in vitro biocompatibility of ceramics after sintering. Colloids Surf B Biointerfaces. 2006;47:10–19. doi: 10.1016/j.colsurfb.2005.11.015. [DOI] [PubMed] [Google Scholar]
- 32.Pezzatini S, Solito R, Morbidelli L, et al. The effect of hydroxyapatite nanocrystals on microvascular endothelial cell viability and functions. J Biomed Mater Res. 2006;76A:656–663. doi: 10.1002/jbm.a.30524. [DOI] [PubMed] [Google Scholar]
- 33.Berg H, Zhang L. Electrostimulation in cell biology by low-frequency electromagnetic fields. Bioelectrochem Bioenerg. 1993;12:147–163. [Google Scholar]
- 34.Behari J. Biophysical Bone Behavior: Principles and Applications. Hoboken, NJ: John Wiley; 2009. [Google Scholar]
- 35.Markov MS, Pilla AA. Weak static magnetic field modulation of myosin phosphorylation in a cell-free preparation: calcium dependence. Bioelectrochem Bioenerg. 1997;43:235–240. [Google Scholar]
- 36.Pilla A. Mechanism and therapeutic application of time-varying and static magnetic fields. In: Barnes F, Greenebaum B, editors. Handbook of Biological Effects of Electromagnetic Fields. 3rd edition. Baton Rouge, FL: CRC Press; 2006. pp. 1–79. [Google Scholar]


