

Abstract
Wistar Furth (WF) rats do not develop renal injury after severe reduction of renal mass. Because clinical and animal studies suggested that nitric oxide (NO) deficiency occurs and may contribute to chronic renal disease (CRD), the status of the NO system in WF versus Sprague Dawley (SD) rats was examined with the 5/6 renal ablation/infarction (A/I) model of CRD. Eleven weeks after A/I, SD rats developed proteinuria, severe kidney damage, decreased renal function, and marked decreases in total and renal NO synthase (NOS), specifically neuronal NOS. In contrast, WF rats exhibited elevated baseline and maintained post-A/I total NO production, with no decrease in renal cortex NOS activity despite a decrease in remnant neuronal NOS abundance. When low-dose chronic Nω-nitro-l-arginine methyl ester treatment was added for WF A/I-treated rats, rapid progression of CRD was observed. In conclusion, elevated NO production in WF rats was associated with protection from the progression of CRD after renal mass reduction. The protection might be attributable to greater total and renal NO-generating capacity and increased nephron number, compared with SD rats. NOS inhibition rendered WF rats susceptible to progression, suggesting a possible critical threshold for NO production, below which renal injury occurs.
Increasing evidence suggests that nitric oxide (NO) deficiency occurs as a result of chronic renal disease (CRD) and may contribute to injury progression. For example, animal models of CRD (1,2) and clinical studies of patients with CRD or ESRD (3–5) indicated decreased total NO production. Also, renal injury can be produced by chronic NO synthase (NOS) inhibition (6).
The 5/6 reduction of renal mass model is widely used to study CRD; in Sprague Dawley (SD) rats, progression of renal disease occurs rapidly, with the development of severe proteinuria and structural damage (7). SD rats also exhibit systemic and renal NO deficiencies after renal mass reduction (1,2) and l-arginine supplementation ameliorates renal injury, suggesting a causal role for the NO deficiencies in CRD progression (2,8).
Vulnerability to the development of CRD varies among rat strains and Wistar Furth (WF) rats are resistant, inasmuch as WF rats exhibit minimal proteinuria and no visible glomerulosclerosis 4 wk after 5/6 renal mass reduction (9). This strain difference was exploited in this study, which was conducted to test the hypothesis that NO deficiency plays a role in the progression of CRD. Specifically, we anticipated that WF rats would exhibit elevated baseline NO production, compared with SD rats, and/or maintained NO production after 5/6 reduction of renal mass.
Materials and Methods
Animals and Study Protocol
Studies were conducted with two strains of male rats, SD (n = 30) and WF (n = 32), which were purchased from Harlan Sprague Dawley (Indianapolis, IN) at 12 wk of age and age-matched. In the first series of experiments, sham-treated and 5/6 ablation/infarction (A/I)-treated groups of each strain were studied for an 11-wk period after surgery. The A/I surgery involved removal of the right kidney and ligation of two of the three branches of the left renal artery, to infarct approximately two-thirds of the left kidney mass. A/I and sham surgery (without removal of renal mass) were performed with general anesthesia (using a 1:1 mixture of the barbiturate anesthetics methohexital and pentobarbital, each at 2.5 mg/100 g body wt, administered intraperitoneally). All surgical procedures were performed under fully sterile conditions. The second series of experiments was conducted with only WF rats. All rats (n = 19) were subjected to 5/6 A/I; after 4 wk, 13 rats began to receive chronic NOS inhibition [Nω-nitro-l-arginine methyl ester (l-NAME), administered orally in drinking water at a concentration of 50 mg/L from week 4 to week 6 and at a concentration of 25 mg/L from week 6 to week 7.5]. The first cohort of l-NAME-treated rats (n = 5) was used for histologic evaluations. A second cohort (n = 8) was monitored in metabolic cages and euthanized for tissue NOS determinations. The mortality rate for the WF A/I- and l-NAME-treated rats was 28%.
Twenty-four-hour urine collections were performed before surgery (control) and 2, 4, 6, 8, 9, 10, and 11 wk after surgery in the studies in series 1. In the studies in series 2, measurements were made before and 2, 4, 5, 6, and 7 wk after A/I. All rats were placed on a diet with low levels of NO2 plus NO3 (NOx) (AIN 76C; ICN, Costa Mesa, CA) 2 to 3 d before being placed in metabolic cages, and urine was collected for determination of total protein levels, NOx levels, and creatinine excretion. Total protein levels were determined by using the Bradford assay, and NOx levels were measured by using the Greiss reaction, as described previously (10). Creatinine levels were measured with HPLC by using an assay described previously (11), with the following modifications. We used a Waters (Milford, MA) 600s controller and 616 pump to deliver 96% eluent A (20 mM KH2PO4, pH adjusted to 7.5) and 4% eluent B (100% HPLC-grade methanol) at 1.0 ml/min, with a column temperature of 25°C. Ten-microliter samples were injected with a Waters 717 Plus autosampler, and the eluted products were measured with a Waters UV 486 absorbance detector, at a wavelength of 220 nm. Plasma and urine samples were ultrafiltered at 15,000 rpm for 40 min, with centrifugation filters with a 10,000 mol wt cutoff (Ultrafree-MC; Amicon, Bedford, MA). Recovery was 89 ± 1% (for plasma spiked with 1 mg/dl, n = 8); replicate measurements (n = 10) of control plasma samples yielded a coefficient of variation of 2.7%, and the interassay variability (n = 6 runs) for an internal plasma standard was 6.9%. BP was measured via the aorta, under anesthesia, just before euthanasia; blood was then collected and tissues were harvested. Plasma NOx and creatinine levels were determined as described above, and blood urea nitrogen levels were measured with a Sigma kit (no. 640-A; Sigma Chemical Co., St. Louis, MO).
NOS Activity Assays
NOS activity was measured as the conversion of l-[3H]arginine to l-[3H]citrulline in kidney cortex, as described previously (12). Briefly, tissues were homogenized in iced homogenization buffer and ultracentrifuged, and supernatants were used for assays. Endogenous arginine was removed by using Dowex columns, and samples were assayed in triplicate at baseline and in duplicate in the presence of the nonselective NOS inhibitors NG-monomethyl-l-arginine (5 mM) and l-NAME (10 mM) and the calcium chelator trifluoperazine (2 mM). Data are expressed as picomoles of l-[3H]arginine converted to l-[3H]citrulline per minute per milligram of protein minus any activity not inhibited by the NOS inhibitor cocktail, with adjustment for background levels. Background levels were determined in heat-inactivated samples and were <5% of the 100% standard, representing free tritium or noncationic tritiated species not bound by the Dowex resin. The 100% standard was prepared without Dowex column purification, and this value represented the total counts available for conversion.
Western Blot Analyses
Briefly, neuronal NOS (nNOS) was detected with a rabbit polyclonal antibody (13) (1:5000 dilution, 1 h; secondary antibody, goat anti-rabbit IgG-horseradish peroxidase conjugate, 1:3000 dilution, 1 h; Bio-Rad, Richmond, CA). Membranes were stripped and reprobed for endothelial NOS (eNOS) (mouse mAb, 1:250 dilution, 1 h; Transduction Laboratories, Lexington, KY; secondary antibody, goat anti-mouse IgG-horseradish peroxidase conjugate, 1:2000 dilution, 1 h; Transduction Laboratories). All steps were performed at room temperature. Bands of interest were detected with enhanced chemiluminescence reagent and were quantitated densitometrically, as integrated OD values after subtraction of background values. The integrated OD values were normalized with respect to ponceau red staining, to correct for variations in total protein loading, and an internal standard (eNOS, 10 μg of bovine aortic endothelial cell lysate; nNOS, 1 μg of rat cerebellar homogenate), to allow comparisons between different membranes. Additional details were presented previously (12).
Glomerular Counting
The method used was a modification of that described by Damadian et al. (14). Briefly, the left kidney was decapsulated, the medulla was removed and discarded, and the cortex was weighed, cut into six pieces, and incubated in 15 ml of 5 N HCl at 37°C for approximately 80 min. The HCl was removed, and the kidney was washed and then incubated in 50 ml of water for approximately 24 h at 4°C. Samples were then brought to room temperature, gently macerated with a pestle, and brought up to exactly 150 ml with water. An even suspension was created with gently swirling of the mixture, two or three 0.5-ml aliquots were placed in 35-mm2 culture dishes with 3.5-mm grids, and total glomeruli were counted with ×40 magnification.
Histologic assessments were performed with kidneys that had been fixed in 10% formalin and then embedded in paraffin wax. Sections (5 μm) were cut, stained (periodic acid-Schiff staining, with hematoxylin and eosin counterstaining), and examined, in a blinded manner, with respect to the level of glomerulosclerosis, the number of tubular casts, and the extent of tubulointerstitial injury.
Statistical Analyses
Statistical analyses were performed with the unpaired t test, Wilcoxon rank sum analysis, Kruskal-Wallis test, repeated-measures ANOVA, and least-squares means assessment. All data are expressed as mean ± SEM.
Results
As demonstrated in Figure 1, SD sham-treated rats demonstrated a slow, mild, age-dependent increase in protein excretion, whereas SD A/I-treated rats were proteinuric 2 wk after A/I, with further increases in urinary protein excretion (UpV) until week 6. In contrast, the WF A/I-treated rats demonstrated no increase in UpV until 4 wk after A/I and then exhibited a slow mild increase that achieved values similar to those for SD sham-treated rats from week 8 onward. This did represent a significant increase in UpV in response to A/I, because the WF sham-treated rats demonstrated no change in UpV during the 11-wk period. UpV was much higher in SD A/I-treated rats than in WF A/I-treated rats from 2 to 11 wk (P < 0.0001), and UpV was always higher in SD sham-treated rats than in WF sham-treated rats (P < 0.0001).
Figure 1.
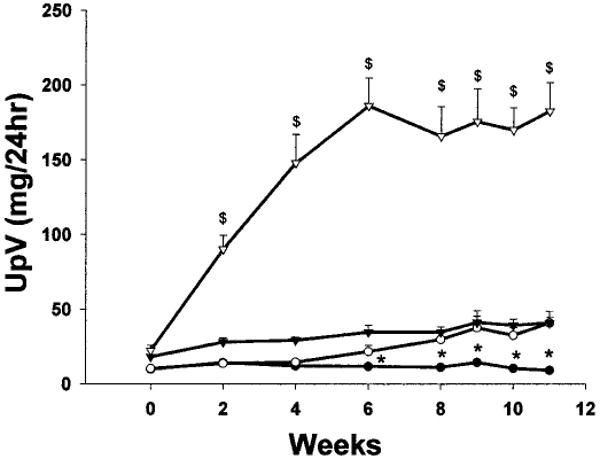
Total urinary protein excretion (UpV) in Wistar Furth (WF) (circles) and Sprague Dawley (SD) (triangles) rats during the 11-wk period after 5/6 ablation/infarction (A/I) or sham surgery. Solid symbols, sham data; open symbols, A/I data. $P < 0.0001, significant difference between SD A/I-treated rats and all other groups. *P < 0.05, significant difference between WF sham-treated and WF A/I-treated rats.
Both SD and WF rats demonstrated significant increases in blood urea nitrogen and plasma creatinine levels 11 wk after A/I, compared with sham-treated rats, reflecting decreased renal function, as indicated by reductions in 24-h creatinine clearance (Table 1). Absolute values for creatinine clearance were similar in sham-treated SD and WF rats (3.2 ± 0.2 versus 3.0 ± 0.2 ml/min) but, with correction for body weight, values were higher in WF rats than in SD rats (Table 1). Eleven weeks after A/I, the SD rats demonstrated a much greater decrease (to approximately 25% of the sham value), compared with the approximately 50% decrease in WF A/I-treated rats. Also, there was no difference in BP in WF sham-treated versus A/I-treated rats, whereas the SD A/I-treated rats become hypertensive, compared with all other groups.
Table 1.
Functional indices for WF and SD sham-treated and A/I-treated rats, 11 wk after surgerya
| BUN (mg/dl) | PCr (μM) | Ccr (ml/min per 100 g body wt) | BP (mmHg) | PNOx (μM) | PNOx/PCr | |
|---|---|---|---|---|---|---|
| WF sham | 11 ± 1 | 0.29 ± 0.01 | 8.4 ± 0.5 | 87 ± 6 | 13.3 ± 0.9 | 0.52 ± 0.03 |
| WF A/I | 27 ± 3b | 0.61 ± 0.03b | 3.6 ± 0.2b | 97 ± 4 | 22.4 ± 1.4b | 0.44 ± 0.03b |
| SD sham | 17 ± 1c | 0.37 ± 0.01c | 6.9 ± 0.4c | 97 ± 6 | 12.8 ± 1.5 | 0.38 ± 0.04c |
| SD A/I | 77 ± 13b,c | 1.67 ± 0.17b,c | 1.7 ± 0.3b,c | 119 ± 3b,c | 28.1 ± 2.6b | 0.22 ± 0.03b,c |
WF, Wistar Furth; SD, Sprague Dawley; BUN, blood urea nitrogen; PCr, plasma creatinine concentration; Ccr, creatinine clearance; PNOx, plasma NO2 plus NO3 concentration; A/I, ablation/infarction.
P < 0.05, significant difference between sham- and A/I-treated rats.
P < 0.05, significant difference between WF and SD rats.
The extent of structural damage at 11 wk after A/I was also markedly different between strains. Among the SD animals, A/I-treated rats had only 36 ± 7% undamaged glomeruli, compared with the sham value of 94 ± 1% (P < 0.001), whereas the WF A/I-treated rats demonstrated 91 ± 1% undamaged glomeruli, compared with 97 ± 1% for sham-treated rats (P < 0.005). In addition to WF rats having significantly fewer damaged glomeruli, compared with SD rats (P < 0.002), the severity of injury in each damaged glomerulus was less, as indicated in Figure 2. Other markers of damage included many tubular casts for the SD A/I-treated rats versus SD sham-treated rats (30 ± 5 versus 3 ± 1; P < 0.002), compared with very few casts for the WF A/I-treated rats (1.4 ± 1 casts per section; P < 0.002, WF versus SD) and none for the WF sham-treated rats. Representative sections of the renal cortex for both strains are presented in Figure 3; at 11 wk after A/I, the SD rats exhibited marked interstitial fibrosis, whereas the interstitium appeared mainly normal in the WF rats. The glomerular number was counted in normal rats of each strain (WF, n = 8; SD, n = 5) and was approximately 35% higher in WF rats than in SD rats (39,890 ± 1822 versus 30,359 ± 1404 glomeruli per kidney; P < 0.0025).
Figure 2.
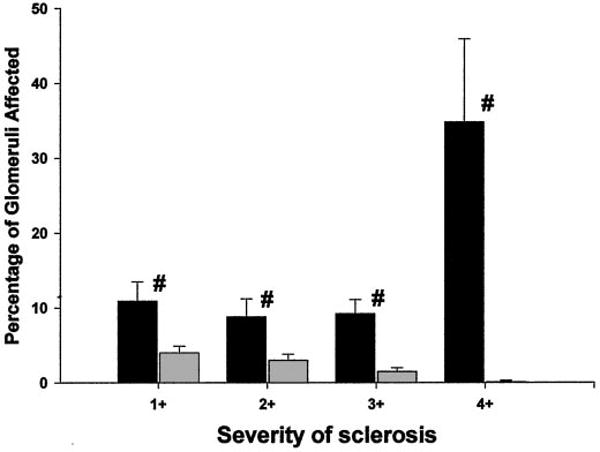
Glomerular injury in WF A/I-treated rats (gray bars) and SD A/I-treated rats (black bars), subdivided according to the severity of glomerular damage. The severity of glomerular injury (expressed as a percentage of the total) is given as follows: 1+, <25%; 2+, 25 to 50%; 3+, 51 to 75%; 4+, 76 to 100% damage to individual glomeruli. #P < 0.05, significant difference between WF A/I-treated and SD A/I-treated rats.
Figure 3.
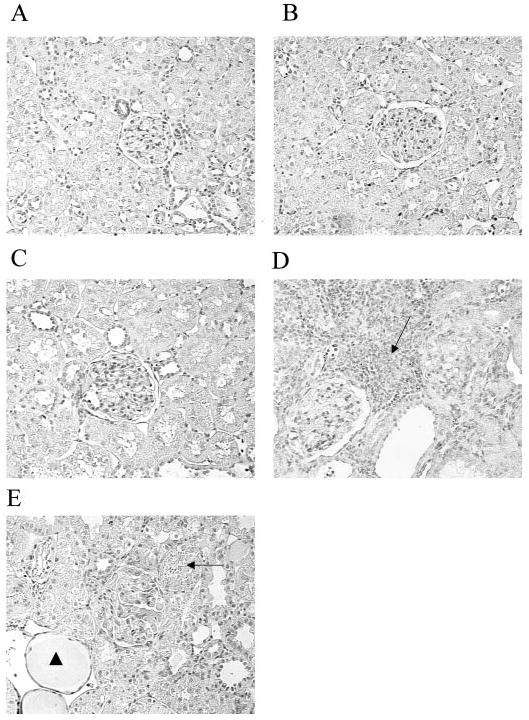
Representative kidney sections from different strains and treatment groups. Magnification, ×300. (A and B) WF sham-treated (A) and SD sham-treated (B) sections demonstrated normal kidneys with undamaged glomeruli (center). (C) In a WF A/I-treated section, there was little injury and the kidney was histologically similar to that in A. (D) The severity of injury was greater in a SD A/I-treated section, compared with both sham-treated and WF A/I-treated sections. The SD A/I-treated section exhibited severe interstitial fibrosis (arrow), loss of tubular organization, an obsolescent glomerulus (upper right), and an adjacent glomerulus displaying minimal sclerosis (lower left). (E) A WF A/I- and Nω-nitro-l-arginine methyl ester (l-NAME)-treated section exhibited severe renal injury, with localized areas of interstitial fibrosis (arrow), many casts (arrowhead), and a central obsolescent glomerulus.
As kidney damage developed in the SD A/I-treated rats, a progressive decline in total NO production [as indicated by 24-h urinary NOx excretion (UNOxV)] also occurred, at a much more rapid rate than the slow, age-dependent reduction observed in SD sham-treated rats (Figure 4). In contrast, the WF A/I- and sham-treated rats exhibited similar, very slow decreases, which were attenuated, compared with those observed for SD A/I- and sham-treated rats. Of note, under baseline conditions before surgery, WF rats exhibited greater total NO production, compared with age-matched SD rats, and this difference was maintained at 11 wk in both the sham-treated and A/I-treated groups. Plasma NOx levels were increased in both WF and SD rats after A/I, secondary to loss of renal function (Table 1). However, when the hemoconcentrating effect of CRD was eliminated by factoring plasma NOx levels by plasma creatinine levels, there was a slight decrease in WF A/I-treated versus WF sham-treated rats and a substantial decrease in SD A/I-treated versus SD sham-treated rats (Table 1). Because of the baseline difference (WF sham-treated values approximately 20% greater than SD sham-treated values) (Table 1), the plasma NOx/plasma creatinine ratio after A/I was greater (P < 0.001) for WF rats, compared with SD rats (Table 1). Taken together, the UNOxV and plasma NOx data suggest that total NO production is relatively maintained in the WF rats but not the SD rats after renal mass reduction.
Figure 4.
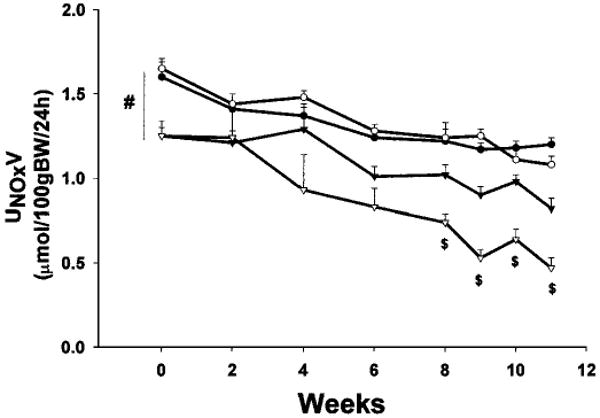
Twenty-four-hour urinary excretion of NO2 plus NO3 (UNOxV) by WF (circles) and SD (triangles) rats during the 11-wk period after A/I or sham surgery. Solid symbols, sham data; open symbols, A/I data. #P < 0.001, significant baseline difference between WF and SD rats. $P < 0.002, significant difference between SD A/I-treated rats and all other groups.
As indicated in Figure 5, both strains exhibited decreases in renal cortex nNOS protein abundance attributable to 5/6 A/I, but WF rats demonstrated significantly more nNOS protein than did SD sham-treated rats and this difference was maintained 11 wk after A/I. In fact, WF A/I-treated rats demonstrated cortical nNOS abundance similar to that of SD sham-treated rats. In the renal medulla, nNOS was more abundant in SD sham-treated rats than in WF sham-treated rats; after A/I, nNOS levels decreased in SD rats but not WF rats. Figure 6 presents the abundance of eNOS protein in kidney and demonstrates little difference attributable to strain or treatment. Despite the greater abundance of nNOS protein, the in vitro NOS activity was higher in the renal cortex of sham-treated SD rats, compared with WF rats (Figure 7). However, after A/I there was a marked decrease in NOS activity in the SD rats (in parallel with the decrease in nNOS protein levels), whereas activity actually increased in the WF rats.
Figure 5.
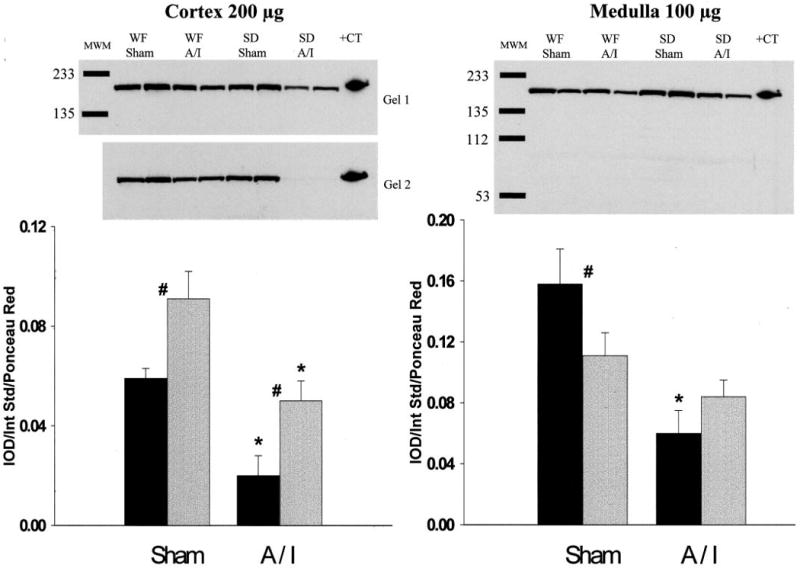
Relative abundance of neuronal nitric oxide synthase (NOS) in the cortex and medulla of WF (gray bars) and SD (black bars) rats, 11 wk after sham or A/I surgery. (Top) Representative gels (left, cortex, two gels; right, medulla, one gel). MWM, molecular weight markers; +CT, positive control. (Bottom) Average densitometric values [integrated OD (IOD)/internal standard (Int Std)/ponceau red]. #P < 0.05, significant difference between WF and SD rats. *P < 0.01, significant difference between sham- and A/I-treated rats.
Figure 6.
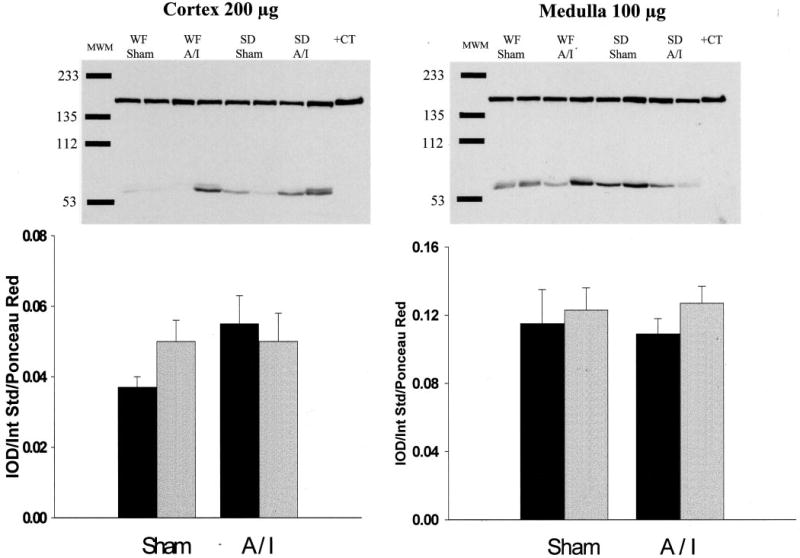
Relative abundance of endothelial NOS in the cortex and medulla of WF (gray bars) and SD (black bars) rats, 11 wk after sham or A/I surgery. (Top) Representative gels. MWM, molecular weight markers; +CT, positive control. (Bottom) Densitometric values [integrated OD (IOD)/internal standard (Int Std)/ponceau red].
Figure 7.
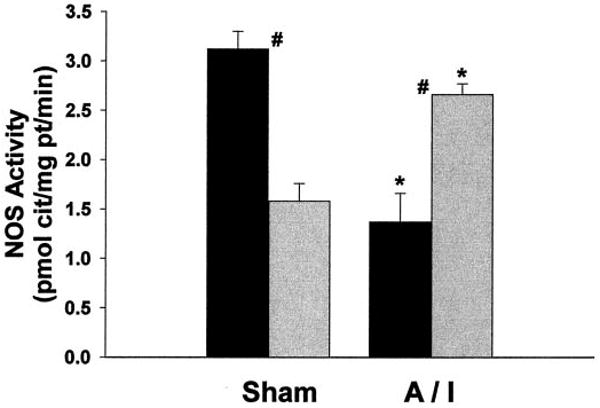
NOS activity (measured as the inhibitable conversion of arginine to citrulline) in the soluble fraction of cortical homogenates from WF (gray bars) and SD (black bars) rats after sham or A/I surgery. #P < 0.01, significant difference between WF and SD rats. *P < 0.002, significant difference between sham- and A/I-treated rats.
The second series of experiments studied the effects of chronic, low-dose NOS inhibition in WF rats after renal mass reduction. As expected, total NO production was reduced in WF A/I-treated rats treated chronically with l-NAME, as demonstrated in Figure 8, and levels decreased to values similar to those observed for SD rats 7 to 8 wk after A/I. Of particular note, l-NAME treatment caused proteinuria, increases in plasma creatinine levels, and significant hypertension (Figure 9). Unfortunately, the kidneys of those rats were lost during processing for pathologic assessments. However, pathologic results were available for a separate group of five WF rats subjected to combined NOS inhibition and A/I (identical protocol); those results demonstrated significant glomerular injury and many casts, compared with WF rats, 11 wk after A/I (82 ± 2 versus 91 ± 1% undamaged glomeruli, P < 0.05; 20 ± 9 versus 1 ± 1 casts, P < 0.01), as well as severe interstitial fibrosis (Figure 3E).
Figure 8.
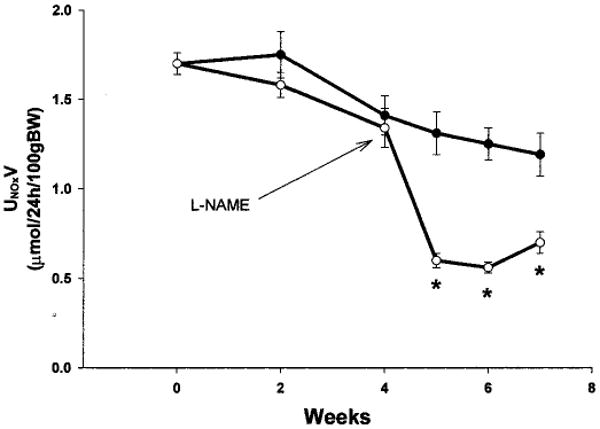
Twenty-four-hour UNOxV by WF A/I-treated rats (solid symbols) and WF A/I- plus l-NAME-treated rats (open symbols). l-NAME was administered at 50 mg/L from week 4 to week 6 and at 25 mg/L from week 6 to week 7.5. *P < 0.004, significant difference between WF A/I-treated and WF A/I- plus l-NAME-treated rats.
Figure 9.
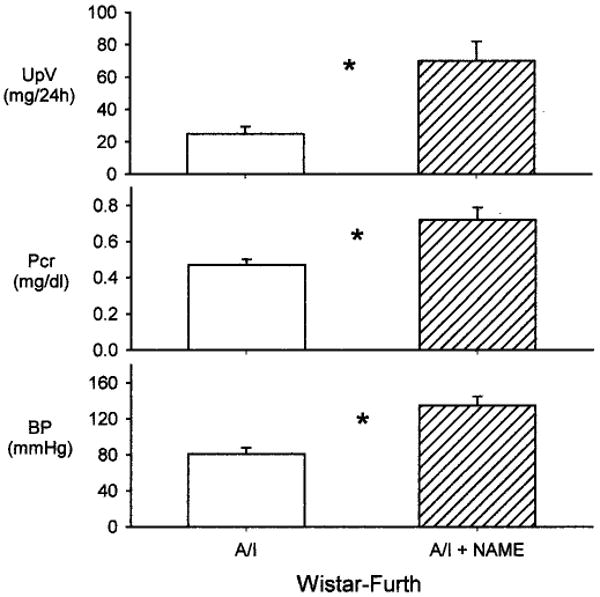
UpV (top), plasma creatinine levels (Pcr) (middle), and BP (bottom) in WF rats subjected to A/I (open bars) or A/I plus l-NAME treatment (hatched bars). *P < 0.05, difference between WF A/I-treated and WF A/I- plus l-NAME-treated rats.
Discussion
The findings of this study support earlier reports of reduced total and renal NO production in SD rats after 5/6 renal mass reduction (1,2,15,16) and very slow progression of CRD after A/I in WF rats (9). The novel finding of this study is that the elevated and maintained total and renal NO production in WF rats, compared with SD rats, is associated with preserved renal function and a low incidence of glomerular injury. Also, low-dose NOS inhibition after A/I renders the WF rats susceptible to the progression of CRD, strongly indicating the central importance of NO in the progression of CRD.
Most clinical studies indicate that patients with CRD or ESRD demonstrate reduced total NO production (3–5). Previous animal studies using renal mass reduction also demonstrated reduced total NO production and reduced renal NOS activity (1,15), whereas concurrent supplementation with l-arginine or antioxidants, to enhance NO production, decreased symptoms of CRD (2,17). Overall, these observations provide substantial evidence for reduced NO production in CRD. Separate animal studies using chronic NOS inhibition demonstrated that NO deficiency leads to proteinuria, glomerular hypertension, and renal injury (6). Together, these data suggest a vicious cycle in which NO deficiency is both a cause and a consequence of CRD, a potential mechanism contributing to progression.
In this study, SD rats exhibited elevated BP, significant renal injury, and severely decreased renal function 11 wk after A/I, whereas WF rats demonstrated minimal signs of progression. These findings confirm and extend the observations of Fitzgibbon et al. (9), in which WF rats were markedly resistant at 4 and 9 wk after 5/6 A/I, compared with Wistar rats. Our hypothesis was that, compared with SD rats, WF rats would exhibit an elevated basal and/or maintained NO system after 5/6 A/I, which would slow the progression of CRD and thus maintain renal function. In support of this hypothesis, we observed that WF rats exhibited elevated baseline total NO production (as indicated by 24-h UNOxV), compared with SD rats; after A/I, the WF rats maintained total NO production at the sham value and the function and structure of the remnant kidney were well maintained. Conversely, SD A/I-treated rats developed severe glomerular injury, in parallel with substantially decreased total NO production.
Studies using renal mass reduction have also demonstrated decreased nNOS, inducible NOS, and eNOS levels in the remnant kidney (15,16,18,19). Our laboratory recently demonstrated that renal nNOS levels were consistently reduced in several models of CRD in SD rats. In accelerated A/I (2 to 3 wk after 5/6 A/I, with high sodium and protein intakes), chronic glomerulonephritis, age-dependent injury, and the Zucker obese diabetic rat model (unpublished observation), both renal nNOS abundance and NOS activity were reduced (20,21,23). In this study, although cortical nNOS abundance was reduced by 5/6 A/I in both strains, WF rats exhibited elevated baseline abundance; at 11 wk after renal mass reduction, cortical nNOS protein levels in WF A/I-treated rats were no different from those in SD sham-treated rats. Also, medullary nNOS abundance was unaffected by A/I in the WF rats, whereas the SD rats demonstrated a significant reduction. The NOS activity measured in the soluble fraction of the renal cortex (reflecting primarily nNOS and any inducible NOS) was reduced after A/I in the SD rats but not the WF rats.
In contrast to nNOS, the renal abundance of eNOS did not differ among the strains or treatment groups in this study. The protein abundance of eNOS seems to be variable in models of renal mass reduction associated with significant injury, and increases (20), decreases (15,18,19), and no change (1) (this study) have been reported. The reasons for these differences are unclear but may be related to differences in rat strain, extent of renal mass reduction, time after renal mass reduction, or ablation versus A/I treatment. Another variable is whether the whole kidney remnant was examined or the cortex and medulla were examined separately, because the ratio of functioning medulla to cortex is variable with the renal mass reduction model. Also, it seems that eNOS levels vary in different models of CRD. eNOS abundance is reduced in age-dependent injury (23), unchanged in a chronic model of glomerulonephritis (21), and variably affected in renal mass reduction models, as described above. Of note, Kang et al. (19) recently demonstrated regional changes in eNOS expression in the A/I model, with reductions in glomerular and peritubular capillary expression but no change or even hyperplasia in the preglomerular vessels.
If elevated/maintained renal NO is responsible for protection in the WF rats, then NOS inhibition should render the WF rats susceptible to the progression of CRD. We tested this hypothesis in WF rats treated with chronic NOS inhibition for an additional 3.5 to 4 wk after A/I. The protocol needed to be shortened (from 11 wk) and the dose of l-NAME reduced at week 6 because of the drastic accelerating effects of NOS inhibition in the WF rats. The low level of NOS inhibition we used caused increased proteinuria, severe kidney damage, and decreased renal function, compared with age-matched WF A/I-treated rats. l-NAME, as expected, also caused significant decreases in total NO production and reduced UNOxV to the levels observed for SD rats after A/I. These findings support the general hypothesis that decreased renal NO production contributes to increased renal injury, which is also supported by our studies in the aging rat kidney. Whereas male SD rats exhibit age-dependent decreases in total and renal NO production and develop severe proteinuria, glomerulosclerosis, and functional impairment (23,24), female rats exhibit maintained total and renal NO production and develop little glomerular injury with age (23).
Why WF rats are resistant to the progression of CRD after A/I is not clear. However, hypertension is a leading cause of renal disease and accelerates underlying injury, and the SD rats exhibited elevated BP by 11 wk after A/I, which was not observed for the WF rats. Administration of low-dose l-NAME also caused significant hypertension in the WF A/I-treated rats. In fact, the primary risk factor was glomerular, rather than systemic, hypertension, because antihypertensive agents that did not decrease glomerular BP (triple therapy) did not prevent renal injury after A/I, although systemic pressure was decreased (25). Fitzgibbon et al. (9) reported similar results in a comparison of vulnerable Wistar rats and resistant WF rats; Wistar rats with 5/6 A/I that were given triple therapy to decrease BP to levels observed in WF rats still developed albuminuria to a much greater extent. Therefore, although high BP is likely to be an exacerbating factor when present, protection from systemic hypertension is unlikely to be the primary reason for the lack of progression in WF rats with 5/6 A/I.
WF rats are also unique in that they are resistant to the development of mineralocorticoid-induced hypertension and kidney damage (e.g., deoxycorticosterone acetate/salt) (9,26). Recent observations implicated aldosterone as a contributing factor in progressive renal disease (27). After renal mass reduction, aldosterone levels are not increased in WF rats but do increase in the vulnerable Wistar rats (9), which might be related to the protection from hypertension and CRD progression exhibited by the WF rats. Also, although it is well known that blockade of angiotensin II (and thus reduction of aldosterone levels) is protective for the remnant kidney after ablation (25), blockade of the angiotensin system has also been demonstrated to preserve renal nNOS abundance (16). Exactly what relationship exists between renal NO and the activity of the renin-angiotensin-aldosterone system in the pathogenesis of CRD is not yet clear.
Another important variable determining the susceptibility of individuals to the development of hypertension and CRD is nephron number, with a reduced number of nephrons representing a risk factor (28). We observed a striking difference in nephron number between WF and SD rats, with WF rats having approximately 30% more glomeruli than SD rats. This difference in nephron number may contribute to the resistance of WF rats to CRD progression after A/I. Regardless of the mechanisms of protection, it is clear that WF rats mount a vigorous compensatory hyperfiltration response to 5/6 A/I, because GFR in the remnant kidney at 11 wk was approximately 50% of the two-kidney sham-treated value. In contrast to SD rats, however, this hyperfiltration does not damage the WF remnant kidney.
In conclusion, WF rats exhibit elevated basal and maintained post-A/I NO production, compared with SD rats, in a 5/6 A/I model. The maintained NO is clearly central in the protection of the WF rats from progression, because mild chronic NOS inhibition caused immediate progression in these rats. Renal nNOS seems to be most acutely and severely affected. Perhaps there is a critical level of NO production, below which progression of renal disease occurs. This may be linked to the higher nephron number exhibited by the WF rats.
Acknowledgments
These studies were supported by National Institutes of Health Grant R01-DK56843 (to Dr. Baylis). The excellent technical assistance of Kevin Engels, Gary Freshour, and Lennie Samsell is gratefully acknowledged. This work was previously reported in abstract form (29,30).
References
- 1.Aiello S, Noris M, Todeschini M, Zappella S, Foglieni C, Benigni A, Corna D, Zoja C, Cavallotti D, Remuzzi G. Renal and systemic nitric oxide synthesis in rats with renal mass reduction. Kidney Int. 1997;52:171–181. doi: 10.1038/ki.1997.317. [DOI] [PubMed] [Google Scholar]
- 2.Ashab I, Peer G, Blum M, Wollman Y, Chernihovsky T, Hassner A, Schwartz D, Cabili S, Silverberg D, Iaina A. Oral administration of l-arginine and captopril in rats prevents chronic renal failure by nitric oxide production. Kidney Int. 1995;47:1515–1521. doi: 10.1038/ki.1995.214. [DOI] [PubMed] [Google Scholar]
- 3.Schmidt RJ, Baylis C. Total nitric oxide production is low in patients with chronic renal disease. Kidney Int. 2000;58:1261–1266. doi: 10.1046/j.1523-1755.2000.00281.x. [DOI] [PMC free article] [PubMed] [Google Scholar]
- 4.Schmidt RJ, Yokota S, Tracy TS, Sorkin MI, Baylis C. Nitric oxide production is low in end-stage renal disease patients on peritoneal dialysis. Am J Physiol. 1999;276:F794–F797. doi: 10.1152/ajprenal.1999.276.5.F794. [DOI] [PMC free article] [PubMed] [Google Scholar]
- 5.Schmidt R, Domico J, Samsell L, Yokota S, Tracy T, Sorkin M, Engels K, Baylis C. Indices of activity of the nitric oxide system in patients on hemodialysis. Am J Kidney Dis. 1999;34:228–234. doi: 10.1053/AJKD03400228. [DOI] [PMC free article] [PubMed] [Google Scholar]
- 6.Zatz R, Baylis C. Chronic nitric oxide inhibition model six years on. Hypertension. 1998;32:958–964. doi: 10.1161/01.hyp.32.6.958. [DOI] [PMC free article] [PubMed] [Google Scholar]
- 7.Moskowitz DW, Schneider AN, Lane PH, Schmitz PG, Gillespie KN. Effect of epidermal growth factor in the rat 5/6 renal ablation model. J Am Soc Nephrol. 1992;3:1113–1118. doi: 10.1681/ASN.V351113. [DOI] [PubMed] [Google Scholar]
- 8.Katoh T, Takahashi K, Klahr S, Reyes AA, Badr KF. Dietary supplementation with l-arginine ameliorates glomerular hypertension in rats with subtotal nephrectomy. J Am Soc Nephrol. 1994;4:1690–1694. doi: 10.1681/ASN.V491690. [DOI] [PubMed] [Google Scholar]
- 9.Fitzgibbon WR, Greene EL, Grewal JS, Hutchison FN, Self SE, Latten SY, Ullian ME. Resistance to remnant nephropathy in the Wistar-Furth rat. J Am Soc Nephrol. 1999;10:814–821. doi: 10.1681/ASN.V104814. [DOI] [PubMed] [Google Scholar]
- 10.Suto T, Losonczy G, Qiu C, Hill C, Samsell L, Ruby J, Charon N, Venuto R, Baylis C. Acute changes in urinary excretion of nitrate + nitrite (UNOxV) do not predict renal vascular NO production. Kidney Int. 1995;48:1272–1277. doi: 10.1038/ki.1995.411. [DOI] [PubMed] [Google Scholar]
- 11.Yang YD. Simultaneous determination of creatine, uric acid, creatinine and hippuric acid in urine by high performance liquid chromatography. Biomed Chromatogr. 1998;12:47–49. doi: 10.1002/(SICI)1099-0801(199803/04)12:2<47::AID-BMC717>3.0.CO;2-Y. [DOI] [PubMed] [Google Scholar]
- 12.Xiao S, Erdely A, Wagner L, Baylis C. Uremic levels of BUN do not cause nitric oxide deficiency in rats with normal renal function. Am J Physiol. 2001;49:F996–F1000. doi: 10.1152/ajprenal.2001.280.6.F996. [DOI] [PubMed] [Google Scholar]
- 13.Lau KS, Grange RW, Chang WJ, Kamm KE, Sarelius I, Stull JT. Skeletal muscle contractions stimulate cGMP formation and attenuate vascular smooth muscle myosin phosphorylation via nitric oxide. FEBS Lett. 1998;431:71–74. doi: 10.1016/s0014-5793(98)00728-5. [DOI] [PubMed] [Google Scholar]
- 14.Damadian RV, Shwayri E, Bricker NS. On the existence of non-urine forming nephrons in the diseased kidney of the dog. J Lab Clin Med. 1965;65:26–39. [PubMed] [Google Scholar]
- 15.Vaziri ND, Ni Z, Wang XQ, Oveisi F, Zhou XJ. Downregulation of nitric oxide synthase in chronic renal insufficiency: Role of excess PTH. Am J Physiol. 1998;274:F642–F649. doi: 10.1152/ajprenal.1998.274.4.F642. [DOI] [PubMed] [Google Scholar]
- 16.Roczniak A, Fryer JN, Levine DZ, Burns KD. Downregulation of neuronal nitric oxide synthase in the rat remnant kidney. J Am Soc Nephrol. 1999;10:704–713. doi: 10.1681/ASN.V104704. [DOI] [PubMed] [Google Scholar]
- 17.Vaziri ND, Ni Z, Oveisi F, Liang K, Pandian R. Enhanced nitric oxide inactivation and protein nitration by reactive oxygen species in renal insufficiency. Hypertension. 2002;39:135–141. doi: 10.1161/hy0102.100540. [DOI] [PubMed] [Google Scholar]
- 18.Fujihara CK, Mattar AL, Vieira JM, Jr, Malheiros DM, Noronha Ide L, Goncalves AR, De Nucci G, Zatz R. Evidence for the existence of two distinct functions for the inducible NO synthase in the rat kidney: Effect of aminoguanidine in rats with 5/6 ablation. J Am Soc Nephrol. 2002;13:2278–2287. doi: 10.1097/01.asn.0000027354.12330.f4. [DOI] [PubMed] [Google Scholar]
- 19.Kang DH, Nakagawa T, Feng L, Johnson RJ. Nitric oxide modulates vascular disease in the remnant kidney model. Am J Pathol. 2002;161:239–248. doi: 10.1016/S0002-9440(10)64175-2. [DOI] [PMC free article] [PubMed] [Google Scholar]
- 20.Szabo A, Wagner L, Erdely A, Lau K, Baylis C. Renal neuronal nitric oxide synthase protein expression as a marker of renal function. Kidney Int. 2003 doi: 10.1046/j.1523-1755.2003.00260.x. in press. [DOI] [PubMed] [Google Scholar]
- 21.Wagner L, Riggleman A, Erdely A, Couser W, Baylis C. Reduced nitric oxide synthase activity in rats with chronic renal disease due to glomerulonephritis. Kidney Int. 2002;62:532–536. doi: 10.1046/j.1523-1755.2002.00465.x. [DOI] [PMC free article] [PubMed] [Google Scholar]
- 22.Deleted in proof
- 23.Erdely A, Greenfeld Z, Wagner L, Baylis C. Sexual dimorphism in the aging kidney: Effects on injury and nitric oxide system. Kidney Int. 2003;63:1021–1026. doi: 10.1046/j.1523-1755.2003.00830.x. [DOI] [PMC free article] [PubMed] [Google Scholar]
- 24.Hill C, Lateef AM, Engels K, Samsell L, Baylis C. Basal and stimulated nitric oxide in control of kidney function in the aging rat. Am J Physiol. 1997;272:R1747–R1753. doi: 10.1152/ajpregu.1997.272.6.R1747. [DOI] [PMC free article] [PubMed] [Google Scholar]
- 25.Anderson S, Brenner BM. Therapeutic implications of converting-enzyme inhibitors in renal disease. Am J Kidney Dis. 1987;1(Suppl 1):81–87. [PubMed] [Google Scholar]
- 26.Ullian ME, Islam MM, Robinson CJ, Fitzgibbon WR, Tobin ET, Paul RV. Resistance to mineralocorticoids in Wistar-Furth rats. Am J Physiol. 1997;272:H1454–H1461. doi: 10.1152/ajpheart.1997.272.3.H1454. [DOI] [PubMed] [Google Scholar]
- 27.Hostetter TH, Rosenberg ME, Ibrahim HN, Juknevicius I. Aldosterone in renal disease. Curr Opin Nephrol Hypertens. 2001;10:105–110. doi: 10.1097/00041552-200101000-00016. [DOI] [PubMed] [Google Scholar]
- 28.Brenner BM, Mackenzie HS. Nephron mass as a risk factor for progression of renal disease. Kidney Int Suppl. 1997;63:S124–S127. [PubMed] [Google Scholar]; Baylis C A. J Am Soc Nephrol. 2001;12:812A. [Google Scholar]