

Abstract
Recent attempts to integrate geographic information systems (GIS) and participatory techniques, have given rise to terminologies such as participatory GIS and community-integrated GIS. Although GIS was initially developed for physical geographic application, it can be used for the management and analysis of health and health care data. Geographic information systems, combined with participatory methodology, have facilitated the analysis of access to health facilities and disease risk in different populations. Little has been published about the usefulness of combining participatory methodologies and GIS technology in an effort to understand and inform community-based intervention studies, especially in the context of HIV. This article attempts to address this perceived gap in the literature. The authors describe the application of participatory research methods with GIS in the formative phase of a multisite community-based social mobilization trial, using voluntary counseling and testing and post-test support as the intervention.
INTRODUCTION
Understanding both physical and social environments is a prerequisite to planning and implementation of community-based research. The visualization capacity of information management tools such as Geographical Information Systems (GIS) can assist researchers in capturing the broader spatial and social contexts of communities. The benefit of GIS technology is that it provides for the rapid integration of data from a variety of sources, with the added benefit of computer graphics display (Zenilman et al., 2002). In South Africa, GIS data sets have also been linked to local census data allowing for analysis at the enumeration area (EA), place and sub-place name levels (Dube, 2005). Although GIS methodology forms part of the basis of many public health and epidemiological initiatives in the developed world (Bullen, Moon, & Jones, 1996), the developing world, especially Africa, lags far behind in the application of GIS to the study of health problems (Oppong, 2000), with the exception of malaria (Klinkenberg, van der Hoek, & Amarasinghe, 2004; Martin, Curtis, Fraser, & Sharp, 2002).
In recent decades, participatory research methods have emerged as valuable tools in social science research (Jemmot, Brown, & Dodds, 1998; Kelly & van der Riet, 2000; Lesser et al., 2005; Morin, Maiorana, Koester, Sheon, & Richards, 2003; Myrick, Aoki, Truax, Lemelle, & Lemp, 2005). These may include involving community members in research as well as working with them as equal partners in formulating and conducting research (O’Fallon & Dearry, 2002). Social scientists such as geographers, psychologists and planners have also employed cognitive mapping and mental mapping as participatory tools to facilitate human learning as well as to help understand community environments (Downs & Stea, 1973; Evans, Marrero, & Butler, 1981; Gould, 1973; Stea & Blaut, 1973; Ungar, 2000). Studies using cognitive mapping to understand environments have shown how individuals and groups tend to have different subjective mental maps of their perceived surroundings (Appleyard, 1973; Orleans, 1973; Tversky, 1993) and the impact of these mental mapping concepts on the quality and process of environmental designs and their importance in implementing any strategy of spatial behavior (Downs & Stea, 1973; Orleans, 1973).
Recent attempts to integrate GIS and participatory techniques have given rise to terminologies such as participatory GIS and community-integrated GIS. These techniques encourage community participation and involvement in the production of GIS data (Abbot et al., 1998; Cinderby, 1999). This combination of methods has been used in forestry conservation (Mbile, DeGrande, & Okon, 2003), in investigations of land cover in communities (Mapedza, Wright, & Fawcett, 2003) and for mapping community boundaries (Kienberger, Steinbruch, Blasckhke, Luis da Costa, & Gomes, 2005). These case studies also illustrate that it is possible to make appropriate use of GIS even in settings where human and financial resources are limited (Dunn, Atkins, & Townsend, 1997).
Although GIS was initially developed for physical geographic application, it can be used for the management and analysis of health and health-care data (Twigg, 1990). GIS, combined with participatory methodology, has facilitated the analysis of access to health facilities and disease risk in different populations (Brabyn & Barnett, 2004; Klinkenberg et al., 2004; Martin et al., 2002; Noor, Gikandi, Hay, Muga, & Snow, 2004; Noor, Zurovac, Hay, Ochola, & Snow, 2003; Smith, Barret, & Box, 2000; Zenilman et al., 2002) and in planning for health and social care (Foley, 2002). Hightower et al. (1998) show that it is feasible to use Geographical Positioning Systems (GPS) to produce highly accurate maps of communities illustrating altitude of houses, positions of health-care centres and mosquito breeding sites as well as other geographical variables of interest in their longitudinal study of malaria in Kenya.
Studies on the human immunodeficiency virus (HIV) and the acquired immunodeficiency disease (AIDS), which incorporate GIS and social science methods, appear to be limited. Killewo, Dahlgren, and Sandstrom (1994) used information on Tanzanian individuals collected during a prevalence study to characterize smaller geographical areas of several villages. This formed the basis for an aggregated analysis of geographical and social patterns relevant to HIV transmission in the study areas. Similarly, Weir, Morroni, Coetzee, Spencer, and Boerma (2002) incorporated GIS technology to identify where prevention programs can access sexual networks of individuals with high rates of new partner acquisition. The study also utilized GIS technology to determine whether current sexually transmitted infection or AIDS prevention programs were appropriately placed for the intervention.
To our knowledge, little has been published about the usefulness of combining participatory methodologies and GIS technology in an effort to understand and inform community-based intervention studies, especially in the context of HIV. This study attempts to address this perceived gap in the literature. We describe the application of participatory research methods with GIS in the formative phase of a multi-site community-based social mobilization trial, using voluntary counselling and testing (VCT) as the intervention.
METHODOLOGY
Research Design
The National Institute of Mental Health Project Accept is a multi-site community-level randomized controlled study, in which 34 communities in four sites in Africa (Zimbabwe, Tanzania and Soweto and Vulindlela in South Africa) and 14 communities in Thailand are being randomized to receive social mobilization in the form of community-based HIV voluntary counselling and testing (CBVCT). The intervention is compared with standard voluntary counselling and testing (SVCT). The CBVCT intervention has three major strategies: (1) to engage the community through community outreach; (2) to make VCT more available and accessible through rapid testing in community settings using mobile facilities and (3) to provide post-test support to people in the community who have tested, are associated with someone who has tested or who are interested in gaining more detailed information about HIV and AIDS. These strategies are designed to rapidly increase the number of people in the communities who know their status in order to change community norms about preventive behavior and thus reduce risk for HIV infection. The intervention is designed to have community-wide impact and to affect community members, irrespective of whether they participated directly in the intervention or not. This is the first international community-randomized Phase III trial to determine the efficacy of a behavioral/social science intervention with an HIV incidence endpoint. This study describes the strategies used during the pre-intervention phases of this multi-site study as implemented in Vulindlela, the rural South African site.
Research Site
KwaZulu-Natal is the largest province in South Africa and comprises 21% of the country’s population. Vulindlela is a rural area situated approximately 25 km from Pietermaritzburg, the provincial capital of KwaZulu-Natal (Figure 1).
Figure 1.
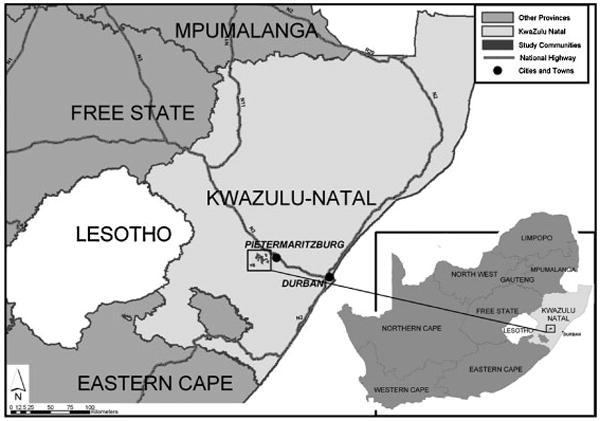
Study location map.
There are approximately 400,000 residents in Vulindlela and employment opportunities are provided mostly through forestry opportunities or in nearby towns. The adult male population tends to work in the urban areas and return to their families in their rural homesteads on weekends. The national, annual, anonymous HIV-1 surveys among first-time antenatal clinic attendees consistently reveal the explosive nature of the epidemic in this province, with little signs of abating (Frohlich, Makhaye, Abdool Karim, & Abdool Karim, 2004). Seroprevalence antenatal data collected from local family planning clinics in the Vulindlela district from 2001 to 2005 support this trend. These data reveal an alarming increase in HIV prevalence in women of childbearing age attending family clinics, with rates increasing from 32% in 2001 to 43% in 2004 (Kharsany et al., 2004).
Methods
The formative phase of the study covered a 2-year period and employed a combination of participatory methods and GIS. The objectives of this phase of the study were to: (1) identify community boundaries and relevant community matching criteria; (2) to understand how community members describe their communities both geographically and socially; (3) to identify appropriate sites for the delivery of the CBVCT part of the study; (4) to identify individuals, groups and community networks whom we could partner with in delivering this study and (5) to build rapport with communities.
Procedures
The procedures for the formative phase of the study were agreed in a multi-site study protocol, “The Community Ethnography and Participatory Mapping Protocol.” Although we describe the various phases of the research as four distinct phases, in practice events rarely occurred as neatly as the descriptions might imply. During implementation, some phases happened sequentially, whereas others tended to run concurrently. The procedures for the four phases of research are outlined in more detail below.
Phase 1: Desk Review of Existing Census Data and Community Maps
GIS-generated base maps of the Vulindlela area were developed with the assistance of a GIS consultant (shown in Figure 2). These initial maps were useful in visually planning for the study, defining the study areas and identifying possible study communities with a population size of approximately 10,000. Communities of this size were necessary for us to achieve sufficient statistical power to measure the intervention effect. Figure 2 illustrates that we started out investigating five pairs of potential study communities. Through the formative research process described here, we were able to select four pairs of communities that would be randomized into receiving the intervention or control condition.
Figure 2.
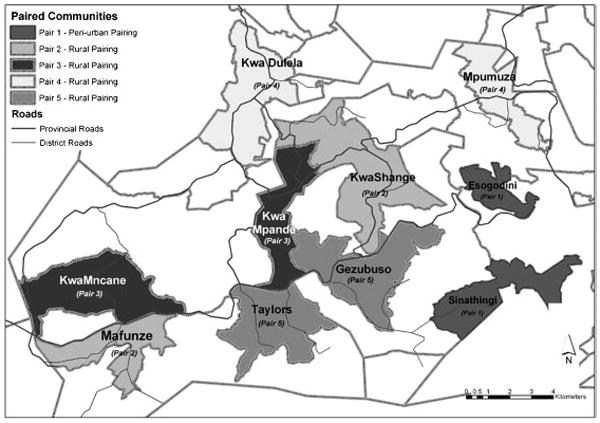
Proposed study communities version 3.
For the purposes of our study, communities were defined both geographically (i.e. approximate population size) and socially. Socially, communities were viewed as groups of adjacent people who also participate in common practices, depend on one another and identify themselves as part of something larger than the sum of their individual relationships (National Institute of Mental Health Proposal, 2001). The communities in Vulindlela consist of sub-places that are sub-divided into EA. The availability of the South African 2001 census data and the EA information from GIS-generated maps enabled us to extract possible demographic, social and geographic variables that we could use to match intervention and control communities. As communities and not individuals are the units of randomization in this study, this early stage of synthesis of community data and identification of possible matching variables, which potentially could influence our study outcome, were critical initial steps in the research process.
Phase 2: Gaining Community Entry and Conducting Community Visits
Community support and approval for the study was obtained through a series of meetings with traditional leadership, that is, the Amakhosi (chiefs) and Izinduna (chief’s headmen), political structures (ward councillors and the development committee) and other stakeholders in the Vulindlela area. Once endorsement for the study was obtained from all relevant authorities, several “drive throughs” of the community, mainly following the public commuter taxi route, were undertaken. The objectives of the community drives were to determine the feasibility of the desk-generated GIS exercise groupings of “communities” roughly of the size needed for the study. The community drives were also used to start the process of identifying community resources and infrastructure that would be useful to us in the delivery of the intervention, and to ensure that contamination between intervention and control communities could be avoided.
The GIS maps, together with a more practical understanding of the communities provided through the community tours, allowed us to identify relevant variables for community matching. These were examined in more detail through participatory mapping and transect walks.
Phase 3: Participatory Mapping and Transect Walks
The aim of the participatory mapping and transect walks was to provide a space for communities themselves, to describe and to define their communities. All staff were trained in the participatory methods used. The participants in the mapping exercises were recruited with the assistance of community key informants. Each participatory mapping team consisted of a facilitator, a note taker, a support team and community members. The facilitator invited community members to draw a map of their community as they saw it. Usually a volunteer from the group would take the initiative to draw the first structure with the backing of the rest of the group. Maps were created by community members, usually on the ground outdoors with the use of natural materials such as sticks, leaves and stones. Community halls and community members’ houses were used in rainy weather. The facilitator used a checklist (given in Table 1) to facilitate discussion about various community characteristics, resources, events and infrastructure that were being illustrated on the maps. Maps drawn by community members were then transferred to charts by community members for the study records.
Table 1.
A Checklist for Conducting Participatory Mapping and Transect Walks
Checklist for participatory mapping
|
Checklist for the transect walks
|
Transect walks—or guided community walks—were conducted immediately after the participatory mapping exercise. The purpose of the transect walks was to explore in more detail some of the issues that emerged in the participatory mapping process. On average three to five community members who participated in the mapping were invited to take part in the transect walk exercise. Members were selected because of their interest in participating, deeper knowledge and understanding of the communities and also because they were available. Owing the unfavorable weather conditions, the age of some participants and the size of the communities, the transect walks were undertaken both on foot and through community drives. During a transect walk, the community was divided into grids and the facilitator and community guides negotiated the grids either by foot or by car. During the process of transecting the community, the facilitator engaged the guides in discussion about what they were observing as well as clarified or confirmed issues that may have emerged in the mapping exercise. For example, we learnt through such discussions that traditional leadership boundaries of their communities were more complex than the boundary lines drawn by community members.
Phase 4: Identifying and Locating Fixed and Mobile Health Facilities
Using information obtained from the GIS and the participatory mapping process, public health facilities providing VCT in either fixed or mobile clinic services were visited and mapped using a GPS device. Community members helped confirm the locations of various mobile VCTsites before the staff members plotted the location data onto the GPS handsets. This process of adding a GIS analysis of access to fixed and mobile health facilities in each study community was important in helping us establish at baseline, the nature and extent of VCT services across all eight study communities, before we provided our intervention.
Ethical Considerations
Participation in the fieldwork was voluntary and no participants received any financial incentives for participation in the formative phase of the research. This study received ethical clearance from the Institutional Review Boards of the University of the Witwatersrand, South Africa, and University of California, Los Angeles.
DATA ANALYSIS
The research team compiled all the data obtained through the four preparatory stages of investigation into community profiles for each community. These detailed community profiles contained descriptive information on the historical background, health and social services available and information on the range and type of livelihood activities. The profiles also included information pertinent to the intervention, such as the details and location of various resources and groups that were providing VCT and psychosocial support services.
The GPS data were processed using Arc View (version 8.3) to produce visual charts. Buffer zones were created on the charts to illustrate the relative distance from community perimeters to each health service point and the extent of health service coverage in the communities.
RESULTS
The formative phase of the study was conducted to address pertinent issues relating to the research design for the intervention. We report on three primary findings that helped us do this, namely, identifying community boundaries and matching variables, community naming of their geographical and social environment and identifying community resources and partners for the intervention.
Identifying Community Boundaries and Matching Variables
Ensuring that pairs of communities could be matched on some key dimensions, and at the same time to ensure that they were sufficiently far apart and socially distinct to avoid contamination, was an important aspect of our study design. If not addressed appropriately, these could adversely impact the intervention effect. The communities within each pair were later randomized into either an intervention or control condition. A key issue we wanted to address through the participatory mapping and transect walks was that of verifying community boundaries and relevant community characteristics that could be used for matching.
Possible matching variables we wanted to verify included: types of communities (i.e. whether they were predominantly rural or peri-urban and their distance to and relationship with urban clusters), their “boundedness” or the degree to which communities were contained or distinct from each other and the general socioeconomic status of communities. Although census data, cartographic and GIS-generated maps revealed land coverage, topography and socioeconomic profiles of the communities to some extent, it was through community drives, community consultation, participatory mapping and transect walks that valuable information about these variables was obtained.
The participatory process was most revealing about the degree of “boundedness” of communities. Specific information of where community members access health services, where their children attend schools and other interrelationships between communities challenged our notions of the permeability of community boundaries. This local knowledge of factors likely to influence contamination between intervention and control communities significantly enhanced what we knew about potential study communities. In other instances, this information forced us to reconsider the particular clusters of sub-places, which we thought formed a possible study community.
Related to the issue of community containment was that of boundaries. The GIS mapping exercise resulted in what seemed, at times, to be neat, clear boundaries between communities. In reality this was not always the case. Government surveyors typically show boundary markers forming straight lines that do not mean anything to local people who use natural divides in demarcating their territories (Gonzalez, 2002). Information obtained through the participatory mapping and transect walks gave us a sense of the natural boundaries that existed, which could act as buffers between intervention and control communities. Our study showed key differences between the mental maps of communities and government surveyors of the same geographical spaces. Community perceptions of their environment provided us with invaluable information that assisted us in thinking more clearly about contamination effects as well as in planning the most appropriate places for providing the mobile VCT part of our intervention.
Community types and their related socioeconomic status were two additional variables on which we planned to match communities. Although the census data gave us some useful information about these two aspects, sufficient enough to render the next participatory step redundant, a different kind of knowledge about the lived experience of communities emerged through the participatory process. The staff, who participated in the community mapping and community walks, reported a deeper appreciation for the socioeconomic conditions that existed in these communities, and for the resourcefulness of the participants who are able to survive and thrive in spite of the prevailing conditions. Examples of these community conditions include the distances communities travel to get to schools, taxi ranks and other social services, rough dirt paths that turn to streams during the rainy season and dangerous walk through forests that increase the vulnerability of women and children who use them. Working with communities in research requires a simultaneous awareness and appreciation of their strengths and resourcefulness as well as the reality of their daily struggles. In our view, the census and cartographic review of these communities would not have taught us this valuable lesson, so early on in the study, or so powerfully. At the end of the exercise we were able to confirm community types and socioeconomic conditions as two further criteria to use for matching communities.
Community Naming of Social and Geographical Spaces
A significant finding that emerged was the fact that the official government census names for sub-places (the level at which we were working) did not correspond with local community names where the research was taking place. This created enormous confusion for the study staff armed with a list of place names that either did not exist according to the community or did exist but not in the location as indicated in the census. In addition to creating confusion, there was a perception that this “speaking different languages” could possibly undermine communities’ confidence in the research team and create some distance between the two groups. Armed with this local knowledge, we recorded all community names for various sub-places or EA and then used these to create a reference to Census 2001 place names from which we extracted EA demographic and social data. The acknowledgment of these differences between the official records and local community names was an important clarification that simplified matters from a logistical and planning perspective. More significantly, adoption of community names by the study team was important in building rapport and developing relationships of trust between community members and research staff. Table 2 is an example of the process of matching census sub-place names with local community known names.
Table 2.
Census Names and Numbers Matched With Local Community Names
| Census Name | EA Number | Name of Study Community | Local/Unique Community Name |
|---|---|---|---|
| Cedara | 50800021 | KwaDulela | Haza |
| 50800023 | KwaDulela | Haza | |
| 50800036 | KwaDulela | KwaChief | |
| Inhlazuko | 51100075 | KwaDulela | Mgwagwa |
| Mgwagwa | 51100083 | KwaDulela | Mgwagwa |
| Haza | 51100086 | KwaDulela | Mgwagwa |
| KwaMgwagwa | 51100092 | KwaDulela | Mgwagwa |
| KwaDulela | 51100111 | KwaDulela | KwaDulela |
| Ebaleni | 51100117 | KwaDulela | KwaDulela |
Note. EA, enumeration area.
Identifying Community Resources and Partners for the Intervention
At the start of the study, there were little recorded data about what HIV/AIDS, VCT and psychosocial support services and resources that existed in this particular area. The findings from our community ethnography and GIS process unearthed a range of services that we had not anticipated.
A number of secondary hospitals and primary health-care facilities exist in Vulindlela and the surrounding communities. Most of the secondary hospitals, although situated in the nearby city of Pietermaritzburg, are a useful referral source for the study participants. Studies are invariably limited, either through design or because of budgetary constraints, with respect to how much in the way of services they can provide the participants. By identifying and locating existing health services in Vulindlela, we were able to address important ethical considerations that researchers face when intervening in resource poor contexts: (1) we were reassured that communities in our study area had reasonably good access to health-care services and (2) by establishing linkages with services for referral, we could ensure that people got the services that they needed, but that we were unable to provide. We discovered untapped community health resources such as community-based organizations (CBOs), HIV/AIDS support groups, faith-based organizations (FBOs), women’s group, gardening groups and other community groups during this process. An inventory of all official and unofficial health and social resources now exists for all the study communities.
A key intervention question that needed to be answered was that of coverage of VCT services in the study communities. If none or very few existed, we would have to provide standard health service-based VCT (SVCT) as a comparison for CBVCT. The data that emerged through this formative phase showed that all study communities had reasonably good access to VCT through both district and municipal health services. Figure 2 shows that all people in all study communities are within a 5 km radius of either a fixed or a mobile clinic that provides VCT. The map also illustrates that secondary referral facilities, such as hospitals, are available within 25 km travel to all study communities (Figure 3).
Figure 3.
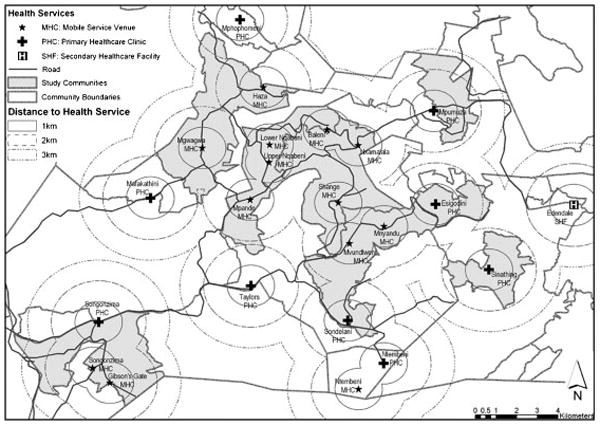
Vulindlela access to health services.
As we had established that our study communities had good access to VCT, we decided not to provide any SVCTourselves. Instead we work closely with personnel in these VCT sites to ensure that the highest quality VCT is provided to study communities. To this end we have trained more than 256 lay counsellors in the district and municipal services. In exchange, the provincial department of health has provided the study with rapid test kits for the intervention communities. The strategy to strengthen, through training and mentoring, current SVCT services also addressed questions of sustainability that most intervention trials inevitably face. Building the capacity of existing services to provide standard of care VCT goes a long way toward ensuring that critical services are continued to be provided to communities once the research is complete.
During participatory mapping exercises, participants voiced concerns with regard to distance and access to health facilities in the study communities. In addition, participatory mapping findings revealed a strong uptake of traditional healing irrespective of the established biomedical facilities. This was useful information for us as we needed to ensure that our services were accessible to people, and we liaised with traditional health practitioners to ensure that they were included as key referral partners in the study communities.
The third element of the CBVCT strategy is the provision of post-test support for individuals who have been tested for HIV. As with the VCT services, we found well-established networks of FBO, CBO and non-governmental (NGO) support services in Vulindlela. Through the formative research we were able to develop an inventory of existing services and to determine which of our study communities they serviced. Our approach in delivering post-test support services (PTSS) was to provide PTSS where none existed. Where services did exist, we use these as points of referral for services beyond those we provided, but which participants obviously needed. For example, although our PTSS focuses on building psychosocial support to improve the quality of life for individuals diagnosed with HIV, we recognized that many community members had a range of material and financial needs that we could not address. We could, however, address these needs through the partnerships we formed with other NGOs and CBOs whose core business is to provide material assistance to communities.
The capacity of GIS technology for spatial analysis was essential and helpful in thinking through other intervention issues. A key objective of our study is to increase access to HIV VCT in intervention communities through the provision of mobile VCT services that rotated through different venues in the community. We used the community ethnography procedures to explore potentially useful venues for the provision of VCT. Using GPS handsets we were able to map VCT caravan locations to ensure that VCT services would be accessible to communities. Mobile VCT service sites include informal stores, secondary schools, taxi ranks, taverns and other relevant strategically placed spaces in the communities.
DISCUSSION
Previous studies have demonstrated how existing data sources and GIS can be utilized in health analysis (Twigg, 1990). Other studies have also integrated GIS and social science methods in geographical and land studies (Kienberger et al., 2005; Mapedza et al., 2003). Those that have integrated GIS and social science methodologies in health-related studies in the African context have focused on tuberculosis and malaria (Tanser & Wilkinson, 1999). Our study used a number of methods similar to these studies, that is, using community members in the collection and synthesis of community maps. However, in our study, these methods were also combined with GIS mapping, participatory mapping and transect walks. The process enhanced community rapport building at the initial stages of the intervention trial when relation building and understanding between the researcher and the community are of utmost importance. This integration of social science methods with GIS represents a promising addition to the formative stages of HIV community-based studies.
Our experience during this formative phase illustrates that the combination of GIS and participatory techniques yielded rich and valuable community-level data that we would not have obtained had we used GIS-generated base maps alone. Trying to understand the social and geographical structure of communities primarily through the census data and existing cartographic maps may have “trapped us from the outset in ways of thinking, seeing and representing” (Abbot et al., 1998, p. 32) these communities, which may have been both limiting and disempowering.
Our finding that community members’ “cognitive maps” differed from those of government surveyors involved in census enumeration of the area supports our argument for a combination of participatory mapping and other scientific contemporary visualization technologies in understanding research community environments. Had we relied on only the visualization capacity of GIS, we would have missed how the political, social, cultural and economic values held by communities blend into an overall image about that space (Gould, 1973; Tversky, 1993), which is crucial in both our understanding of that environment and designing interventions for it (Downs & Stea, 1973; Orleans, 1973).
Previous studies in other settings have also shown that without a nationally up-to-date and accurate spatial infrastructure of health, social and community service providers, health sector planning and monitoring is limited in many ways (Noor et al., 2004). Similarly, researchers in intervention trials without up-to-date and comprehensive knowledge of the networks of services and relationships that exist in communities are unable to effectively plan a research undertaking. By using a combination of GIS and participatory methods, we were able to compile detailed data sets that form a good foundation for any future work in this area and would significantly reduce the preparatory work of new groups seeking to work here.
The incorporation of GIS with community ethnography in our study has helped overcome some of the limitations of using participatory approaches alone, including the lack of spatial accuracy and imprecision of scale references (Robiglio, Mala, & Diaw, 2003). The GIS techniques that have been employed in this study have opened up the possibility of spatial analysis in a field not fully explored before. Although our review of the literature shows that multidisciplinary approaches that involve participatory methodologies and GIS are not new, our study also demonstrates useful utilization of GIS in what may be termed as a non-mainstream GIS community of social science researchers. Abbot et al. (1998) who discuss the complementarities of GIS and participatory methods refer to the past resistance among the non-GIS community toward any forms of GIS. Our study shows that there is a place for softer sources of information, in this case community ethnography data, to be incorporated into a GIS framework when conducting community-based research.
Our experience with community ethnography and GIS technology has also demonstrated the value of using multi-method approaches as the limitations of each method are overcome by the other. However, we acknowledge that our integration of these methodologies has not been comprehensive enough as we have not been able to fully plot all qualitative data collected into the GIS-generated maps. One major weakness of such a multi-method approach as employed in this study is that the different methods that are employed may be extremely time and resource consuming and as a result can sometimes slow down swift information exchange (Vajjhala, 2005). Our experience of using GIS was that although it may have taxed resources and time, its value and usefulness to both our research design and in planning for the intervention far outweighed any of its limitations. In fact, we anticipate that GIS will form part of our ongoing activities as we attempt to fully understand the social and health profiles of study communities.
CONCLUSION
Researchers are faced with numerous conceptual and operational challenges in conducting community-based intervention trials in the developing world given the lack of adequate community-level demographic and socioeconomic-level data. The collection and synthesis of community-level data integrated with the spatial analysis tools of GIS technology resulted in well-defined and understood communities that were the units of investigation in this trial. In addition to building community rapport and aiding in understanding the lived experiences of communities, the community ethnography and GIS methods enabled the study team to address critical design questions relating to matching of community pairs and enabled us to effectively plan for the implementation of the intervention. We hope that the model of integrating community ethnography and GIS technology from this research trial could be utilized in other randomized community-based intervention trials.
Acknowledgments
The research was sponsored by the US National Institute of Mental Health as a cooperative agreement through contracts U01MH066687 and U01MH066688 (Johns Hopkins University), U01MH066701 (University of California) and U01MH066702 (University of California, San Francisco). In addition, this work was sponsored by the HIV Prevention Trials Network (HPTN Protocol 043) of the Division of AIDS of the US National Institute of Allergy and Infectious Diseases and by the Office of AIDS Research of the US National Institute of Health. Views expressed are those of the authors and not necessarily those of the sponsoring agencies. We thank the communities that partnered with us in conducting this research and all study participants for their contributions. We also thank the study staff and volunteers for their work and dedication.
Contributor Information
Admire Chirowodza, Human Sciences Research Council (HSRC) and University of KwaZulu-Natal.
Heidi van Rooyen, Human Sciences Research Council (HSRC).
Philip Joseph, Human Sciences Research Council (HSRC).
Sindisiwe Sikotoyi, Human Sciences Research Council (HSRC).
Linda Richter, Human Sciences Research Council (HSRC), and Universities of KwaZulu-Natal (UKZN) and the Witwatersrand.
Thomas Coates, University of California, Los Angeles.
References
- Abbot J, Chambers R, Dunn C, Harris T, de Merode E, Porter G, et al. Participatory GIS: Opportunity of oxymoron? PLA Notes. 1998;33:27–33. [Google Scholar]
- Appleyard D. Notes on urban perception and knowledge. In: Downs R, Stea D, editors. Image and environment. London: Edward Arnold; 1973. [Google Scholar]
- Brabyn L, Barnett R. Population needs and geographical access to general practitioners in rural New Zealand. New Zealand Medical Journal. 2004;117:156–167. [PubMed] [Google Scholar]
- Bullen N, Moon G, Jones K. Defining localities for health planning: A GIS approach. Social Science & Medicine. 1996;42:801–816. doi: 10.1016/0277-9536(95)00180-8. [DOI] [PubMed] [Google Scholar]
- Cinderby S. Geographic information systems (GIS) for participation: The future of environmental GIS? International Journal of Environment and Pollution. 1999;11:304–315. [Google Scholar]
- Downs R, Stea D. Cognitive maps and spatial behaviour: Process and products. In: Downs R, Stea D, editors. Image and environment. London: Edward Arnold; 1973. [Google Scholar]
- Dube C. Census geography of South Africa. 2005 Retrieved on 15 June 2006 from http://www.statssa.gov.za/africagis2005/presentations/OralColemanDube.pdf.
- Dunn C, Atkins P, Townsend J. GIS for development: A contradiction in terms? Area. 1997;29:151–159. [Google Scholar]
- Evans G, Marrero D, Butler P. Environmental learning and cognitive mapping. Environment and Behavior. 1981;13:83–104. [Google Scholar]
- Foley R. Assessing the applicability of GIS in a health and social care setting: Planning services for informal carers in East Sussex, England. Social Science & Medicine. 2002;55:79–96. doi: 10.1016/s0277-9536(01)00208-8. [DOI] [PubMed] [Google Scholar]
- Frohlich J, Makhaye G, Abdool Karim A, Abdool Karim Q. Temporal trends in HIV infection in rural South Africa: Implications for HIV prevention research. Paper presented at the XV international AIDS conference; Bangkok. 11–16 July 2004.2004. [Google Scholar]
- Gonzalez R. Joint learning with GIS: Multi-actor resource management. Agricultural Systems. 2002;73:99–111. [Google Scholar]
- Gould P. On mental maps. In: Downs R, Stea D, editors. Image and environment. London: Edward Arnold; 1973. [Google Scholar]
- Hightower A, Ombok M, Otieno R, Odhiambo R, Oloo A, Lal A, et al. A geographic information system applied to a malaria study in western Kenya. American Journal of Tropical Medicine and Hygiene. 1998;58:266–272. doi: 10.4269/ajtmh.1998.58.266. [DOI] [PubMed] [Google Scholar]
- Jemmot L, Brown E, Dodds S. Building community partnerships to improve HIV prevention efforts: Implications for nurses. Journal of the Association of Nurses in AIDS Care. 1998;9:29–40. doi: 10.1016/S1055-3290(98)80018-6. [DOI] [PubMed] [Google Scholar]
- Kelly K, van der Riet M. Participatory research in community settings: Processes, methods, challenges. In: Seedat M, Lazarus S, N Duncan, editors. Theory, method and practice in community psychology: South African and other perspectives. Cape Town: Oxford University Press; 2000. [Google Scholar]
- Kharsany A, Frohlich J, Mashego M, Makhaye G, Abdool Karim S, Abdool Karim Q. Epidemiology of STDs amongst rural women in Vulindlela, South Africa: Challenges for HIV prevention. Paper presented at the XV international AIDS conference; Bangkok. 11–16 July 2004.2004. [Google Scholar]
- Kienberger S, Steinbruch F, Blasckhke T, Luis da Costa A, Gomes A. The potential of community mapping and community integrated GIS: A study in the Sofala Province, Mozambique. In: Schrenk M, editor. Proceedings of the 10th international conference on information and communication technologies (ICT) in urban planning and spatial development and impacts of ICT on physical space; February 2005; Austria: Vienna University of Technology; 2005. Retrieved on 20 May 2006 from http://mmptk1.kosnet.com/corp/archiv/papers/2005/CORP2005_KIENBERGER_STEINBRUCH_BLASCHKE_DACOSTAGOMES.pdf. [Google Scholar]
- Killewo J, Dahlgren L, Sandstrom A. Socio-geographical patterns of HIV-1 transmission in Kagera region, Tanzania. Social Science & Medicine. 1994;38:129–134. doi: 10.1016/0277-9536(94)90307-7. [DOI] [PubMed] [Google Scholar]
- Klinkenberg E, van der Hoek W, Amarasinghe F. A malaria risk analysis in an irrigated area in Sri Lanka. Acta Tropica. 2004;89:215–225. doi: 10.1016/j.actatropica.2003.08.007. [DOI] [PubMed] [Google Scholar]
- Lesser J, Verdugo R, Konnik-Griffin D, Tello J, Kappos B, Cumberland W. Respecting and protecting our relationships: A community HIV prevention program for teen fathers and mothers. AIDS Education and Prevention. 2005;17:347–360. doi: 10.1521/aeap.2005.17.4.347. [DOI] [PubMed] [Google Scholar]
- Mapedza E, Wright J, Fawcett R. An investigation of land cover change in Mafungautsi Forest, Zimbabwe, using GIS and participatory mapping. Applied Geography. 2003;23:1–21. [Google Scholar]
- Martin C, Curtis B, Fraser C, Sharp B. The use of a GIS-based malaria information system for malaria research and control in South Africa. Health & Place. 2002;8:227–236. doi: 10.1016/s1353-8292(02)00008-4. [DOI] [PubMed] [Google Scholar]
- Mbile P, DeGrande A, Okon D. Integrating participatory resource mapping and geographical information systems in forest conservation and natural resource management in Cameroon: A methodological guide. The Electronical Journal on Information Systems in Developing Countries. 2003;14:1–11. [Google Scholar]
- Morin S, Maiorana A, Koester K, Sheon N, Richards T. Community consultation in HIV prevention research: A study of community advisory boards at 6 research sites. Journal of Acquired Immune Deficiency Syndromes. 2003;33:513–520. doi: 10.1097/00126334-200308010-00013. [DOI] [PubMed] [Google Scholar]
- Myrick R, Aoki B, Truax S, Lemelle A, Lemp G. Building partnerships: The use of community collaborative evaluation and research to build capacity for HIV/AIDS prevention. AIDS Education and Prevention. 2005;17:279–283. doi: 10.1521/aeap.2005.17.4.400. [DOI] [PubMed] [Google Scholar]
- National Institute of Mental Health Proposal. A Phase III randomised controlled trial of community mobilisation, mobile testing, same-day results, and post-test support for HIV in sub-Saharan Africa and Thailand. NIMH Project ACCEPT Study Team. 2001 doi: 10.1371/journal.pone.0149335. [DOI] [PMC free article] [PubMed] [Google Scholar]
- Noor A, Gikandi P, Hay S, Muga R, Snow R. Creating spatially defined databases for equitable health service planning in low-income countries: The example of Kenya. Acta Tropica. 2004;91:239–251. doi: 10.1016/j.actatropica.2004.05.003. [DOI] [PMC free article] [PubMed] [Google Scholar]
- Noor A, Zurovac D, Hay S, Ochola S, Snow R. Defining equity in physical access to clinical services using geographic information systems as part of malaria planning and monitoring in Kenya. Tropical Medicine and International Health. 2003;8:917–927. doi: 10.1046/j.1365-3156.2003.01112.x. [DOI] [PMC free article] [PubMed] [Google Scholar]
- O’Fallon L, Dearry A. Community-based participatory research as a tool to advance environmental health sciences. Environmental Health Perspectives. 2002;110:155–159. doi: 10.1289/ehp.02110s2155. [DOI] [PMC free article] [PubMed] [Google Scholar]
- Oppong J. Proceedings of a health and environmental workshop. Turku, Finland: 2000. Data problems in GIS and health. Retrieved on 9 June 2006 from http://scholar.google.com/scholar?q=GIS+and+HIV+AIDS&hl=en&lr=&start=10&sa=N. [Google Scholar]
- Orleans P. Differential cognition of urban residents: Effects of social mapping. In: Downs R, Stea D, editors. Image and environment. London: Edward Arnold; 1973. [Google Scholar]
- Robiglio V, Mala W, Diaw M. Mapping landscapes: Integrating GIS and social methods to model human–nature relationships in Southern Cameroon. Small-scale Forest Economics, Management and Policy. 2003;2:171–184. [Google Scholar]
- Smith K, Barret C, Box P. Participatory risk mapping for targeting research and assistance: With an example from East African pastoralist. World Development. 2000;28:1945–1959. [Google Scholar]
- Stea D, Blaut J. Toward a developmental theory of spatial learning. In: Downs R, Stea D, editors. Image and environment. London: Edward Arnold; 1973. [Google Scholar]
- Tanser F, Wilkinson D. Spatial implications of tuberculosis DOTS strategy in rural South Africa: A novel application of geographical information system and global positioning system technologies. Tropical Medicine and International Health. 1999;4:634–638. doi: 10.1046/j.1365-3156.1999.00469.x. [DOI] [PubMed] [Google Scholar]
- Tversky B. Cognitive maps, cognitive collages, and spatial mental models. In: Frank A, Campari I, editors. Spatial information theory: A theoretical basis for GIS, proceedings COSIT ’93. Lecture notes in computer science. Vol. 716. Berlin: Springer; 1993. pp. 14–24. Retrieved on 16 October 2007 from http://www.spatial.maine.edu/~cosit03/tversky-COSIT93.pdf. [Google Scholar]
- Twigg L. Health based geographical systems: Their potential examined in the light of existing data sources. Social Science & Medicine. 1990;30:143–155. doi: 10.1016/0277-9536(90)90337-r. [DOI] [PubMed] [Google Scholar]
- Ungar S. Cognitive mapping without visual experience. In: Kitchin R, Freundschuh S, editors. Cognitive mapping: Past, present and future. London: Routledge; 2000. [Google Scholar]
- Vajjhala S. Integrating GIS and participatory mapping in community development planning. Paper for the ESRI international user conference, sustainable development and humanitarian affairs track; San Diego, CA. July 2005.2005. [Google Scholar]
- Weir S, Morroni C, Coetzee N, Spencer J, Boerma J. A pilot study of a rapid assessment method to identify places for AIDS prevention in Cape Town, South Africa. Sexually Transmitted Infections. 2002;78:106–113. doi: 10.1136/sti.78.suppl_1.i106. [DOI] [PMC free article] [PubMed] [Google Scholar]
- Zenilman J, Glass G, Shields T, Jenkins P, Gaydos J, McKee K. Geographic epidemiology of gonorrhea and chlamydia on a large military installation: Application of a GIS system. Sexually Transmitted Infections. 2002;78:40–44. doi: 10.1136/sti.78.1.40. [DOI] [PMC free article] [PubMed] [Google Scholar]