

Sensitive methods to detect the specific binding of proteins to DNA are essential in monitoring pathways for gene expression and in the development of new diagnostics of disease states.1,2 There are several high-throughput, array-based methodologies currently available for monitoring transcription factor binding to DNA including immunoprecipitation of reversibly crosslinked chromatin/protein complexes,3 capture of fluorescent antibodies by epitope-tagged DNA-binding proteins,4 and amplification of sequences methylated by enzyme/DNA adenine-methyltransferase fusions.5 However, these methods rely on fluorescence detection and require DNA amplification and/or protein labeling.
Electrochemical assays based on DNA-mediated charge transport at microelectrodes offer an alternative approach.6 DNA electrochemistry has been useful in assays to detect mutations and lesions7–11 as well as for the detection of protein binding at self-assembled DNA monolayers.12–17 Moreover, DNA electrochemistry provides the opportunity for highly sensitive detection in a multiplexed format.6 However, there are few reports of the electrical detection of protein binding utilizing DNA monolayers at small scales.18 Using DNA-modified macroelectrodes, we have previously detected micromolar concentrations of TATA-binding protein (TBP),12 a ubiquitous transcription factor that severely bends the DNA duplex upon binding.19 Here, we describe the rapid and specific detection of nanomolar concentrations of TBP at microelectrodes modified with DNA containing a new, easily prepared redox probe.
The strategy utilized for detection is schematically illustrated in Figure 1. Two complementary 17-mer strands incorporating the 5′-TATAAAG-3′ TBP binding site were prepared. The 5′ end of one strand was modified with an alkane thiol, and the terminal T at the 5′ end of the complementary strand was modified with Nile Blue (NB), our redox-active probe.20,21 The thiol- and NB-modified strands were thermally annealed in equimolar amounts to form duplex DNA. Loosely packed DNA films were then self-assembled for 24–48 h on gold electrodes (Bioanalytical Systems) using procedures described.12,14 Binding of TBP to its target site, as found earlier,12 kinks the DNA duplex and perturbs the base pair stack, attenuating the DNA-mediated reduction of the redox probe (Figure 1).
Figure 1.
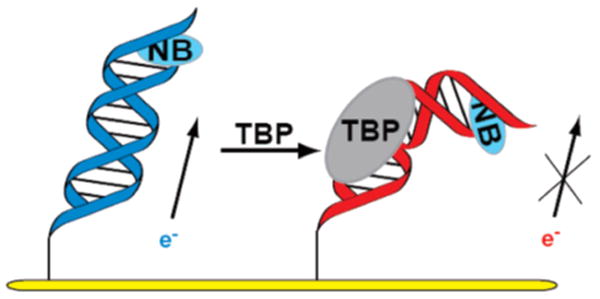
Schematic illustration of addition of TBP to a DNA monolayer modified with Nile Blue (NB), followed by DNA kinking and attenuation of DNA-mediated electrochemistry.
Cyclic voltammetry (CV) and square wave voltammetry (SWV) of both a macroelectrode and a microelectrode modified with NB–DNA duplexes are shown in Figure 2. The CV at the macroelectrode is reversible with a midpoint potential of −220 mV (±50) versus Ag/AgCl.22 For macroelectrodes, the cathodic and anodic waves are symmetric (though not overlapping), and a plot of peak current as a function of scan rate is linear as expected for a surface-bound species.23 For microelectrodes with critical dimensions ≤25 μm, the CV differs in shape and the midpoint potential appears to be systematically shifted by ∼100 mV.22–24 It is also notable that the background capacitance is significantly smaller at the microelectrode relative to the signal size.
Figure 2.
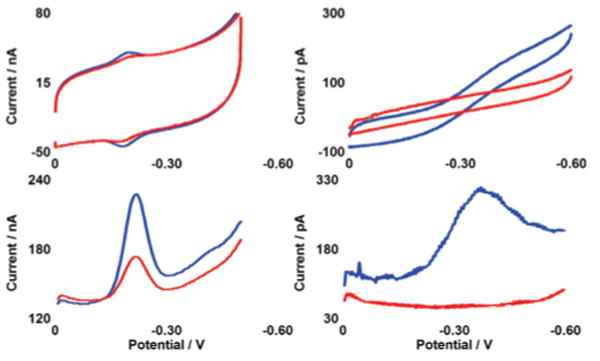
CV (top) and SWV (bottom) of NB–DNA at macroelectrodes of 2 mm diameter (left) and microelectrodes of 25 μm diameter (right). Voltammetry without TBP (blue) and with 300 nM TBP (red) is shown at pH 7 in a degassed phosphate buffer containing 5 mM NaPi, 50 mM NaCl, 4 mM MgCl2, 4 mM spermidine, 50 μM EDTA, 10% glycerol. After addition of protein, solutions were briefly stirred by a gentle argon purge. The sequence is thiol-5′-GAGATATAAAGCACGCA-3′ plus NB-modified complement. The potentials are reported versus Ag/AgCl with a CV scan rate of 50 mV/s and an SWV frequency of 15 Hz.
Upon addition of 300 nM TBP, reduction of DNA-bound NB is dramatically attenuated at both the macro- and microscales (Figure 2).25 For macroelectrodes, addition of the protein causes a signal loss of 60% with the signal slowly decreasing over a period of 15 min. For microelectrodes, 100% signal loss occurs in less than 30 s. The consistently greater signal loss and appreciably faster equilibration on the microelectrode may reflect better access of the protein to the NB-modified DNA on the smaller surface. It is also noteworthy that binding of TBP, in kinking the DNA,19 may bring NB in closer proximity to the surface, yet a decrease is observed in the NB signal. This observation is fully consistent not with contact of NB to the surface but instead a DNA-mediated reduction that is inhibited by bending the intervening DNA.
TBP binding and the resulting signal attenuation are fully reversible on a microelectrode (Supporting Information). A microelectrode incubated with TBP can be washed in 1 M KCl, promoting protein dissociation26 and rapid recovery of the NB signal. Electrodes can be taken through this cycle up to three times with no loss of response. In addition, detection of low concentrations of TBP is easily achieved (Supporting Information). At 30 and 15 nM protein concentrations, complete NB signal loss is observed. At 3 nM protein, the NB signal is partially attenuated, as expected based upon the affinity of the protein for its target sequence.27
The detection event is furthermore specific to TBP (Figure 3). Bovine serum albumin (BSA), a protein that does not bind DNA, has little effect on DNA-mediated electrochemistry or on signal attenuation associated with TBP binding.25,28 Micromolar Endonuclease III (EndoIII), a glycosylase that targets damaged pyrimidines (not unlike the NB-modified thymine), also has little effect on the DNA-mediated NB signal.25,29 Finally, the addition of BamHI methyltransferase (BAM), a base-flipping methylase that targets 5′-GGATCC-3′,24,30 yields little change in the voltammetry or the signal decrease associated with TBP binding. Although EndoIII and BAM likely bind nonspecifically to the DNA film at these concentrations, they do not inhibit specific binding by TBP. These results are therefore consistent with observing a sequence-specific TBP binding event.27
Figure 3.
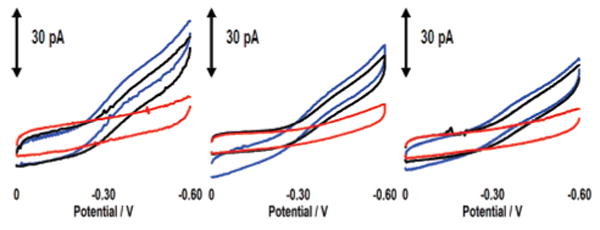
CV of three NB–DNA modified microelectrodes (10 μm) before and after addition of proteins. CVs before protein addition are in blue. From left to right, the black CVs represent addition of BSA (2 μM); BSA (1 μM) + EndoIII (1 μM); and BSA (1 μM) + BAM (1 μM). CVs in red reflect the subsequent addition of 30 nM TBP to each electrode. The data have been smoothed for clarity. The sequence is thiol-5′-GAGATATAAAGCACGCA-3′ plus NB-modified complement, and the potentials are reported versus Ag/AgCl with a CV scan rate of 50 mV/s.
We have thus demonstrated the electrochemical detection of nanomolar TBP binding to DNA in the presence of other proteins with a rapid and sensitive electrochemical assay. This methodology is based upon an interruption of DNA-mediated electrochemistry associated with protein binding and therefore may be generally applied in detecting other proteins that perturb the DNA base stack. Our ability to detect protein binding to DNA reliably at small scales provides a foundation for rapid, electrical assays of DNA-binding proteins on a single chip.
Supplementary Material
Acknowledgments
We are grateful to the NIH (GM61077) for their financial support.
Footnotes
Supporting Information Available: Synthesis and characterization of the Nile Blue/DNA conjugate. Details of the KCl wash showing reversible TBP binding. Voltammograms after addition of lower concentrations of TBP to DNA-modified microelectrodes. Voltammograms revealing the effect of oxygen and alternative gold surfaces. Details of protein preparation and quantification. This material is available free of charge via the Internet at http://pubs.acs.org.
References
- 1.Sikder D, Kodadek T. Curr Opin Chem Biol. 2005;9:38. doi: 10.1016/j.cbpa.2004.12.008. [DOI] [PubMed] [Google Scholar]
- 2.Bulyk ML. Curr Opin Biotechnol. 2006;17:422. doi: 10.1016/j.copbio.2006.06.015. [DOI] [PMC free article] [PubMed] [Google Scholar]
- 3.(a) Kim J, Iyer VR. Mol Cell Biol. 2004;24:8104. doi: 10.1128/MCB.24.18.8104-8112.2004. [DOI] [PMC free article] [PubMed] [Google Scholar]; (b) Lee TI, Johnstone SE, Young RA. Nat Protoc. 2006;1:729. doi: 10.1038/nprot.2006.98. [DOI] [PMC free article] [PubMed] [Google Scholar]
- 4.(a) Berger MF, Philippakis AA, Qureshi AM, He FS, Estop PW, III, Bulyk ML. Nat Biotechnol. 2006;24:1429. doi: 10.1038/nbt1246. [DOI] [PMC free article] [PubMed] [Google Scholar]; (b) Bulyk ML. Adv Biochem Engin/Biotechnol. 2007;104:65. doi: 10.1007/10_025. [DOI] [PMC free article] [PubMed] [Google Scholar]
- 5.(a) van Steensel B, Delrow J, Henikoff S. Nat Genet. 2001;27:304. doi: 10.1038/85871. [DOI] [PubMed] [Google Scholar]; (b) Vogel MJ, Peric-Hupkes D, van Steensel B. Nat Protoc. 2007;2:1467. doi: 10.1038/nprot.2007.148. [DOI] [PubMed] [Google Scholar]
- 6.Drummond TG, Hill MG, Barton JK. Nat Biotechnol. 2003;21:1192. doi: 10.1038/nbt873. [DOI] [PubMed] [Google Scholar]
- 7.(a) Boon EM, Ceres DM, Drummond TG, Hill MG, Barton JK. Nat Biotechnol. 2000;18:1096. doi: 10.1038/80301. [DOI] [PubMed] [Google Scholar]; (b) Kelley SO, Boon EM, Barton JK, Jackson NM, Hill MG. Nucleic Acids Res. 1999;27:4830. doi: 10.1093/nar/27.24.4830. [DOI] [PMC free article] [PubMed] [Google Scholar]; (c) Gorodetsky AA, Barton JK. Langmuir. 2006;22:7917. doi: 10.1021/la0611054. [DOI] [PubMed] [Google Scholar]; (d) Boal AK, Barton JK. Bioconjugate Chem. 2005;16:312. doi: 10.1021/bc0497362. [DOI] [PubMed] [Google Scholar]
- 8.Inouye M, Ikeda R, Takase M, Tsuri T, Chiba J. Proc Natl Acad Sci USA. 2005;102:11606. doi: 10.1073/pnas.0502078102. [DOI] [PMC free article] [PubMed] [Google Scholar]
- 9.Okamoto A, Kamei T, Saito I. J Am Chem Soc. 2006;128:658. doi: 10.1021/ja057040t. [DOI] [PubMed] [Google Scholar]
- 10.Li X, Song H, Nakatani K, Kraatz HB. Anal Chem. 2007;79:2552. doi: 10.1021/ac0615504. [DOI] [PubMed] [Google Scholar]
- 11.Wong ELS, Gooding JJ. J Am Chem Soc. 2007;129:8950. doi: 10.1021/ja0723075. [DOI] [PubMed] [Google Scholar]
- 12.Boon EM, Salas JE, Barton JK. Nat Biotechnol. 2002;20:282. doi: 10.1038/nbt0302-282. [DOI] [PubMed] [Google Scholar]
- 13.(a) Boon EM, Livingston AL, Chmiel NH, David SS, Barton JK. Proc Natl Acad Sci USA. 2003;100:12543. doi: 10.1073/pnas.2035257100. [DOI] [PMC free article] [PubMed] [Google Scholar]; (b) Boal AK, Yavin E, Lukianova OA, O'Shea VL, David SS, Barton JK. Biochemistry. 2005;44:8397. doi: 10.1021/bi047494n. [DOI] [PubMed] [Google Scholar]; (c) Gorodetsky AA, Boal AK, Barton JK. J Am Chem Soc. 2006;128:12082. doi: 10.1021/ja064784d. [DOI] [PubMed] [Google Scholar]
- 14.DeRosa MC, Sancar A, Barton JK. Proc Natl Acad Sci USA. 2005;102:10788. doi: 10.1073/pnas.0503527102. [DOI] [PMC free article] [PubMed] [Google Scholar]
- 15.Yeung SSW, Lee TMH, Hsing IM. J Am Chem Soc. 2006;128:13374. doi: 10.1021/ja065733j. [DOI] [PubMed] [Google Scholar]
- 16.Anne A, Bonnaudat C, Demaille C, Wang K. J Am Chem Soc. 2007;129:2734. doi: 10.1021/ja067954v. [DOI] [PubMed] [Google Scholar]
- 17.Li CZ, Long YT, Lee JS, Kraatz HB. Chem Commun. 2004;5:574. doi: 10.1039/b314642a. [DOI] [PubMed] [Google Scholar]
- 18.(a) Wang J, Rivas G, Jiang M, Zhang X. Langmuir. 1999;15:6541. [Google Scholar]; (b) Gore MR, Szalai VA, Ropp PA, Yang IV, Silverman JS, Thorp HH. Anal Chem. 2003;75:6586. doi: 10.1021/ac034918v. [DOI] [PubMed] [Google Scholar]; (c) Lapierre-Devlin MA, Asher CL, Taft BJ, Gasparac R, Roberts MA, Kelley SO. Nano Lett. 2005;5:1051. doi: 10.1021/nl050483a. [DOI] [PubMed] [Google Scholar]
- 19.(a) Kim Y, Geiger JH, Hahn SH, Sigler PB. Nature. 1993;365:512. doi: 10.1038/365512a0. [DOI] [PubMed] [Google Scholar]; (b) Kim JL, Nikolov DB, Burley SK. Nature. 1993;365:520. doi: 10.1038/365520a0. [DOI] [PubMed] [Google Scholar]; (c) Patikoglou GA, Kim JL, Sun L, Yang SH, Kodadek TK, Burley SK. Genes Dev. 1999;13:3217. doi: 10.1101/gad.13.24.3217. [DOI] [PMC free article] [PubMed] [Google Scholar]
- 20.DNA was synthesized using standard phosphoramidite chemistry and characterized by MALDI-TOF mass spectrometry, UV–visible spectroscopy, and HPLC. The 5′ C6 Thiol Modifier S-S and NHS-Carboxy-dT phosphoramidites were purchased from Glen Research. On solid support, NB was coupled to the 5-[3-acrylate NHS Ester]-deoxy uridine to form an amide bond. See Supporting Information for the NB coupling and characterization.
- 21.Significant hypochromicity of the NB chromophore is seen in the NB–DNA conjugate which likely indicates that NB is stacked in the duplex (Supporting Information). For further spectroscopic characterization of the interaction of free NB with DNA, see: Lakowicz JR, Piszczek G, Kang JS. Anal Biochem. 2001;288:62. doi: 10.1006/abio.2000.4860.Chen QY, Li DH, Yang HH, Zhu QZ, Xu JG, Zhao Y. Analyst. 1999;124:901. doi: 10.1039/a901174i.
- 22.We have found that the midpoint potential of NB–DNA monolayers on macroelectrodes vary depending upon the gold surface utilized, leading to an uncertainty of ∼50 mV in the potentials, although they have a higher certainty within a given surface. Moreover, there is a systematic negative shift in potential of ∼100 mV on the microelectrodes versus the macroelectrodes. Comparable shifts have been seen by others (see ref 18 b,c) and may reflect the different geometries of DNA monolayers on the different surfaces. See Supporting Information for further details.
- 23.Bard AJ, Faulkner LR. Electrochemical Methods. 2nd. John Wiley & Sons; New York: 2001. [Google Scholar]
- 24.At small scales, we observe a partially sigmoidal shape for the voltammetry of Nile Blue–DNA films. We attribute the sigmoidal shape to a small catalytic contribution to the NB signal from trace oxygen, as reported in Ju H, Shen C. Electroanalysis. 2001;13:789.. See Supporting Information.
- 25.See Supporting Information for details of protein preparation.
- 26.(a) Daugherty MA, Brenowitz M, Fried MG. J Mol Biol. 1999;285:1389. doi: 10.1006/jmbi.1998.2427. [DOI] [PubMed] [Google Scholar]; (b) Khrapunov S, Brenowitz M. Biochemistry. 2007;46:4876. doi: 10.1021/bi061651w. [DOI] [PMC free article] [PubMed] [Google Scholar]
- 27.At low TBP concentrations, where TBP binds site specifically, we observe little attenuation on electrodes modified with NB–DNA lacking the binding site. For binding affinities, see: Coleman RA, Taggart AKP, Benjamin LR, Pugh BF. J Biol Chem. 1995;270:13842. doi: 10.1074/jbc.270.23.13842.Gilfillan S, Stelzer G, Piaia E, Hofmann MG, Meisterernst M. J Biol Chem. 2005;280:6222. doi: 10.1074/jbc.M406343200.
- 28.BSA is known to adsorb nonspecifically on self-assembled alkanethiol monolayers. For example, see: Holmlin RE, Chen X, Chapman RG, Takayama S, Whitesides GM. Langmuir. 2001;17:2841. doi: 10.1021/la0015258.. Here we utilize BSA effectively to passivate the Au surface against further nonspecific adsorption.
- 29.(a) Asahara H, Wistort PM, Bank JF, Bakerian RH, Cunningham RP. Biochemistry. 1989;28:4444. doi: 10.1021/bi00436a048. [DOI] [PubMed] [Google Scholar]; (b) Cunningham RP, Asahara H, Bank JF, Scholes CP, Salerno JC, Surerus K, Munck E, McCracken J, Peisach J, Emptage MH. Biochemistry. 1989;28:4450. doi: 10.1021/bi00436a049. [DOI] [PubMed] [Google Scholar]; (c) David SS, Williams SD. Chem Rev. 1998;98:1221. doi: 10.1021/cr980321h. [DOI] [PubMed] [Google Scholar]
- 30.Lindstrom WM, Jr, Malygin EG, Ovechkina LG, Zinoviev VV, Reich NO. J Mol Biol. 2003;325:711. doi: 10.1016/s0022-2836(02)01282-2. [DOI] [PubMed] [Google Scholar]
Associated Data
This section collects any data citations, data availability statements, or supplementary materials included in this article.