Abstract
Metastatic tumors lead to more than 90% fatality. Despite the importance of invasiveness of tumors to poor disease outcome, no anti-invasive compounds have been commercialized. We describe herein the synthesis and evaluation of 4-(4-(thiiranylmethylsulfonyl)phenoxy)-phenyl methane-sulfonate (compound 2) as a potent and selective inhibitor of gelatinases (matrix metalloproteinases-2 and -9), two enzymes implicated in invasiveness of tumors. It was demonstrated that compound 2 significantly attenuated the invasiveness of human fibrosarcoma cells (HT1080). The metabolism of compound 2 involved hydroxylation at the a-methylene, which generates sulfinic acid, thiirane ring-opening, followed by methylation and oxidation, and cysteine conjugation of both the thiirane and phenyl rings.
Keywords: anti-tumor activity, gelatinase inhibitor, metabolism
Cancer is a collection of over 100 devastating diseases that share a number of characteristics, a primary hallmark of which is out-of-control growth. However, in reality both from genotypic and phenotypic considerations, there are significant differences among these diseases, a fact that underlies the difficulties in the past few decades in their chemotherapeutic intervention. Whereas we aspire to learn the biochemical events that lead to the cancerous outcome in each case, understanding of certain shared biochemical attributes for these diseases are emerging only recently.
Regardless of what set of biochemical events leads to a given type of cancer, the primary tumors need not be fatal and often they are managed by surgery, chemotherapy or irradiation. However, when the tumor cells spread to other organs, a process known as metastasis, the prognosis is very poor. A characteristic of malignant tumors is the ability of a small subpopulation of tumor cells to escape from the primary tumor. These cells are released into circulation in a complex process involving a series of steps that degrade the extracellular matrix (ECM), including detachment from the tumor mass, degradation of basement membrane, cell migration and invasion of adjacent capillaries (a process known as intravazation) that leads to entry into circulation (1). A small number of cells that survive the voyage through the circulatory system arrive at new organ sites, where they attach to the endothelium. Adhesion to and recognition of those sites in the endothelium by tumor cells is followed by the process of extravazation, involving again degradation of ECM, migration and tumor growth, resulting in the formation of a new tumor colony. Thus, the process of tumor invasiveness and formation of metastasis is a multistep sequence of events, all of which must take place successfully for the disease to progress (1). When metastasis occurs, the prospects for survival of patients become considerably worse, resulting in approximately 90% mortality (2). Despite the gravity of the consequence of metastasis, to date no anti-invasive/antimetastic agent has been commercialized for fighting aggressive cancers.
A family of 23 known human zinc-dependent endopeptidases, referred to as matrix metalloproteinases (MMPs), has been known to play critical roles in remodeling the ECM in normal physiological conditions, which occur throughout life. These functions range from events at the embryonic stages to tissue morphogenesis to wound healing. More recent findings indicate functions for MMPs in cell survival, angiogenesis and signaling. The functions of MMPs are highly regulated at multiple levels to ensure proper function (3-7).
However, when the MMP-regulatory processes go awry, a number of pathological events ensue, including cancer growth and tumor metastasis, among others (8-11). Two of these enzymes, MMP-2 and -9, also known as gelatinases A and B, respectively, have been implicated in a number of cancers (12), making them important targets for intervention. The difficulty is selective targeting of gelatinases among the 23 MMPs. We have addressed this issue by the development of a thiirane-based mechanism-based inhibitor (1) that affords selectivity in inhibition for gelatinases, with especially potent inhibition of MMP-2 (Ki = 13.9 nm) (13). Unfortunately, the compound is rapidly metabolized (14), which lead to low systemic concentrations in mice (15).
A primary pathway of the metabolism of 1 is via P450-mediated hydroxylation at the p-position of the terminal phenyl ring (14) to generate an active metabolite. While the p-hydroxy metabolite was generated in in vitro systems, it was not found in systemic circulation in mice. Thus, it became apparent that the pharmacokinetic properties needed to be improved through blocking metabolism at the terminal phenyl ring. A series of computational analyses with the X-ray structures of gelatinases argued that functionalization of this terminal ring could be tolerated without compromising the activity in inhibition of gelatinases. We describe herein the culmination of the computational exercise that led to the design, synthesis and evaluation of compound 2. This compound affords potent and selective inhibition of both gelatinases, it has 75-fold higher metabolic stability, it shows appreciable levels in mouse plasma, and it exhibits anti-invasive activity with human fibrosarcoma tumor cells (HT1080). The metabolism of compound 2 was investigated; seven metabolites were identified and their structures elucidated.
Methods and Materials
Chemicals and reagents
All organic reagents were purchased from either Sigma-Aldrich Chemical Company (St Louis, MO, USA) or Acros Organics (Geel, Belgium), unless otherwise stated. All reactions were performed under an atmosphere of nitrogen, unless otherwise noted. 1H and 13C NMR spectra were recorded on a Varian INOVA-500 spectrometer (Varian Inc., Palo Alto, CA, USA). Chemical shifts are reported in p.p.m. using tetramethylsilane as an internal standard on the δ scale. Thin-layer chromatography was performed with Whatman reagents 0.25 mm silica gel 60-F plates. Flash chromatography was carried out with silica gel 60, 230–400 mesh (0.040–0.063 mm particle size) purchased from EM Science (Gibbstown, NJ, USA). Human recombinant active MMP-7 and catalytic domains of MMP-3 and MMP-14 were purchased from EMD Biosciences (La Jolla, CA, USA). Catalytic domain of human recombinant MMP-1 was from Biomol International (Plymouth Meeting, PA, USA). Fluorogenic substrates were purchased from Peptides International (Louisville, KY, USA), (MOCAcPLGL(Dpa)AR-NH2, MOCAcRPKPVE(l-norvalyl)WRK(2,4-dinitrophenyl)-NH2), and (MOCAcKPLGL(Dpa)AR-NH2) from R&D Systems (Minneapolis, MN, USA). Substrate hydrolysis was measured with a Varian Cary Eclipse fluorescence spectrophotometer. The methodology for enzyme inhibition studies were the same as reported previously (16). Cell invasion assay was performed as described previously (16). Rat liver microsomes were purchased from BD Biosciences (Woburn, MA, USA). Human fibrosarcoma HT-1080 were purchased from the American Tissue Culture Collection (ATCC (Manassas, VA, USA)).
Computational methods
A molecular library of compounds for binding to the human MMP-9 (Protein Data Bank ID: 1L6J) (17) was constructed based on the structural template of compound 1. The terminal phenyl ring was targeted for generation of variants of 1, of which a focused library of 452 analogs was prepared. Analogs of 1 were designed based on the energy-minimized structure of the complex or R-enantionmer bound to the active site of the enzyme. Each derivative was assigned with Gasteiger–Hückel charges and its energy was minimized. The energy minimization starts with the Nelder–Mead simplex method, followed by 100-step Powell's conjugate gradient algorithm. The Tripos Mol2 files generated in sybyl 7.3a were transformed to Maestro files of schrödinger 7.5 (18), with each compound then they were docked to MMP-9 as the receptor.
The crystal structure of MMP-9 includes the propeptide domain (residues 29–109), the catalytic domain (residues 110–211) and the fibronectin domain (residues 212–444). These domains superimposed nicely on the corresponding domains of the closely related MMP-2. The propeptide domain was removed electronically to generate the structure of the active form of MMP-9. After protonation of the N-terminus and deprotonation of the C-terminus, the charges of the functionalities on the protein were determined as described above for the small molecular library. The complexes were generated using dock 5 (19) with a selection of static sets based on previous studies of 1 (20). The static sets include an anchor formed by the sulfone sulfur, the α and β carbons to the sulfone, and a solid bond between the sulfone sulfur and the aromatic ring carbon to which the sulfone is attached. This predocked complex was used for receptor-grid generation. The grid generation was iterated in the docking and the final grid volume corresponding to the active site of the protein was 30 × 28 × 28 Å3.
Standard precision docking was applied with flexibility of ring flips and amide bond twist in the small-molecule ligand. The van der Waals (vdW) radius was scaled by 0.8 for those ligand atoms with partial charge of less than 0.15. Four constraints were considered in docking, including two positional constraints of the thiirane sulfur and the sulfone sulfur, one hydrogen bond constraint between the Leu188 amide and the sulfone oxygen, and one hydrophobic constraint that centered at the middle aryl ring. The glide score (GScore) function was used, which is a linear combination of interaction potentials:
where vdW is the van der Waals energy, Coul is the Coloumb energy, Lipo is the lipophilic contact energy, Hbond is the hydrogen-bonding energy, Metal is the metal-binding energy, Site is the polar interactions at the active site and two penalty energy terms. The two penalties are for buried polar groups (BuryP) and for freezing rotatable bonds (RotB). The scaling coefficients a and b were 0.080 and 0.100, respectively.
Metabolic stability
Compounds 1 and 2 (25 μM) were mixed with nicotinamide adenine dinucleotide phosphate reduced (NADPH) (0.5 mm) in potassium phosphate buffer (50 mm, pH 7.4) in a total volume of 0.2 mL and preincubated at 37 °C. The reaction was started by adding pooled male Sprague–Dawley liver microsomes (0.2 mg protein). After 15-min incubation, the reaction was quenched with 0.2 mL acetonitrile containing internal standard and centrifuged to remove protein. A second incubation was terminated at time 0. An aliquot of the supernatant was analyzed by reversed-phase high-performance liquid chromatography (HPLC) with ultraviolet (UV) detection at 245 nm. The peak area ratio relative to internal standard was measured and compared relative to that at time 0 and reported as percent remaining.
Microsomal incubations
Incubations consisted of rat liver microsomes (0.5 mg), NADPH (0.5 mm) and 50 μM compound 2 in potassium phosphate buffer (50 mm, pH 7.4) at 37 °C for 30 min in a volume of 500 μL. The reaction was terminated by addition of one volume of acetonitrile. The precipitated protein was centrifuged (10 min, 15,300 g) and the supernatant was analyzed by reversed-phase HPLC with UV detection and LC/MS. Incubations were also carried out as described above in the presence of reduced glutathione (5 mm)at37 °C for 60 min.
Animals
Specific pathogen-free, 8-week-old female BALB/c mice were purchased from Harlan Inc (Indianapolis, IN, USA). Animals were provided with ad libitum access to Laboratory 5001 Rodent Diet (PMI, Richmond, IN, USA) and tap water via water bottles. Animals were maintained in polycarbonate shoebox cages with hardwood bedding, in a room under a 12:12 h light:dark cycle and at 72 ± 2 °F. All animal studies were approved by the University of Notre Dame Institutional Animal Care and Use Committee.
Animal dosing and sample collection
Compound 2 was dissolved in 25% dimethylsulfoxide (DMSO)/10% H2O/65% polyethylene glycol (PEG)-200 to a final concentration of 40 mg/mL. The solution was sterilized by passage through an Acrodisc syringe filter, 0.2 μm, 13 mm diameter sterile hydrophobic PTFE membrane (VWR, West Chester, PA, USA). Three female BALB/c mice each received a single 50 μL dose of this solution intraperitoneally (equivalent to 100 mg/kg). Terminal blood samples were collected by cardiac puncture from the mice, following induction of isoflurane anesthesia, using ethylenediaminetetraacetic acid as anticoagulant at 1 h after dosing. Blood was stored on ice and centrifuged to obtain plasma. In addition, three female BALB/c mice were each given 50 μL of a 20 mg/mL solution intraperitoneally (equivalent to 50 mg/kg/day) and a second 50 μL dose was given 24 h later. Plasma was collected 1 h after the last dose.
Analysis of plasma
A 50-μL aliquot of plasma was mixed with 100 μL of internal standard in acetonitrile, and the sample was centrifuged at 15,300 g for 5 min. A 50-μL aliquot of the supernatant was analyzed by reversed phase HPLC with UV detection at 245 nm. The chromatographic conditions consisted of isocratic elution on an YMC 5 lm basic 4.6 mm i.d. × 15 cm column at 60% acetonitrile/40% water containing 0.1% trifluoroacetic acid (TFA) at a flow of 1.0 mL/min. A standard curve of compound 2 in blank mouse plasma was prepared by fortification of 50 μL of plasma with compound 2 at concentrations of 0, 1, 2.5, 5, 10, 25, 50, 100 and 250 μM. Quantification of compound 2 in plasma was determined using peak area ratios relative to the internal standard and linear regression parameters calculated from the calibration curve standards prepared in blank mouse plasma. The assay was linear from 1 to 250 μM compound 2, with a coefficient of determination, R2, of 0.999.
For metabolite identification, an aliquot of plasma was quenched with an equivalent volume of acetonitrile to precipitate protein and centrifuged for 10 min at 15,300 g. The supernatant was analyzed by HPLC and LC/MS.
HPLC chromatography
The HPLC system consisted of a Perkin-Elmer series 200 quaternary pump (Perkin-Elmer Corp, Norwalk, CT, USA), a Perkin-Elmer UV detector series 200 and a Perkin-Elmer auto sampler series 200. Samples were analyzed on a YMC 5 μm basic 4.6 mm i.d. × 15 cm column (YMC Inc, Wilmington, NC, USA) connected to a YMC 5 μm basic 4.0 mm i.d. × 2 cm guard cartridge. The mobile phase consisted of elution at 1 mL/min with 90% A/10% B for 5 min, followed by a 20-min linear gradient to 10% A/90% B, then 10% A/90% B for 10 min (A = 0.1% TFA/water, B = 0.1% TFA/acetonitrile). Effluent was monitored by UV detection at 245 nm.
Mass spectrometry
All mass spectrometric experiments were performed with a Micro-mass (Beverly, MA, USA) Quattro-LC triple quadrupole (Q1-q-Q3) instrument running masslynx 4.0 software (Micromass, Beverly, MA, USA). The Quattro-LC was connected to a Waters (Milford, MA, USA) 2690 HPLC equipped with a Waters 2690 autosampler and a Waters 996 photodiode array detector. For LC/MS and LC/MS/MS experiments, the eluent flow rate of 1 mL/min was reduced by 50% prior to entering the ion source region with a custom-built flow splitter which consisted of a zero dead volume PEEK tee with identical lengths and diameters of tubing on each outlet. The Quattro-LC Z-spray interface was operated in the electrospray ionization mode with the following parameters: capillary voltage = 2.8–3.0 kV, cone voltage = 20–35 V, source temperature = 125–150 °C, desolvation temperature = 150–250 °C, desolvation gas (N2) flow rate = 430–550 L/h.
For MS/MS experiments, the mass spectrometer tune was optimized by directly infusing a solution of compound 2. Collisionally activated dissociation was employed for all MS/MS experiments by admitting argon gas into the collision cell (q). For product ion scans, argon gas was admitted into q until the parent signal intensity was reduced by ∼50% (i.e. single collision conditions), then collision energy (voltage offset between Q1 and Q3) was increased to 10–50 V. The resolving powers of both Q1 and Q3 were reduced from a setting of 15 to 12 to maximize signal intensities, and MS/MS spectra were acquired in the continuum mode of data acquisition at a rate of ≥400 atomic mass units (a.m.u.)/second. For precursor ion scans and constant neutral loss scans, the mass spectrometer tune procedure was the same as above except that the argon gas pressure in the collision cell was optimized to give maximum intensity for the specific transition being monitored.
Toxicity study in mice
The effects of compound 2 were evaluated after repeated dose administration at doses of 5, 10 and 25 mg/kg/day given to female BALB/c mice (n = 5 per group) once a day intraperitoneally (50 μL of a solution of compound 2 in 25% DMSO/65% PEG-200/10% water at concentrations of 2, 4 and 10 mg/mL, respectively) for 14 days. Animals were observed daily and body weights were measured before and after administration of compound 2. Terminal blood was collected at 1, 2, 4, 8 and 24 h after the last dose, centrifuged to obtain plasma, and levels of compound 2 were determined using peak area ratios relative to the internal standard and linear regression parameters calculated from the calibration curve standards prepared in blank mouse plasma.
Invasion assays
Cell culture
Human fibrosarcoma HT-1080 were cultured in Dulbecco's modified Eagle medium supplemented with 10% fetal bovine serum (FBS) and antibiotics.
In vitro invasion assay
Tumor cell invasion was carried out in Costar® Transwell filters (6.5 mm in diameter with an 8-μm pore) coated with 25–50 mg/filter Matrigel (BD Biosciences). HT1080 cells, suspended in serum-free medium containing 0.1% protease-free bovine serum albumin (Sigma) and increasing inhibitor concentrations (0.1–10 μM) or <0.5% DMSO (vehicle) were seeded at 1 × 10⁴ cells/well in triplicate wells. Medium supplemented with 5% FBS was used as a chemo-attractant in the lower chamber. After 18-h incubation, the non-invading cells were wiped off from the upper side of the filters. The invading cells were fixed and stained with Diff-Quik® (Dade Behring Inc, Newark, DE, USA), mounted and five representative fields of the filter were photographed using a Zeiss Axioplan 2 (Carl Zeiss AG, Jena, Germany) microscope equipped with the axiovision software (Carl Zeiss AG, Jena, Germany), and counted.
Cytotoxicity
The effect of compound 2 on cell viability was tested with HT1080 cells using 2-(4-iodophenyl)-3-(4-nitrophenyl)-5-(2,4-disulfophenyl)-2H-tetrazolium, mono-sodium salt (WST-1, Roche) as previously described (16). No effect was observed at the concentration range of 0–10 mm.
Synthesis of compound 2
Benzyl 2-(4-bromophenoxy)phenol (4)
The procedure was adapted from that reported by Ma and Cai. (21) A mixture of 1,4-dibromobenzene (2.45 g, 10.4 mmol), 4-benzyloxyphenol (3.12 g, 15.6 mmol), Cs2CO3 (6.80 g, 20.9 mmol), N,N-dimethylglycine hydrochloride salt (0.44 g, 3.15 mmol), CuI (0.20 g, 1.05 mmol) in degassed 1,4-dioxane (20 mL) was heated at 90 °C for 22 h under nitrogen atmosphere. After dilution with water, the mixture was extracted with ethyl acetate. The combined organic layer was washed with water and brine, dried over anhydrous MgSO4 and concentrated under reduced pressure. The resultant residue was purified by column chromatography (ethyl acetate/hexanes = 1/15) to give compound 4 as a white solid (2.81 g, 76%). 1H NMR (500 MHz, CDCl3) δ 5.07 (s, 2H), 6.85 (d, J = 9.0 Hz, 2H), 6.97–7.00 (m, 4H), 7.34–7.50 (m, 7H); 13C NMR (126 MHz, CDCl3) δ 70.7 (CH2), 115.0 (C), 116.2 (CH), 119.5(CH), 121.0(CH), 127.7(CH), 128.2(CH), 128.8(CH), 132.7(CH), 137.1 (C), 150.0 (C), 155.5 (C), 157.9 (C); HRMS (FAB) calcd for C19H15BrO2 (M+) 354.0255, found 354.0250.
[4-(4-Benzyloxyphenoxy)phenylsulfanyl]-methyloxirane (5)
n-BuLi (10.7 mL, 2.5 M in hexane) was added to a solution of compound 4 (9.52 g, 26.8 mmol) in anhydrous THF (120 mL) with vigorous stirring at −78 °C. After stirring for 30 min, sulfur (0.86 g, 26.8 mmol) was added to the reaction mixture. The mixture was stirred for 0.5 h, while temperature was raised to 0 °C. After recooled to −78 °C, epichlorohydrin (2.2 mL, 28.1 mmol) was added dropwise to the reaction mixture. Stirring was continued for 1 h, while temperature was raised to −20 °C. The reaction was quenched by the addition of a saturated solution of ammonium chloride. The mixture was extracted with EtOAc and the organic layer was washed with water, dried (MgSO4) and filtered. The solvent was evaporated under reduced pressure and the residue was purified by column chromatography (ethyl acetate/hexanes = 1/10 to 1/3) to afford 6.98 g (65%) of 1-chloro-3-[4-(4-benzyloxyphenoxy)phenylsulfanyl]propan-2-ol as a colorless oil. 1H NMR (500 MHz, CDCl3) δ 3.00 (dd, J = 13.8, 7.2 Hz, 1H), 3.09 (dd, J = 14.1, 5.5 Hz, 1H), 3.67 (ddd, J = 17.6, 11.0, 4.5 Hz, 2H), 5.06 (s, 2H), 6.90 (d, J = 8.6 Hz, 2H), 6.98 (s, 4H), 7.34–7.47 (m, 7H); 13C NMR (126 MHz, CDCl3) δ 39.9 (CH2), 48.1 (CH2), 69.6(CH), 70.7 (CH2), 116.2 (CH), 118.4 (CH), 121.2 (CH), 127.2 (CH), 127.6 (C), 128.2 (CH), 128.8 (CH), 133.4 (CH), 137.1 (C), 149.9 (C), 155.5 (C), 158.5(C H); 70.7 (CH2), 115.0 (C), 116.2 (CH); HRMS (FAB) calcd for C22H22ClO3S (M + H+) 401.0978, found 401.0980.
Potassium carbonate (2.81 g, 20.4 mmol) was added to a solution of 1-chloro-3-[4-(4-benzyloxyphenoxy)phenylsulfanyl]propan-2-ol, prepared above (4.09 g, 10.2 mmol) in a 1:2 mixture of methanol and acetonitrile (100 mL) in an ice-water bath with vigorous stirring. After 10 min, ice-water bath was removed and stirring was continued for 1 h at room temperature, followed by the filtration of the mixture through a small layer of silica gel. The filtrate was concentrated under reduced pressure and the residue was purified by column chromatography (ethyl acetate/hexanes = 1/4) to afford the title compound (3.16 g, 85%) as a colorless oil. 1H NMR (500 MHz, CDCl3) δ 2.49 (dd, J = 4.8, 2.8 Hz, 1H), 2.79 (t, J = 4.5 Hz, 1H), 2.88 (dd, J = 13.8, 5.9 Hz, 1H), 3.10 (dd, J = 13.8, 4.8 Hz, 1H), 3.15–3.21 (m, 1H), 5.08 (s, 2H), 6.92 (d, J = 8.6 Hz, 4H), 7.00 (s, 2H), 7.34–7.49 (m, 8H); 13C NMR (126 MHz, CDCl3) δ 38.2 (CH2), 47.5, 51.2 (CH2), 70.6 (CH2), 116.1, 118.2, 121.1, 127.6, 127.7, 128.1, 128.7, 133.8, 137.0, 149.9, 158.3; 70.7 (CH2), 115.0 (C), 116.2 (CH); HRMS (FAB) calcd for C22H20O3S (M+) 364.1133, found 364.1104.
[4-(4-Benzyloxyphenoxy)phenylsulfonyl]-methyloxirane (6)
To a solution of compound 5 (2.82 g, 7.74 mmol) in dichloromethane (20 mL) was added a solution of m-chloroperoxybenzoic acid (3.47 g, 15.5 mmol, 77%) in an ice-water bath. After 10 min, the suspension was filtered and the filtrate was diluted with EtOAc and washed with 10% aqueous sodium thiosulfate, followed by washes with saturated sodium bicarbonate and brine. The organic layer was dried over magnesium sulfate and was concentrated. The product was purified by silica gel chromatography (ethyl acetate/hexanes = 1/3 to 1/2) to yield the title compound as an oil (2.33 g, 76%). 1H NMR (500 MHz, CDCl3) δ 2.48 (dd, J = 5.0, 1.9 Hz, 1H), 2.82 (dd, J = 6.2, 2.8 Hz, 1H), 3.22–3.37 (m, 3H), 5.09 (s, 2H), 7.02–7.09 (m, 4H), 7.33–7.38 (m, 1H), 7.40–7.43 (m, 9H), 7.45–7.47 (m, 9H), 7.87 (d, J = 9.0 Hz, 2H); 13C NMR (126 MHz, CDCl3) δ 46.0, 59.8, 70.6, 116.4, 117.1, 122.0, 127.6, 128.3, 128.8, 130.6, 132.1, 136.8, 148.2, 156.4, 163.8; HRMS (FAB) calcd for C22H21O5S (M + H+) 397.1110, found 397.1112.
2-(4-Oxiranylmethanesulfonylphenoxy)-phenol (7)
Compound 6 (1.0 g, 2.6 mmol) was stirred in the presence of Pd(OH)2 (0.30 g) in ethylacetate/i-PrOH (40 mL) for 0.5 h under an atmosphere of hydrogen. The reaction mixture was filtered through a layer of celite and the filtrate was concentrated under reduced pressure. The residue was purified by column chromatography (ethyl acetate/hexanes = 1/2 to 1/1) to give the desired product (0.56 g, 70%). 1H NMR (500 MHz, CDCl3) δ 2.47 (dd, J = 5.5, 1.4 Hz, 1H), 2.81 (dd, J = 4.5, 2.4 Hz, 1H), 3.23–3.35 (m, 3H), 6.86 (d, J = 9.0 Hz, 2H), 6.92 (d, J = 9.0 Hz, 2H), 7.02 (d, J = 9.0 Hz, 2H), 7.82 (d, J = 9.0 Hz, 2H); 13C NMR (126 MHz, CDCl3) δ 46.0, 59.8, 116.8, 117.0, 122.1, 130.6, 131.6, 147.3, 154.2, 163.6; HRMS (FAB) calcd for C15H15O5S (M + H+) 307.0640, found 307.0621.
4-(4-(Thiiranylmethylsulfonyl)phenoxy)-phenyl methanesulfonate (2)
Thiourea (0.26 g, 3.4 mmol) was added to a solution of compound 7 (0.53 g, 1.7 mmol) in methanol (10 mL). The reaction mixture was stirred at room temperature overnight. The solvent was removed under reduced pressure. The residue was partitioned between ethyl ether and water, the organic layer was washed with water and brine, dried (MgSO4) and the suspension was filtered. Evaporation of solvent gave the crude product, which was purified by column chromatography (ethyl acetate/hexanes = 1/2 to 2/3) to give 2-(4-thiiranylmethanesulfonylphenoxy)phenol (8, 0.47 g, 84%). 1H NMR (500 MHz, CDCl3) δ 2.17 (dd, J = 5.2, 1.7 Hz, 1H), 2.55 (dd, J = 6.2, 1.7 Hz, 1H), 3.02–3.11 (m, 1H), 3.20 (dd, J = 14.5, 7.9 Hz, 1H), 3.54 (dd, J = 14.5, 5.9 Hz, 1H), 6.90 (d, J = 8.6 Hz, 2H), 6.97 (d, J = 9.0 Hz, 2H), 7.06 (d, J = 9.0 Hz, 2H), 7.88 (d, J = 9.0 Hz, 2H); 13C NMR (126 MHz, CDCl3) δ 24.4, 26.2, 62.8, 117.0, 117.2, 122.2, 130.8, 131.2, 147.9, 153.5, 164.0; HRMS (FAB) calcd for C15H14O4S2 (M+) 322.0334, found 322.0321.
Methanesulfonyl chloride (100 μL, 1.4 mmol) was added to a solution of the thiirane 8 (0.40 g, 1.2 mmol) and triethylamine (350 μL, 2.5 mmol) in methylene chloride (4 mL) in an ice-water bath. The reaction mixture was stirred for 1 h and was washed with water. The organic layer was dried and concentrated to afford the crude product, which was purified by column chromatography (0.42 g, 84%). 1H NMR (500 MHz, CDCl3) δ 2.13 (dd, J = 5.2, 1.7 Hz, 1H), 2.51 (d, J = 6.2 Hz, 1H), 3.03 (m, 1H), 3.18 (s, 3H), 3.22 (dd, J = 14.1, 7.6 Hz, 1H), 3.47 (dd, J = 14.3, 6.0 Hz, 1H), 7.10 (dd, J = 9.0, 2.8 Hz, 4H), 7.32 (d, J = 9.3 Hz, 2H), 7.87 (d, J = 9.0 Hz, 2H); 13C NMR (126 MHz, CDCl3) δ 24.2, 26.1, 37.5, 62.5, 118.2, 121.6, 124.0, 130.9, 132.6, 145.6, 153.8, 162.1; HRMS (FAB) calcd for C16H16O6S3 (M+) 400.0109, found 400.0111.
Crystals' growth and analysis
Compound 2 (100 mg) in CH2Cl2 (1 mL) was heated to produce a clear, colorless solution. Crystals of suitable size for single-crystal X-ray diffraction analysis were obtained by diffusion of hexanes into the CH2Cl2 solution at room temperature overnight. Crystals were examined under a light hydrocarbon oil. The datum crystal was cut from a larger needle. It was then affixed to a 0.2-mm Mitegen loop mounted on top of a tapered copper mounting-pin and transferred to the 100 K nitrogen stream of a Bruker SMART Apex diffractometer (Bruker AXS Inc., Madison, WI, USA) equipped with an Oxford Cryosystems 700 (Oxford Cryosystems Ltd., Oxford, United Kingdom) series low-temperature apparatus. Cell parameters were determined using reflections harvested from three orthogonal sets of 30 0.5° φ scans. The orientation matrix derived from this was passed to cosmob to determine the optimum data collection strategy. Minimum fourfold redundancy was achieved using a combination of ω and φ scan series. Data were measured to 0.81 Å. Cell parameters were refined using reflections with I ≥ 10σ(I) harvested from the entire data collection. All data were corrected for Lorentz and polarization effects and runs were scaled using SADABSc. The structures were solved using direct methods. All non-hydrogen atoms were assigned after the initial solution. Hydrogens were placed at calculated geometries and allowed to ride on the position of the parent atom. Hydrogen thermal parameters were set to 1.2× the equivalent isotropic U of the parent atom, 1.5× for methyl hydrogens. Non-hydrogen atoms were refined with parameters for anisotropic thermal motion. Crystallographic data (excluding structure factors) for compound 2 have been deposited with the Cambridge Crystallographic Data Centre as supplementary publication number 705144. Copies of the data can be obtained, free of charge, on application to CCDC, 12 Union Road, Cambridge CB2 1EZ, UK (e-mail: deposit@ccdc.cam.ac.uk).
Results and Discussion
The search for variants of 1 with improved metabolic stability started with the structure of inhibitor 1 as a template. Based on the aforementioned analysis of 1 bound to the active site of gelatinases, there appeared to be opportunity for structure elaboration on the terminal aromatic ring of 1, which incidentally is the site of major metabolic processing (14). We generated an electronic focused library of 452 such variants, members of which were individually allowed to dock into the active site of MMP-9, and each complex was scored for the goodness of fit.
The docking results showed that the position of the sulfone sulfur atom was critical to ranking the derivatives. After iterating the positional constraint, the best binding for the parental structure 1 ranked it as 113th in the 452-member compound library. We scrutinized the top 50 ranking compounds further. The analysis attempted to identify interactions that have been deemed to be critical. For example, co-ordination of the thiirane sulfur to the active site zinc ion was one. Subsequent analysis dealt with the identification of the recurrence of certain binding modes and structural motifs in the library, and practicality for preparation of the target compound based on synthetic considerations. Of the recurrent structural motifs, a striking observation was that sulfonate substituents at the terminal ring were largely favored. Of the top 50 ranking compounds, 13 were incorporated with sulfonate functionalities, with several represented in the top 20. Compound 2 was singled out for synthesis and study, as described below.
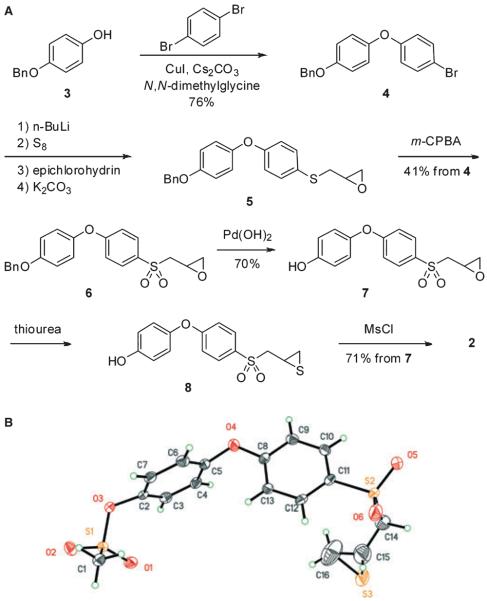
The synthesis of compound 2 is outlined in Figure 1A. The p-hydroxyphenoxybenzene scaffold was assembled by copper catalyzed Ullmann condensation (21) between 4-benzyloxyphenol (3) and 1,4-dibromobenzene. The transformations of compound 4 including lithiation, subsequent alkylation with epichlorohydrin, epoxide formation (5), oxidation to sulfone (6) and the conversion of the oxirane to the thiirane using thiourea, were performed by the methodology developed by our group earlier (22,23). The difficult step turned out to be the selective deprotection of the benzyl ether group of compound 6. Under the standard catalytic hydrogenation conditions that we routinely use (10% Pd/C, MeOH), we detected the formation of the desired product, as well as the secondary alcohol resulting from the reduction of the oxirane ring within 0.5 h of the reaction time. After many trials with different catalysts and solvents, we opted for Pd(OH)2 in ethyl acetate and i-PrOH to generate compound 7 cleanly. The transformation of oxirane 7 to thiirane 8, followed by mesylation proceeded smoothly to yield the targeted compound 2. The structure of compound 2 was confirmed by X-ray crystallography (Figure 1B).
Figure 1.
(A) Synthetic scheme for the preparation of compound 2. (B) The ORTEP (Oak Ridge Thermal Ellipsoid Plot) diagram of the X-ray structure of compound 2, shown at 50% probability level.
We investigated the kinetic behavior of compound 2 with MMPs. Compound 2 behaved as a slow-binding inhibitor only for gelatinases, a characteristic that has been seen for the selectivity profile of the thiirane class of inhibitors for gelatinases (13,16). We evaluated the rate constants for the rapid onset of inhibition (kon) and slow recovery from the inhibited complex (koff) (Table 1). The dissociation constant (Ki) was evaluated from the ratio of koff/kon to be in the low nanomolar range for the gelatinases. The remaining representative MMPs (MMP-1, -3, -7 and -14), which did not exhibit the slow-binding profile for inhibition, each were inhibited less effectively by a linear competitive mechanism. An interesting aspect of these results is that whereas compound 2 inhibits both gelatinases in the nanomolar range for the dissociation constants, it exhibits more potency toward inhibition of MMP-9 (Ki = 5 nm). This is an unusual feature when inhibition of gelatinases is concerned and this is the first thiirane inhibitor that exhibits this pattern.
Table 1.
Kinetic parameters for inhibition of MMPs by inhibitor 2
| 10−4 kon (per m per second) |
103 koff (per second) |
Ki (nm) | |
|---|---|---|---|
| MMP-2 | 4.5 ± 0.4 | 1.0 ± 0.2 | 23 ± 5 |
| MMP-9 | 2.1 ± 0.2 | 0.11 ± 0.10 | 5 ± 1 |
| MMP-14cat | 145 ± 10 | ||
| MMP-3cat | 600 ± 30 | ||
| MMP-7 | 18200 ± 3000 | ||
| MMP-1cat | 140000 ± 7000 |
MMP, matrix metalloproteinase.
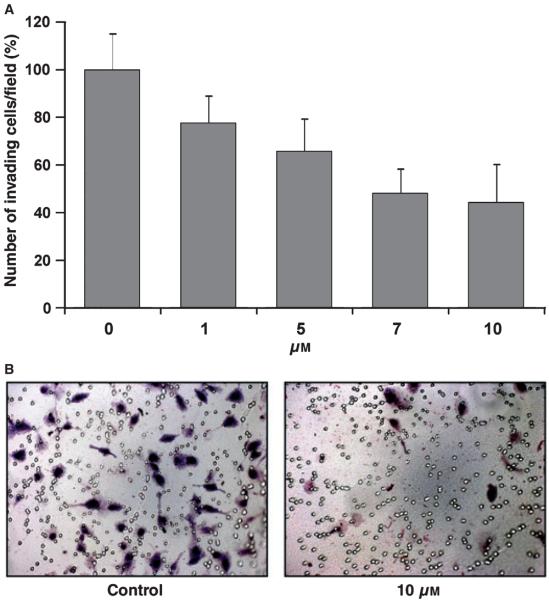
A hallmark of metastatic cells is their ability to invade and degrade extracellular matrices. This phenotype has been correlated to an increase in gelatinase activity. Thus, we examined the effect of compound 2 on the ability of human HT1080 cells to invade Matrigelcoated filters. Matrigel is a reconstituted basement membrane extract composed mainly of type IV collagen and laminin and is widely used to assess the in vitro invasiveness of tumor cells. HT1080 cells express both gelatinases at readily detectable levels. As shown in Figure 2A,B, compound 2 inhibited the HT1080 cell invasion in a dose-dependent manner. This effect is likely because of gelatinase inhibition by compound 2, given the known important role they play in migration and invasion of HT1080 cells. Moreover, compound 2 did not exhibit cytotoxic effects at the concentrations used, as determined by the WST-1 assay. Together, these results demonstrate that compound 2 is an effective inhibitor of tumor cell invasion.
Figure 2.
(A) Human fibrosarcoma cells (HT1080) suspended in serum-free Dulbecco's modified Eagle's medium containing 0.1% bovine serum albumin were seeded (1 × 10⁴ cells/well) on 8 μm pore Transwell filters coated with Matrigel (50 mg/well) in the absence or presence of increasing concentrations of inhibitor 2 (0–10 μM). The lower well was filled with medium containing 5% fetal bovine serum, as a chemo-attractant. After 18 h incubation, the cells that migrated to the underside of the filters were fixed, stained and photographed. Five different fields were counted and the average number of migrating cells/filter was calculated. Each value represents the mean ± standard deviation of triplicate wells. (B) Representative fields of invading cells in the absence of and in the presence of 10 μM of compound 2.
To contemplate progress of this inhibitor into in vivo use, we investigated its metabolic stability and biotransformation. The metabolic stability of compounds 1 and 2 was determined by measuring attrition or loss of compound relative to the internal standard following 15-min incubation with rat liver microsomes. Only 0.5% of compound 1 remained under these conditions, consistent with rapid and extensive metabolism. In contrast, compound 2 was 75-fold more stable. A primary route of metabolism of compound 1 is p-hydroxylation of the terminal phenyl ring (14). This position is blocked in compound 2, thus resulting in increased metabolic stability.
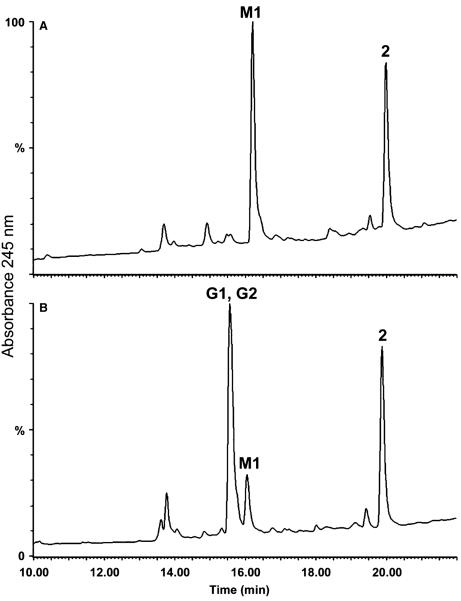
The metabolism of compound 2 was investigated in rat liver microsomes; one major metabolite (M1), as well as 2 itself were observed (Figure 3A).
Figure 3.
HPLC chromatogram of compound 2 following (A) incubation with rat liver microsomes and (B) incubation with rat liver microsomes in the presence of reduced glutathione. HPLC conditions: YMC 5 μm basic 4.6 mm i.d. × 15 cm column, 1 mL/min, UV detection at 245 nm, 5-min 90% A/10% B, 20-min linear gradient to 10% A/90% B, 5-min 10% A/90% B (A = 0.1% TFA/water, B = 0.1% TFA/acetonitrile).
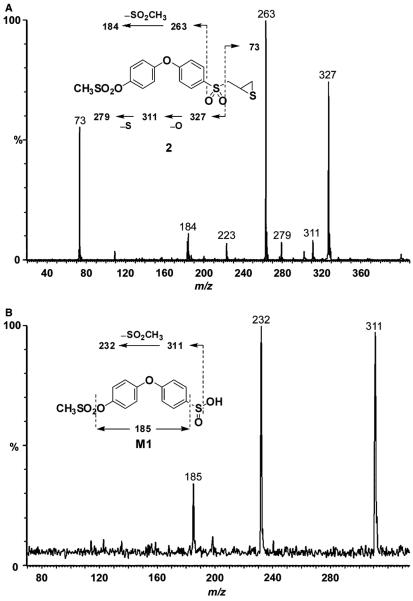
Mass spectrometry of compound 2 showed a protonated molecular ion at m/z 401 (Figure 4A). Cleavage of the sulfonyl–methylene linkage gave ions at m/z 327 and 73. Subsequent loss of oxygen resulted in an ion at m/z 311, followed by loss of sulfur at m/z 279 and subsequent loss of oxygen at m/z 263.
Figure 4.
Product ion mass spectra of (A) compound 2 (m/z 401) and (B) M1 (m/z 329).
The major metabolite (M1) showed a protonated molecular ion at m/z 329, 72 a.m.u. lower than that of compound 2, indicating the loss of the methylthiirane side chain. The product ion mass spectrum of M1 showed loss of water at m/z 311, subsequent loss of CH3SO2 at m/z 232 and further loss of SO at m/z 185 (Figure 4B).
These data indicated that the phenoxyphenyl moiety was intact, consistent with M1 as the sulfinic acid whose structure is given as the inset of Figure 4B. The corresponding sulfinic acid metabolite was also identified in rat liver microsomal incubations of compound 1 (14).
Compound 2 was administered intraperitoneally to female BALB/c mice, following a single dose at 100 mg/kg. Levels of compound 2 in plasma at 1 h after dosing were 70.5 μM, 3000-to 15 000-fold higher than Ki for gelatinases. In contrast, plasma levels of compound 1 in mice were <1 μM at 1 h after a single intraperitoneal dose at the same dose level (15). Thus, systemic exposure of compound 2 is significantly higher than that of compound 1.
The effects of repeated doses of compound 2 in mice were investigated. Compound 2 was administered intraperitoneally to female BALB/c mice once a day for 14 days at doses of 5, 10 and 25 mg/kg/day. Terminal blood samples were collected at 1, 2, 4, 8 and 24 h after the last dose and levels of compound 2 in plasma were measured. Concentrations of 2 were 3.2 μM at 1 h in mice given 25 mg/kg/day and below the limit of quantification (1 μM) at later time-points and in mice given 5 and 10 mg/kg/day. Although, systemic exposure to compound 2 after repeated doses was lower than following single dose administration, it was 140- to 640-fold higher than Ki for gelatinases. The decreased levels of compound 2 following multiple-dose administration indicated possible P450 induction. No toxicity was observed in mice upon multiple-dose administration of compound 2 (Table 2), as evidenced by normal behavior and food consumption.
Table 2.
Summary of 14-day mouse toxicity study with compound 2
| Dosea (mg/kg/day) |
No. of mice |
Predose body weight (g) |
Body weight Day 14 (g) |
Concentration of 2 at 1 hb |
Observations |
|---|---|---|---|---|---|
| 5 | 5 | 18.4 ± 0.6 | 18.7 ± 0.6 | LOQ | Clinically normal |
| 10 | 5 | 18.9 ± 0.7 | 19.4 ± 0.4 | LOQ | Clinically normal |
| 25 | 5 | 18.9 ± 0.3 | 19.3 ± 0.4 | 3.2 μM | Clinically normal |
| Vehicle | 3 | 18.4 ± 0.1 | 18.9 ± 0.3 | LOQ | Clinically normal |
LOQ = below limit of quantification.
Female BALB/c mice were given a solution of inhibitor 2 in 25% DMSO/10% water/65% PEG-200 at concentrations of 2, 4 and 10 mg/mL, corresponding to 5, 10 and 25 mg/kg, respectively. Doses (50 μL) were administered intraperitoneally once a day for 14 days. Control mice were given vehicle (50 μL of 25% DMSO/65% PEG-200/10% water) intraperitoneally once a day for 14 days.
Concentration of compound 2 in plasma at 1 h after the last dose.
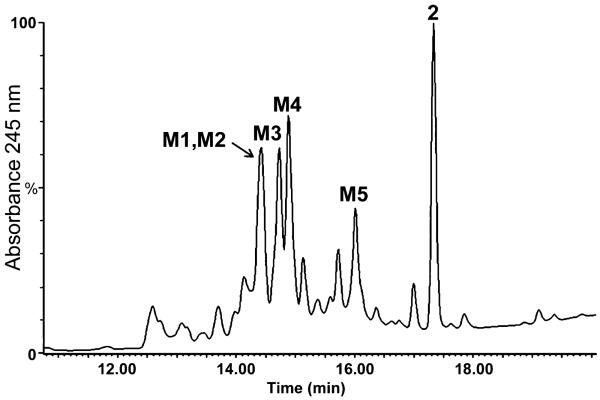
The plasma profile following administration of compound 2 to mice is shown in Figure 5. Several metabolites were seen, but compound 2 itself was observed as a major component in plasma. The metabolites were identified using precursor ion scan experiments by searching for predefined m/z product ion based on knowledge of the fragmentation pattern of compound 2 and associating it back to the precursor ion that originated it. Subsequently, product ion experiments were conducted to obtain detailed fragmentation pattern and assign the structures of the metabolites. The presence of glucuronides was scanned by neutral loss of 176, corresponding to glucuronic acid; the presence of N-acetylcysteine adducts was ascertained by precursor ion experiments of m/z 162.
Figure 5.
HPLC chromatogram of mouse plasma at 1 h following a single intraperitoneal dose of compound 2 at 100 mg/kg. HPLC conditions: YMC 5 μm 4.6 mm i.d. × 15 cm column, 1 mL/min, UV detection at 245 nm, 5-min 90% A/10% B, 15-min linear gradient to 10% A/90% B, 5-min 10% A/90% B (A = 0.1% TFA/water, B = 0.1% TFA/acetonitrile).
One of the major metabolites in plasma was the aforementioned M1, the sulfinic acid, which was the major metabolite in in vitro experiments. The product ion spectrum of M1 from plasma was identical as M1 from microsomes.
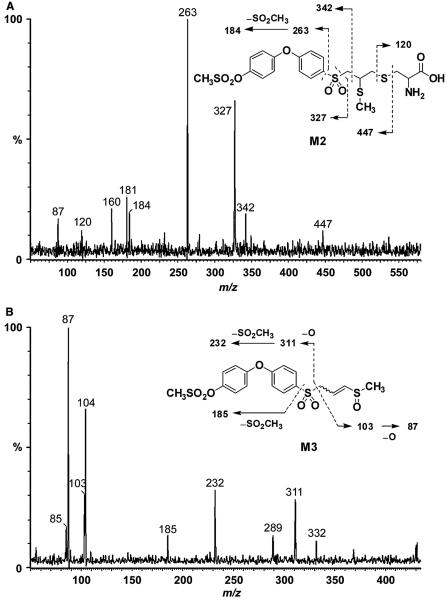
M2 showed a protonated molecular ion at m/z 536, 135 a.m.u. higher than parent drug. Fragments at m/z 327, 263 and 184 indicated that the diphenyl ether and sulfonyl moiety were intact (Figure 6A). The ion at m/z 120 was characteristic of a cysteine conjugate. This left 15 a.m.u. unaccounted for, indicating the presence of a methyl group. Cleavage of the cysteine linkage gave an ion at m/z 447. These data indicated M2 as the S-methyl cysteine conjugate. The corresponding metabolite was also identified in mouse plasma following treatment with compound 1 (15).
Figure 6.
Product ion mass spectra of (A) M2 (m/z 536) and (B) M3 (m/z 431).
M3 showed a protonated molecular ion at m/z 431, 30 a.m.u. higher than parent compound 2, suggesting the addition of an oxygen and a methyl group. Cleavage of the sulfonyl–methylthiirane linkage and subsequent loss of oxygen gave a fragment at m/z 311, indicating that the terminal and middle phenyl rings were intact (Figure 6B). A fragment corresponding to the methylthiirane at m/z 73 increased by 30 a.m.u. to 103, followed by the subsequent loss of oxygen to m/z 87 were consistent with ring-opening of the thiirane ring to a thiol, its subsequent methylation and oxidation of the resultant sulfide to a sulfoxide (see the structure in the inset of Figure 6B). This metabolic pathway was also observed in mice following administration of compound 1 (15).
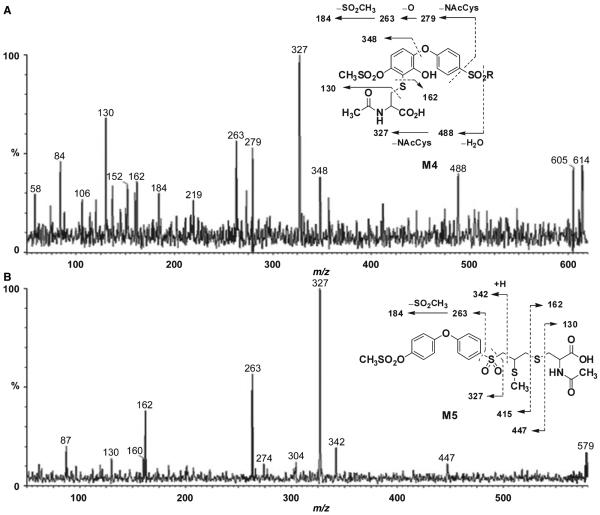
M4 showed an ion at m/z 614. Fragments at m/z 130 and 162 were characteristic of an N-acetyl cysteine conjugate (Figure 7A). Loss of water gave an ion at m/z 488, indicating that the N-acetylcysteine group and an additional oxygen were located in one of the phenyl rings. Cleavage of the terminal phenyl ether linkage generated an ion at m/z 348, which established the position of both the N-acetylcysteine and the hydroxyl group at the terminal phenyl ring. The inset to Figure 7B gives the likely structure for M4. As the methylsulfonyloxy moiety is at the para position, the oxidative incorporation of the cysteine group by glutathione addition to the ring would take place on either side of the symmetric phenyl ring. The mass spectrometric data cannot establish whether the cysteine moiety is linked ortho to the ether oxygen or to the methylsulfonyloxy moiety. The corresponding metabolite upon administration of compound 1 to mice was not observed.
Figure 7.
Product ion mass spectra of (A) M4 (m/z 614) and (B) M5 (m/z 578).
The protonated molecular ion for M5 was at m/z 578, 177 a.m.u. higher than compound 2. This indicated the presence of an odd number of nitrogens in the structure of M5. Ions at m/z 130 and 162 were diagnostic of N-acetylcysteine (Figure 7B). That leaves 15 a.m.u. to account for, which suggested the presence of a methyl group. Cleavage of the sulfonyl linkage gave ions at m/z 263 and 327, which indicated that the terminal and middle phenyl rings were intact. Cleavage of the N-acetylcysteine linkage gave ions at m/z 415 and 447. These data identified M5 as the S-methyl-N-acetylcysteine conjugate (inset of Figure 7B). The corresponding metabolite was also observed in plasma upon treatment of mice with compound 1 (15).
The presence of cysteine conjugates in plasma of mice treated with compound 2 is indicative of the fact that these metabolites were generated via the addition of glutathione and its processing. Compound 1, which lacks the methylsulfonyloxy moiety of the terminal phenyl ring, had been shown to form a glutathione adduct on the thiirane portion of the molecule (15). To trap the glutathione adducts, we investigated the in vitro metabolism of 2 in liver microsomes in the presence of excess reduced glutathione (Figure 3B). Three major UV absorbing peaks were seen. Analyses of these revealed them to be due to metabolites G1, G2 and M1, and compound 2 itself, with metabolites G1 and G2 co-eluting. M1 is the aforementioned sulfinic acid metabolite.
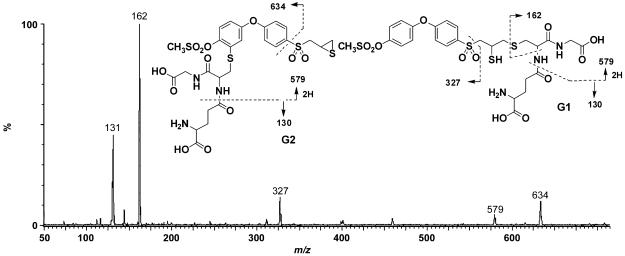
As indicated above, G1 and G2 co-eluted as one peak. A protonated molecular ion for G1 and G2 was observed at m/z 708, 307 a.m.u. higher than compound 2, consistent with the addition of one glutathione moiety. The product ion spectrum of G1 and G2 showed a fragment at m/z 162, which is characteristic of a glutathione moiety (Figure 8). The fragment at m/z 327 indicated that the biphenyl ether was intact in this molecule and suggested glutathione addition to the thiirane ring. However, the fragment at m/z 634 was consistent with the addition of glutathione to one of the phenyl rings. This would arise through epoxidation on the terminal phenyl ring, glutathione conjugation to the epoxide, followed by the loss of water. Due to steric considerations, glutathione most likely adds to the 3-position on the terminal phenyl ring.
Figure 8.
Product ion mass spectra of G1 and G2 (m/z 708).
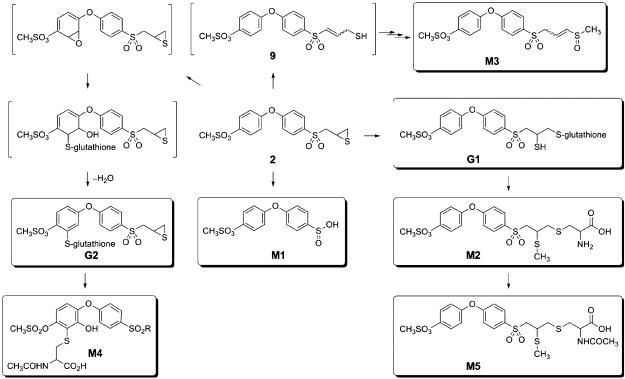
The metabolism of compound 2 is outlined in Figure 9. One route involves the addition of glutathione to the thiirane ring, giving rise first to G1. The existence of G1 was not noted in the in vivo experiments, although the presence of the cysteinecontaining metabolites strongly implied its transient existence. We note that glutathione addition to the thiirane will generate a thiol, which typically receives a methyl group in the course of the reactions of methyltransferases prevalent in the metabolic processes. As is typical for glutathione adducts, they experience proteolytic processing, a set of reactions that would process G1 to the cysteine adduct M2, which was isolated and characterized. One notes that in the course of these multistep processes, the thiol group of G1 is converted to the methylsulfide of M2. The well-precedented acetylation of the cysteine α-amine by acetyltransferases would result in M5, which was also isolated and characterized. Hence, the combination of the in vitro and in vivo experiments that we have performed clearly document the glutathione addition to the thiirane ring and its processing by proteases, methyltransferases and acetyltransferases to give rise to M2 and M5.
Figure 9.
Metabolic pathway of compound 2 (each identified and characterized metabolite is boxed).
A base-mediated ring opening of the thiirane would give the species 9. The reactions of a methyltransferase and an oxidase, followed by tautomerization of the double bond would generate M3. Alternatively, hydroxylation of the methylene α to the sulfone by an oxidase would lead to the elimination of the sulfinate, giving rise to the major metabolite M1. The types of reactions that lead to metabolites M1, M2, M3 and M5 were seen in metabolism of compound 1 as well (14,15).
We also noted glutathione addition in the terminal phenyl ring, which has not been noted for compound 1. The sequence of epoxidation in the aromatic ring and the addition of glutathione to it are well represented in the metabolism of aromatic compounds (24,25). This is seen here for the metabolism of compound 2. Proteolytic processing of the glutathione adduct G2 and the subsequent acetylation of the resultant cysteine would give rise to M4.
The metabolism of compound 2 was significantly less extensive than that of compound 1, as evidenced by the 75-fold increase in blood levels following single-dose administration. While systemic exposure of 2 decreased on multiple-dose administration, possibly because of P450 induction, blood levels of compound 2 were 2–3 orders of magnitude higher than Ki for gelatinases. Blood levels at the lower dose regimens were below the limit of quantification. We are currently developing a more sensitive bioanalytical method. It is worth mentioning that compound 1, despite low plasma levels and extensive rapid metabolism, has shown efficacy in mouse models of metastasis at 50 mg/kg/day (26,27). This is probably because of the fact that compound 1 is metabolized to the p-hydroxy variant, which is a more active gelatinase inhibitor than the parent 1 (14). It is anticipated that testing of compound 2 in mice would require significantly lower dose levels than compound 1, and as such should prove superior.
The selectivity of inhibitor 2 in inhibition of gelatinase activity and its potency for inhibition of tumor cell invasion demonstrated herein, together with its metabolic stability and systemic exposure makes it a promising candidate for testing in preclinical models of cancer and other gelatinase-dependent diseases.
Acknowledgments
This research was supported by CA122417 (to MC and SM), CA61986 (to RF) and CA100475 (to RF) from the National Institutes of Health. The authors thank the Center for Environmental Science and Technology at the University of Notre Dame for allowing generous access to Micromass Quattro LC mass spectrometer.
Abbreviations
- a.m.u.
atomic mass units
- DMSO
dimethylsulfoxide
- Dpa
N-3-(2,4-dinitrophenyl)-l-2,3-diaminopropionyl
- ECM
extracellular matrix
- EDTA
ethylenediaminetetraacetic acid
- FBS
fetal bovine serum
- HPLC
high-performance liquid chromatography
- MMP
matrix metalloproteinase
- MOCAc
(7-methoxycoumarin-4-yl)acetyl
- NADPH
nicotinamide adenine dinucleotide phosphate reduced
- PEG
polyethylene glycol
- TFA
trifluoroacetic acid
- UV
ultraviolet
- vdW
van der Waals
Footnotes
sybyl 7.3 (2006) St Louis, MO: Tripos Inc.
cosmo (2004) Madison, WI: Bruker-AXS.
Scheldrick G.M. (2004) SADABS. Göttingen, Germany: University of Göttingen
References
- 1.Chambers AF, Groom AC, MacDonald IC. Dissemination and growth of cancer cells in metastatic sites. Nat Rev Cancer. 2002;2:563–572. doi: 10.1038/nrc865. [DOI] [PubMed] [Google Scholar]
- 2.Sporn MB. The war on cancer. Lancet. 1996;347:1377–1381. doi: 10.1016/s0140-6736(96)91015-6. [DOI] [PubMed] [Google Scholar]
- 3.Lee M, Fridman R, Mobashery S. Extracellular proteases as targets for treatment of cancer metastases. Chem Soc Rev. 2004;33:401–409. doi: 10.1039/b209224g. [DOI] [PubMed] [Google Scholar]
- 4.Massova I, Kotra LP, Fridman R, Mobashery S. Matrix metalloproteinases: structures, evolution, and diversification. FASEB J. 1998;12:1075–1095. [PubMed] [Google Scholar]
- 5.Nagase H, Meng Q, Malinovskii V, Huang W, Chung L, Bode W, Maskos K, Brew K . Inhibition of Matrix Metalloproteinases: Therapeutic Applications. New York Academy of Science; New York: 1999. Engineering of Selective TIMPs; pp. 1–11. [DOI] [PubMed] [Google Scholar]
- 6.Stamenkovic I. Extracellular matrix remodelling: the role of matrix metalloproteinases. J Pathol. 2003;200:448–464. doi: 10.1002/path.1400. [DOI] [PubMed] [Google Scholar]
- 7.Sternlicht MD, Werb Z. How matrix metalloproteinases regulate cell behavior. Annu Rev Cell Dev Biol. 2001;17:463–516. doi: 10.1146/annurev.cellbio.17.1.463. [DOI] [PMC free article] [PubMed] [Google Scholar]
- 8.Bergers G, Benjamin LE. Angiogenesis: tumorigenesis and the angiogenic switch. Nat Rev Cancer. 2003;3:401–410. doi: 10.1038/nrc1093. [DOI] [PubMed] [Google Scholar]
- 9.Kerbel R, Folkman J. Clinical translation of angiogenesis inhibitors. Nat Rev Cancer. 2002;2:727–739. doi: 10.1038/nrc905. [DOI] [PubMed] [Google Scholar]
- 10.Steeg PS. Angiogenesis inhibitors: motivators of metastasis? Nat Med. 2003;9:822–823. doi: 10.1038/nm0703-822. [DOI] [PubMed] [Google Scholar]
- 11.Van't Veer Laura J, Weigelt B. Road map to metastasis. Nat Med. 2003;9:999–1000. doi: 10.1038/nm0803-999b. [DOI] [PubMed] [Google Scholar]
- 12.Egeblad M, Werb Z. New functions for the matrix metalloproteinases in cancer progression. Nat Rev Cancer. 2002;2:161–174. doi: 10.1038/nrc745. [DOI] [PubMed] [Google Scholar]
- 13.Brown S, Bernardo MM, Li ZH, Kotra LP, Tanaka Y, Fridman R, Mobashery S. Potent and selective mechanism-based inhibition of gelatinases. J Am Chem Soc. 2000;122:6799–6800. [Google Scholar]
- 14.Lee M, Villegas-Estrada A, Celenza G, Boggess B, Toth M, Kreitinger G, Forbes C, Fridman R, Mobashery S, Chang M. Metabolism of a highly selective gelatinase inhibitor generates active metabolite. Chem Biol Drug Des. 2007;70:371–382. doi: 10.1111/j.1747-0285.2007.00577.x. [DOI] [PubMed] [Google Scholar]
- 15.Celenza G, Villegas-Estrada A, Lee M, Boggess B, Forbes C, Wolter WR, Suckow MA, Mobashery S, Chang M. Metabolism of (4-phenoxyphenylsulfonyl)methylthiirane, a selective gelatinase inhibitor. Chem Biol Drug Des. 2008;71:187–196. doi: 10.1111/j.1747-0285.2008.00632.x. [DOI] [PubMed] [Google Scholar]
- 16.Ikejiri M, Bernardo MM, Bonfil RD, Toth M, Chang ML, Fridman R, Mobashery S. Potent mechanism-based inhibitors for matrix metalloproteinases. J Biol Chem. 2005;280:33992–34002. doi: 10.1074/jbc.M504303200. [DOI] [PubMed] [Google Scholar]
- 17.Elkins PA, Ho YS, Smith WW, Janson CA, D'Alessio KJ, McQueney MS, Cummings MD, Romanic AM. Structure of the C-terminally truncated human ProMMP9, a gelatin-binding matrix metalloproteinase. Acta Crystallogr D Biol Crystallogr. 2002;58:1182–1192. doi: 10.1107/s0907444902007849. [DOI] [PubMed] [Google Scholar]
- 18.Friesner RA, Banks JL, Murphy RB, Halgren TA, Klicic JJ, Mainz DT, Repasky MP, Knoll EH, Shelley M, Perry JK, Shaw DE, Francis P, Shenkin PS. Glide: a new approach for rapid, accurate docking and scoring. 1 Method and assessment of docking accuracy. J Med Chem. 2004;47:1739–1749. doi: 10.1021/jm0306430. [DOI] [PubMed] [Google Scholar]
- 19.Ewing TJA, Kuntz ID. Critical evaluation of search algorithms for automated molecular docking and database screening. J Comput Chem. 1997;18:1175–1189. [Google Scholar]
- 20.Kleifeld O, Kotra LP, Gervasi DC, Brown S, Bernardo MM, Fridman R, Mobashery S, Sagi I. X-ray absorption studies of human matrix metalloproteinase-2 (MMP-2) bound to a highly selective mechanism-based inhibitor – comparison with the latent and active forms of the enzyme. J Biol Chem. 2001;276:17125–17131. doi: 10.1074/jbc.M011604200. [DOI] [PubMed] [Google Scholar]
- 21.Ma DW, Cai Q. N,N-Dimethyl glycine-promoted Ullmann coupling reaction of phenols and aryl halides. Org Lett. 2003;5:3799–3802. doi: 10.1021/ol0350947. [DOI] [PubMed] [Google Scholar]
- 22.Lee M, Bernardo MM, Meroueh SO, Brown S, Fridman R, Mobashery S. Synthesis of chiral 2-(4-phenoxyphenylsulfonylmethyl)thiiranes as selective gelatinase inhibitors. Org Lett. 2005;7:4463–4465. doi: 10.1021/ol0517269. [DOI] [PubMed] [Google Scholar]
- 23.Lim IT, Brown S, Mobashery S. A convenient synthesis of a selective gelatinase inhibitor as an antimetastatic agent. J Org Chem. 2004;69:3572–3573. doi: 10.1021/jo049857v. [DOI] [PubMed] [Google Scholar]
- 24.Chen Q, Doss GA, Tung EC, Liu WS, Tang YS, Braun MP, Didolkar V, Strauss JR, Wang RW, Stearns RA, Evans DC, Baillie TA, Tang W. Evidence for the bioactivation of zomepirac and tolmetin by an oxidative pathway: identification of glutathione adducts in vitro in human liver microsomes and in vivo in rats. Drug Metab Dispos. 2006;34:145–151. doi: 10.1124/dmd.105.004341. [DOI] [PubMed] [Google Scholar]
- 25.Pakenham G, Lango J, Buonarati M, Morin D, Buckpitt A. Urinary naphthalene mercapturates as biomarkers of exposure and stereoselectivity of naphthalene epoxidation. Drug Metab Dispos. 2002;30:247–253. doi: 10.1124/dmd.30.3.247. [DOI] [PubMed] [Google Scholar]
- 26.Bonfil RD, Sabbota A, Nabha S, Bernardo MM, Dong Z, Meng H, Yamamoto H, Chinni SR, Lim IT, Chang M, Filetti LC, Mobashery S, Cher ML, Fridman R. Inhibition of human prostate cancer growth, osteolysis and angiogenesis in a bone metastasis model by a novel mechanism-based selective gelatinase inhibitor. Int J Cancer. 2006;118:2721–2726. doi: 10.1002/ijc.21645. [DOI] [PubMed] [Google Scholar]
- 27.Kruger A, Arlt MJE, Gerg M, Kopitz C, Bernardo MM, Chang M, Mobashery S, Fridman R. Antimetastatic activity of a novel mechanism-based gelatinase inhibitor. Cancer Res. 2005;65:3523–3526. doi: 10.1158/0008-5472.CAN-04-3570. [DOI] [PubMed] [Google Scholar]


