

Abstract
Cadmium (Cd) exposure results in injury to the proximal tubule characterized by polyuria and proteinuria. Kidney injury molecule-1 (Kim-1) is a transmembrane glycoprotein not normally detected in the mature kidney, but is upregulated and shed into the urine following nephrotoxic injury. In this study, we determine if Kim-1 might be a useful early biomarker of Cd nephrotoxicity. Male Sprague-Dawley rats were given daily injections of Cd for up to 12 weeks. Weekly urine samples were analyzed for Kim-1, protein, creatinine, metallothionein, and Clara cell protein CC-16. Significant levels of Kim-1 were detected in the urine by 6 weeks and continued to increase throughout the treatment period. This appearance of Kim-1 occurred 4-5 weeks before the onset of proteinuria, and 1-3 weeks before the appearance of metallothionein and CC-16. Higher doses of Cd gave rise to higher Kim-1 excretion. Reverse transcriptase-polymerase chain reaction (RT-PCR) expression analysis showed that Kim-1 transcript levels were increased after 6 weeks at the low dose of Cd. Immunohistochemical analysis showed that Kim-1 was present in proximal tubule cells of the Cd-treated rats. Our results suggest that Kim-1 may be a useful biomarker of early stages of Cd-induced proximal tubule injury.
Keywords: biomarkers, cadmium, Kim-1, nephrotoxicity, Clara cell protein (CC-16), metallothionein
Cadmium (Cd) is an important industrial and environmental pollutant that has pleomorphic effects on multiple organ systems. Depending on the dose, route, and duration of exposure, Cd can damage various organs including the lung, liver, kidney, bone, and testis.1-4 In addition, Cd is teratogenic and carcinogenic.5-7 With the chronic, low-level patterns of exposure that are common in humans, the kidney is a primary target of toxicity. Cd causes a generalized dysfunction of the proximal tubule that is characterized by polyuria and proteinuria.8-11 Several recent studies have highlighted the fact that adverse renal effects of Cd may result from even very low levels of exposure, and that children and individuals with confounding health conditions may be especially susceptible.12-15
As a result of its ability to accumulate Cd and its sensitivity to injury, the kidney is, in effect, a sentinel of Cd exposure, and much attention has been focused on the identification of urinary biomarkers of the early stages of Cd nephrotoxicity.16-21 Some of the biomarkers that have been used for this purpose include metallothionein,22 β2-microglobulin,10 and CC-16.23 Metallothionein is a specific metal binding protein that plays a role in delivering Cd to the epithelial cells of the proximal tubule.24-27 The urinary excretion of metallothionein has been used both as a marker of Cd exposure and renal injury.20,21,28 β2-Microglobulin and CC-16 are low-molecular-weight proteins that are present at low levels in the plasma. Under normal conditions, they are filtered at the glomerulus and are efficiently reabsorbed by the proximal tubule.29,30 When the proximal tubule is injured, however, elevated levels of these proteins begin to appear in the urine.10,16,23,31 β2-Microglobulin has been widely utilized in monitoring human populations for early signs of Cd-induced renal dysfunction.16,19,32,33 Although CC-16 has not been widely used as a marker of Cd toxicity in humans, it has been used for this purpose in experimental studies in rats, where it has been shown to be comparable to β2-microglobulin as a marker of Cd nephrotoxicity.34
While these markers have been used to monitor Cd toxicity in humans and experimental animals, several problems remain. For example, the urinary excretion of metallothionein is a marker of Cd exposure as well as proximal tubular injury, but identifying the critical level of urinary metallothionein to indicate the onset of tubular injury has been problematic.16,19,21,22,28,35,36 Moreover, it is not totally clear if increases in the urinary excretion of β2-microglobulin and CC-16 are solely markers of tubular dysfunction, or are a reflection of the blood levels of the proteins, which can be influenced by actions of toxicants on organs other than the kidney.21
Kidney injury molecule-1 (Kim-1), which is also known as hepatitis A virus cellular receptor 1 (Havcr1),37 is a type I transmembrane protein that is not detectable in normal kidney tissue, but is expressed at high levels in de-differentiated proximal tubule epithelial cells after ischemic or toxic injury.16,38,39 It has been proposed that Kim-1 functions as a regulator of cell-cell adhesion at a time when the dedifferentiated regenerating cells of the injured proximal tubule relocate to denuded patches of the basement membrane and reform a continuous epithelial layer.40 This process is associated with the proteolytic cleavage of the ectodomain of Kim-1 into the urine.40 The Kim-1 ectodomain is stable in urine and can be detected in the urine of humans with acute kidney injury,38 and in a variety of nephrotoxic models in animals.39,41,42 Kim-1 has been shown to be a sensitive marker of renal injury induced by cisplatin, S-(1,1,2,2,-tetrafluoroethyl)-l-cysteine, folic acid,39,42 Hg,43 and cyclosporine.44
The purpose of the present study was to evaluate the possible utility of Kim-1 as an early urinary biomarker of Cd-induced renal injury. This study entailed the use of a well-established sub-chronic model of Cd exposure in rats and a direct comparison of the Kim-1 results with two other accepted urinary markers of Cd nephrotoxicity: metallothionein and CC-16.
RESULTS
Effects of Cd on body weight, and urinary and blood parameters
As can be seen in Figure 1a, Cd-treated (0.6 mg/kg/5 days per week) animals gained significantly less weight than control animals over the 12 weeks of treatment. Cd had no effect on urinary creatinine excretion (Figure 1c). However, after 9-10 weeks, the Cd-treated animals showed a significant increase in urine volume (Figure 1b) and protein excretion (Figure 1d). The development of polyuria and proteinuria without significant changes in creatinine excretion is characteristic of Cd-induced proximal tubule dysfunction.9,11 The magnitude and timing of these effects are comparable to those reported by other investigators using similar treatment protocols.45-48
Figure 1. Effects of Cd on body weight, urine volume, urinary creatinine, and urinary protein.

Male Sprague-Dawley rats received daily subcutaneous injections of Cd (0.6 mg/kg) for up to 12 weeks, and one day each week, (a) animals were weighed, (b) 24-h urine samples were collected and (c) analyzed for creatinine and (d) protein as described in the Materials and Methods section. Values represent the mean±s.e.m. An * indicates significant differences from week matched control values as determined by two-way ANOVA (P<0.05) and Tukey’s post hoc test. #Significant differences from week matched control values as determined by the non-parametric Kruskal-Wallis test (P<0.05) and Dunn’s post hoc test for multiple comparisons; n=10-17 for each data point.
Table 1 summarizes more detailed analyses of urine and blood samples from animals treated with Cd for 6 weeks and 12 weeks. After 6 weeks, there were no changes in the urine or blood parameters, except that blood urea nitrogen was slightly elevated. After 12 weeks of exposure to Cd, however, there were significant increases in urine volume, and urinary levels of protein, lactate dehydrogenase and albumin. There were also significant changes in urine pH, specific gravity, and blood urea nitrogen. Urinary glucose and serum creatinine also appeared to be elevated, although the changes did not reach levels of statistical significance.
Table 1. Summary of urine and blood analysis data for weeks 6 and 12 samples.
| 6 Weeks |
12 Weeks | |||
|---|---|---|---|---|
| Parameter | Control | Cd | Control | Cd |
| Urine volume (ml/kg/24 h) | 34.3±2.2 | 47.3±5.0 | 18.8±1.5 | 148±14* |
| Urinary protein (mg/kg/24 h) | 48.4±3.5 | 55.1±3.4 | 41.1±5.1 | 117±28* |
| Urinary creatinine (mg/kg/24 h) | 27.5±1.6 | 24.5±2.4 | 28.7±1.7 | 30.2±1.2 |
| Urinary glucose (mg/kg/24 h) | 7.78±0.81 | 7.93±0.51 | 7.9±0.7 | 16.7±5.6 |
| Urinary alkaline phosphatase (U/kg/24 h) | 2.84±0.57 | 3.61±0.58 | 3.6±0.31 | 4.4±0.58 |
| Urinary LDH (U/kg/24 h) | 1.05±0.030 | 0.66±0.08 | 0.15±0.02 | 4.0±0.7* |
| Urinary albumin (mg/kg/24 h) | 0.57±0.23 | 1.08±0.31 | 0.87±0.07 | 9.0±1.7* |
| Urine pH | 8.41±0.3 | 8.0±0.03 | 7.2±0.3 | 9.0±0* |
| Urine specific gravity | 1.006±0.003 | 1.006±0.002 | 1.010±0.002 | 1.000±0* |
| Serum creatinine (mg/dl) | 0.45±0.05 | 0.48±0.05 | 0.92±0.03 | 1.3±0.16 |
| BUN (mg/dl) | 17.5±2.0 | 23.2±0.8* | 27.6±1.8 | 43.0±2.8* |
BUN, blood urea nitrogen; Cd, cadmium; LDH, lactate dehydrogenase.
Animals were treated with Cd (0.6 mg/kg, 5 days per week) for 6 or 12 weeks, and urine and blood samples were analyzed as described in the Materials and Methods section. The results for most of the urine analyses represent the mean±s.e.m. of 10-11 replicate samples for each treatment group. The values for serum creatinine and BUN represent the mean±s.e.m. for six controls and five Cd-treated animals. Since the Cd-treated animals gained significantly less weight than the control animals, the results of the urine analyses are expressed as units per kg body weight per 24 h.
An denotes significant differences from week matched control values as determined by two-tailed t-tests (P<0.05).
Excretion of Kim-1, CC-16, and metallothionein
As can be seen in Figure 2, elevated levels of Kim-1 appeared in urine after 5-6 weeks of Cd exposure and then continued to rise slightly over the next 2 weeks. Between weeks 8 and 9, levels of Kim-1 increased markedly and remained elevated throughout the remainder of the treatment period. The excretion of both CC-16 and metallothionein followed similar patterns, although significant increases in the excretion of these molecules occurred later than the increase in Kim-1 excretion. Over the first 9 weeks, the urinary levels of both molecules appeared to increase slowly, and then over the final 3 weeks the excretion of both proteins increased markedly.
Figure 2. Effects of Cd on the urinary excretion of Kim-1, CC-16, and metallothionein.

Animals were treated with Cd (0.6 mg/kg, 5 days per week) for up to 12 weeks and weekly urine samples were analyzed for levels of Kim-1, CC-16, and metallothionein as described in the Materials and Methods section. Values represent the mean±s.e.m. An * indicates significant difference from week matched control values (P<0.05) as determined by two-way ANOVA and Tukey’s post hoc test. #Significant difference from week matched control values (P<0.05) as determined by the non-parametric Kruskal-Wallis test and Dunn’s post hoc test for multiple comparisons. For the Kim-1 data, n=16-17 for weeks 1-6, and 10-11 for weeks 7-12; for CC-16, n=10-11; and for metallothionein, n = 5.
The specific time at which the increases in the excretion of these markers reached a level of statistical significance (P < 0.05) depended on the type of statistical analysis used. Analysis of the data by standard parametric tests (analysis of variance (ANOVA) and Tukey’s post hoc test), which are similar to methods used in previous studies on these biomarkers,17,34,36,42,49,50 showed that the increase in Kim-1 excretion reached a level of significance (P < 0.05) after 9 weeks, whereas the increases in the excretion of CC-16 and metallothionein did not reach levels of significance until 11 and 10 weeks respectively. This type of parametric analysis, however, is not the most appropriate test for these data because the variances are not homogenous (see Materials and Methods). When the data were analyzed by the more appropriate non-parametric Kruskal-Wallis test and Dunn’s post hoc test, the increase in Kim-1 excretion reached a level of statistical significance after 6 weeks, whereas the increase in the excretion of CC-16 and metallothionein did not reach levels of significance until 8 weeks and 12 weeks, respectively. In considering these statistical analyses, it should be noted that the levels of CC-16 in about 30% of the samples from control animals were below levels of sensitivity of the assays (which were 3 ng/ml and 1 ng/ml in the two assay runs). In performing the statistical analyses, a numerical value half way between 0 and the lowest detectable level was entered for these samples. Since levels of CC-16 in most of the control samples were well above the limit of sensitivity, entering values as half the detection limit probably underestimated the levels of CC-16 in the control samples and actually increased the chances that Cd-induced elevations in urinary levels of CC-16 would be statistically significant. The key point here is that even with this bias, the results of each of these statistical analyses indicate that the Cd-induced increase in Kim-1 excretion occurred before the increases in the excretion of CC-16 and metallothionein.
Dose-response relationship
To determine if the Cd-induced increased in Kim-1 urinary excretion was dependent on the dose of Cd, groups of rats were treated with either 0, 0.6, 1.2, or 2.4 mg/kg Cd, 5 days per week for 4 weeks. Figure 3 shows that after 4 weeks of treatment, the higher doses of Cd (1.2 and 2.4 mg/kg) caused significant increases in the excretion of Kim-1, and that the magnitude of the increase was directly related to the dose of Cd to which the animals were exposed. The data summarized in Table 2 shows that the animals that were treated with the higher doses of Cd (1.2 and 2.4 mg/kg/day) exhibited significant weight loss along with increases in urine volume, and urinary levels of protein and lactate dehydrogenase. Blood urea nitrogen was also significantly elevated, but serum creatinine was not, attesting to the insensitivity of serum creatinine as a biomarker of nephrotoxicity.
Figure 3. Dose dependence of the Cd-induced increase in Kim-1 excretion.
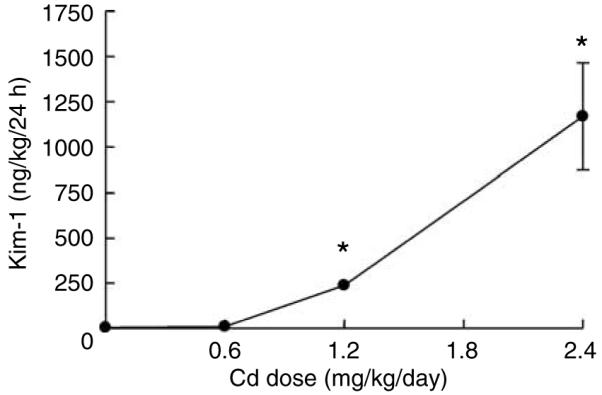
Animals were treated with varying doses of Cd (0, 0.6, 1.2, or 2.4 mg/kg/5 days per week for 4 weeks) and urine was analyzed for levels of Kim-1 as described in the Materials and Methods section. The results represent the mean±s.e.m. of six replicate samples for each treatment group. An * denotes significant differences from control values (P<0.05) as determined by the non-parametric Kruskal-Wallis test and Dunn’s post hoc test.
Table 2. Summary of urine and blood analyses for 4-week dose-response study.
| Parameter | Control | Cd (0.6 mg) | Cd (1.2 mg) | Cd (2.4 mg) |
|---|---|---|---|---|
| Body weight (g) | 372±6.4 | 342±6.5* | 324±10* | 304±6.1* |
| Urine volume (ml/kg/24 h) | 25.9±2.9 | 43.1±8.6 | 80.8±15 | 209±43* |
| Urinary protein (mg/kg/24 h) | 57.2±5.8 | 77.9±10 | 76.1±6.0 | 109±17* |
| Urinary alkaline phosphatase (U/kg/24 h) | 2.9±0.23 | 3.7±0.4 | 3.9±0.6 | 5.8±1.4 |
| Urinary LDH (U/kg/24 h) | 1.3±0.1 | 1.7±0.1 | 4.6±0.3* | 19.0±1.7* |
| Serum creatinine (mg/dl) | 0.60±0.1 | 0.50±0.0 | 0.58±0.05 | 0.54±0.04 |
| BUN (mg/dl) | 21.7±3.0 | 19.5±0.9 | 22.5±2.8 | 31.6±1.7* |
BUN, blood urea nitrogen; Cd, cadmium; LDH, lactate dehydrogenase.
Animals were treated with varying doses of Cd (0, 0.6, 1.2, or 2.4 mg/kg/5days per week for 4 weeks) and urine and blood samples were analyzed as described in the Materials and Methods section. The results represent the mean±s.e.m. of 5-6 replicate samples for each treatment group. Since the Cd-treated animals gained significantly less weight than the control animals, the results of the urine analyses are expressed as units per kg body weight per 24 h.
An denotes significant differences from control values as determined by ANOVA and post hoc Tukey’s test (P<0.05).
Renal morphology and Kim-1 expression
Figure 4 shows hematoxylin and eosin-stained tissue sections of outer renal cortex from control and Cd-treated (0.6 mg/kg/5 days per week for 6 or 12 weeks) animals, along with the immunoperoxidase labeling of Kim-1 in similar sections. The hematoxylin and eosin-stained sections show that the major site of Cd toxicity was the proximal tubule. Proximal tubule epithelial cells in the control samples exhibited cuboidal shapes, well-defined nuclei, and a uniform cytoplasm, with no spaces or gaps between the cells. By contrast, the epithelial cells in the samples from Cd-treated animals (top center and top right) showed a ragged, irregular appearance, with gaps between the cells. The cells remained attached to the basement membrane, however, and showed no overt evidence of necrosis. Analyses of the glomeruli and distal segments of the nephron revealed no evidence of pathology (not shown). The immunoperoxidase labeling shows that after 6 weeks of Cd exposure, Kim-1 was present in a few cells within isolated proximal tubules (arrows). After 12 weeks, Kim-1 labeling was more widely distributed (arrows) in the cytoplasm and on the apical surface of the epithelial cells in about 25% of the proximal tubules. Figure 5 summarizes the results of real-time reverse transcriptase-polymerase chain reaction (RT-PCR) gene expression analyses in the renal cortex. Kim-1 transcript levels in control samples were very low. In samples from the Cd-treated animals, however, Kim-1 transcript levels were increased by six-fold at 6 weeks and by 24-fold at 12 weeks.
Figure 4. Effects of Cd on the general morphology and the expression of Kim-1 in renal cortex.
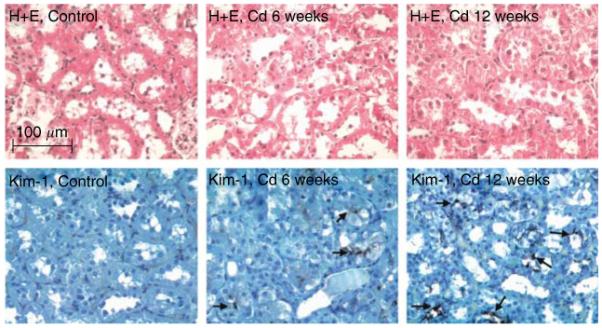
Rats were treated with Cd (0.6 mg/kg/5 days per week) for 6 or 12 weeks, and representative sections of the renal cortex were processed for hematoxylin and eosin staining and the visualization of Kim-1 (original magnification × 164).
Figure 5. Real time RT-PCR analysis of Kim-1 expression.
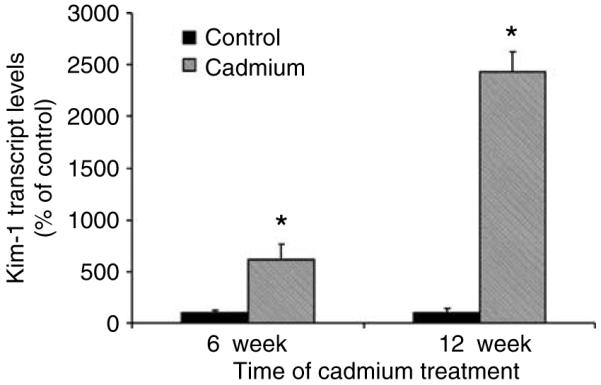
Total RNA was isolated from the renal cortex and subjected to real time RT-PCR analysis as described in the Materials and Methods section (n=4 for the 6-week controls and 6 for all other treatment groups). An * denotes significant differences from week matched control values as determined by two-tailed t-tests (P<0.05).
To determine if the Cd-induced changes in Kim-1 expression were associated with the death of epithelial cells in the proximal tubule, kidneys from representative animals were perfused in situ with the membrane impermeable nuclear fluorochrome ethidium homodimer, and the number of ethidium-labeled nuclei in cryosections of the outer cortex was determined using a method recently developed in the Prozialeck laboratory.51 As a positive control to identify necrotic cells, three additional animals were treated acutely with HgCl2 (3.5 mg Hg/kg, intraperitoneally), a treatment that produces proximal tubule necrosis within 24 h.51 The results of this study are summarized in Figure 6. The photos in the top row show phase-contrast images of the microscopic fields; those in the middle row show the 4,6 diamidino-2 phenylindole (DAPI)-labeled nuclei (total cells) in the same fields and those in the bottom row show the ethidium labeling (necrotic cells). Note that the number of ethidium-labeled nuclei in samples from the Cd-treated animals was not significantly different from controls, whereas the number of ethidium-labeled nuclei in samples from the Hg-treated animals was much higher. The fact that the samples from the Cd-treated animals showed no apparent increase in the number of ethidium-labeled cells indicates that the vast majority of proximal tubule epithelial cells were still viable, and that the changes in Kim-1 expression did not occur secondary to necrosis.
Figure 6. The effects of Cd and Hg on renal cell membrane integrity.

Animals were treated with either Cd (0.6 mg/kg, subcutaneously 5 days a week for 6 weeks) or HgCl2 (3.5 mg/kg of Hg, intraperitoneally), and the left kidneys were perfused with ethidium homodimer. Cryosections of the kidneys were then fixed, permeabilized, and labeled with DAPI to identify total nuclei. (a-d) Phase-contrast images corresponding to DAPI-labeled panels (e-h) and ethidium homodimer-labeled panels (i-l). No differences in ethidium homodimer labeling were detected in (j) 6-week Cd2+-treated samples or (k) 12-week Cd-treated samples compared with (i)12 week saline-treated control. In contrast, samples from Hg-treated animals showed widespread necrosis (l), as indicated by intense ethidium labeling (original magnification × 164).
DISCUSSION
The results of these studies utilizing a well-established model of sub-chronic Cd exposure in rats indicate that Kim-1 is a sensitive marker of Cd-induced proximal tubular injury. Significantly elevated levels of Kim-1 appeared in the urine after 6 weeks of treatment with Cd, whereas overt polyuria and proteinuria, which are classic signs of Cd-induced proximal tubule injury, did not become evident until 9-10 weeks of Cd treatment. Immunohistochemical analyses showed that Kim-1 was expressed in the epithelial cells of the proximal tubule. Additional studies showed that the magnitude of the increase in the urinary excretion of Kim-1 was directly related to the dose of Cd to which the animals were exposed.
To further evaluate the possible utility of Kim-1 as an early marker of Cd-induced proximal tubular injury, we directly compared the time course for the appearance of Kim-1 in urine with the appearance of metallothionein and CC-16, which are two widely accepted markers of Cd nephrotoxicity. Slightly elevated levels of all three markers began to appear in the urine very early in the course of treatment (i.e., after 2-3 weeks) and continued to rise in a more or less linear manner over the next 5-6 weeks, at which point there was a pronounced increase in the excretion of all three markers. The specific time points at which the increases in the excretion of the markers reached levels of statistical significance varied depending on the type of statistical analysis performed. However, the results consistently showed that the Cd-induced increase in the excretion of Kim-1 preceded the increases in the excretion of metallothionein and CC-16 by 1-3 weeks.
In comparing Kim-1, metallothionein, CC-16, and β2-microglobulin as markers of nephrotoxicity, it is important to note that each of these molecules is derived from different sources and their appearance in the urine is indicative of different events in the process of Cd nephrotoxicity. For example, the Cd-metallothionein complex is initially formed in the liver and redistributes to the kidney, where it is filtered at the glomerulus.24,52-54 While most of the filtered Cd-metallothionein complex is efficiently taken up by epithelial cells of the proximal tubule, small amounts are also excreted in urine. During this phase, the appearance of metallothionein in urine is mainly an indication of Cd exposure, rather than tubular injury.35 With continued exposure, Cd-metallothionein is taken up by the proximal tubule until the concentration of Cd reaches a critical threshold.27,55-57 At this point, the cells begin to die and slough off into the urine. During this phase, the levels of urinary metallothionein increase markedly and are indicative of injury to the proximal tubule.35 Our results show that metallothionein begins to appear in the urine after 1-2 weeks of exposure to Cd. The levels then slowly rise until weeks 9-10, at which point there is a marked increase in the urinary excretion of metallothionein. This surge in the urinary excretion of metallothionein coincides with the onset of polyuria and proteinuria. This pattern is similar to that reported by other investigators19,28,33,36,58 and is consistent with the hypothesis that the early, linear phase of metallothionein excretion is a reflection of Cd exposure, whereas the later rise in metallothionein excretion is a reflection of Cd-induced tubular injury.
CC-16 is primarily produced by Clara cells of the lung.59,60 It is normally present at low levels in plasma from where it is filtered at the glomerulus and efficiently reabsorbed by the proximal tubule.29,60 Significant amounts of the protein appear in the urine, however, when the proximal tubule is injured.23,61 While CC-16 has been reported to be a sensitive maker of Cd-induced renal dysfunction in humans23 and rats,34 the appearance of CC-16 in urine is not necessarily a specific marker of renal injury. Urinary levels of CC-16 may also reflect increases in serum levels of the protein resulting from pathologic processes occurring in the lung. For example, serum levels of CC-16 are increased by exposure to pneumotoxins such as cigarette smoke,61,62 nitric oxide,63 and ozone.29,49 The fact that CC-16 is not a specific marker of renal injury could complicate the interpretation of studies involving a toxic substance such as Cd that can affect multiple organs such as the lung and kidney. Like CC-16, β2-microglobulin is also not necessarily a specific marker of proximal tubular injury. As the invariant light-chain component of class I major histocompatibility antigens,64 β2 microglobulin is derived from many tissues and serum levels of the protein can be influenced by pathologic processes in a variety of organs.63,65-68 The fact that Kim-1 is specifically produced by injured epithelial cells of the proximal tubule and then shed into urine suggests that it may be a more specific marker of Cd-induced proximal tubular injury.
Although these studies indicate that Kim-1 is a very early biomarker of Cd nephrotoxicity, the specific relationships between the expression of Kim-1 and the pathophysiologic events of Cd-induced renal injury are not yet totally clear. Evidence suggests that Kim-1 is expressed as part of the tissue repair process after injured cells slough off from the proximal tubule and surviving cells migrate to the denuded areas of the basement membrane to reform the epithelial barrier.40 A key issue that is yet to be resolved, however, concerns the nature of the initial Cd-induced cellular injury that triggers this response. One possibility is that the injured cells die, either through necrotic or apoptotic mechanisms, and then slough off with resultant Kim-1 appearance in the urine. The other possibility is that sublethal cellular injury might lead to a loss of epithelial cell-cell adhesion and cause some cells to detach from the epithelial surface. The results of this study showed that there was little evidence of necrosis of proximal tubule epithelial cells at the time Kim-1 began to appear in urine. This finding is consistent with recent observations that the early stages of Cd nephrotoxicity involve changes in proximal tubule function that occur before overt necrosis of epithelial cells.69 Other studies indicate that these early stages of Cd-induced renal injury involve alterations in epithelial cell-cell adhesion and epithelial polarity,69,70 and are associated with changes in the localization of cell adhesion molecules such as N-cadherin69 and claudin-2.71 Together, these findings suggest that the disruption of cell adhesion molecule function may represent a critical step in the process of Cd-induced renal injury, and in the activation of Kim-1 expression. Additional studies are needed, however, to clarify this issue.
Another potential benefit of Kim-1 as a biomarker for Cd-induced renal injury is that it is conserved across species and is upregulated after renal injury in a variety of species including mice,72 rats,39 non-human primates,73 and humans.74 While it remains to be determined if Kim-1 excretion is increased in humans who have been exposed to Cd, the availability of a standard marker that is conserved across species could greatly facilitate the extrapolation of the results of studies in animals to the results of studies on human populations and vice versa.
MATERIALS AND METHODS
Animals
Male Sprague-Dawley rats weighing 250-300 g (Harlan, Indianapolis, IN, USA) were maintained in individual plastic cages on a 14/10 h light/dark cycle. For the low-dose, sub-chronic studies, animals in the Cd treatment group (n = 6) received daily (Monday-Friday) subcutaneous injections of CdCl2 at a Cd dose of 0.6 mg (5.36 μmoles)/kg in 0.25-0.40 ml isotonic saline for up to 12 weeks. Control group animals (n = 6) received daily injections of the saline vehicle alone. One day each week, 24 h urine samples were collected. The animals were allowed free access to water at all times. Food was also available ad libitum, except during the period in which the urine samples were being collected. This treatment protocol was repeated three times and data were pooled whenever possible. In another study, groups of animals were treated with varying doses of Cd (0, 0.6, 1.2, or 2.4 mg/kg/) 5 days per week for 4 weeks.
Urine and blood analyses
Twenty-four-hour urine samples were analyzed for protein and creatinine content. Sample aliquots were immediately frozen at -80°C and then later analyzed for levels of Kim-1, CC-16, and metallothionein. Creatinine was determined by the colorimetric method of Shoucri and Pouliot.75 Urinary protein was determined by the Bradford Coomassie blue dye assay (Pierce no. 23236, Rockford, IL, USA). Glucose, pH and specific gravity, alkaline phosphatase, lactate dehydrogenase, blood urea nitrogen, and serum creatinine were analyzed at the Animal Resources Laboratory at the University of Chicago.
Determination of Kim-1, metallothionein, and CC-16
Urine samples were coded so that individuals performing the analyses were blinded as to the identity of the samples. Kim-1 protein was measured using Microsphere-based Luminex xMAP™ technology with monoclonal antibodies raised against rat Kim-1 in the Vaidya/Bonventre laboratory. This technique is an adaptation of the recently developed and validated sandwich enzyme-linked immunosorbant assay, that was described at the 2005 American Society of Nephrology Meeting (Vaidya et al., J Am Soc Nephrol 16:192A, 2005, abstract). This assay has been extensively evaluated with respect to its assay range (4-40 000 pg/ml), sensitivity (lowest limit of detection: 8.8 pg/ml), specificity, recovery analysis (90-100% recovery) precision profile (inter and intra assay variability < 10%), and dilutional linearity. The validation studies also showed a significant correlation of 92% between enzyme-linked immunosorbant assay and this microbead-based assay. This assay has been used to determine urinary levels of Kim-1 in several recent studies on rats.42,44,76,77 Urinary metallothionein levels were determined by an enzyme-linked immunosorbant assay procedure28,78 in the Liu/Waalkes laboratory. Levels of CC-16 were determined in the Dumont/Bernard laboratory using an automated immunoassay based on latex particle agglutination and an antibody specific for rat CC-16.34,79
Immunohistochemical visualization of Kim-1
Formalin-fixed, paraffin-embedded tissue sections (5 μm) were deparaffinized in xylene, rehydrated with a series of alcohol washes, and then incubated for 20 min at 95°C in a citrate buffer solution (Zymed Laboratories, #00-5000, South San Francisco, CA, USA). The samples were then processed for visualization of Kim-1 using a monoclonal anti-rat Kim-1 antibody and the same labeling protocol for paraffin embedded tissue samples described previously.80
Real-time RT-PCR analysis of Kim-1 expression
RNA was isolated from samples of renal cortex with TRIzol reagent (Invitrogen, Carlsbad, CA, USA), and purified with RNeasy mini-kit (Qiagen, Valencia, CA, USA). Primers for the Kim-1 gene (NM_173149: forward primer: TGGCACTGTGACATCCTCAGA, reverse primer: GCAACGGACATGCCAACATA) and the house-keeping GAPDH gene (NM_017008: forward primer: CCTGGAGAAACCTGCCAAGTAT, reverse primer: AGCCCAGGATGCCCTTTAGT) were designed using ABI Primer Express software (Applied Biosystems, Foster City, CA, USA). Total RNA was reverse transcribed with ABI High-Capacity cDNA Reverse Transcription kit and then subjected to real-time PCR using ABI SYBR green PCR master mix (Applied Biosystems, Cheshire, UK). The cycle time values of Kim-1 were normalized with GAPDH, and the relative differences between control and Cd groups were calculated and expressed as percentage of controls.
Evaluation of proximal tubule epithelial cell necrosis
Necrosis of proximal tubule epithelial cells was evaluated by perfusing the left kidney with the cell viability indicator, ethidium homodimer, using a procedure recently developed and validated in the Prozialeck laboratory.51 Following the perfusion procedure, the left kidney was removed and cryosectioned at a thickness of 5 μm. Sections were mounted on glass slides, fixed, permeabilized in -20°C methanol, and stained with 0.3 μm DAPI, to label all nuclei. Fields were viewed under both phase-contrast and fluorescent illumination using a ×40 objective The number of total nuclei (DAPI labeled) and dead cells (ethidium-labeled nuclei) were determined in random fields of renal cortex. Each field contained approximately 300 cells in an area of 9.1 × 104 μm2. Digital images were captured with a Spot digital camera (Diagnostic Instruments, Sterling Heights, MI, USA) and processed using the Image-Pro Plus imaging analysis software package (Media Cybernetics, Silver Spring, MD, USA).51
Statistical analysis
Statistical analyses were performed using the Sigma Stat computer program (Version V2.03, Systat Software Inc., Point Richmond, CA, USA). Data for the various urinary parameters were evaluated by two different types of analyses. The first approach involved the use of standard ANOVA, followed by post hoc Tukey’s tests to determine differences among the various treatment groups. This was done because similar tests have been commonly used in many previous studies on the urinary excretion of these markers in similar models.34,36,42,49,50,81 However, while performing these analyses, we found that this approach might not be appropriate, because the data points for the later treatment periods showed significantly more variability than the points for earlier treatment periods. ANOVA and Tukey’s tests are parametric tests that assume normality of distribution and homogeneity of variances (i.e., that standard deviations are equal for all treatment groups).82 Analysis of the present data by the Kolmogorov-Smirnov test (normality) and Levene’s test (homogeneity of variances) showed that much of the data did not meet these criteria. Accordingly, the data were also analyzed by the non-parametric Kruskal-Wallis test and Dunn’s post hoc test for multiple comparisons, which are more appropriate for these types of variable, heterogeneous data.82 Since many previous studies on these markers utilized parametric methods, we have included the results of both our parametric and non-parametric analysis so that the reader can directly compare the results of this study with those previously reported in the literature.
ACKNOWLEDGMENTS
Preliminary results of this study were presented at the 2006 Meeting of the Society of Toxicology. We gratefully acknowledge the excellent technical assistance of Evan Diamantakos. In addition, we thank Jennifer Theusch, of the Animal Resources Laboratory of the University of Chicago, for her help with the urine and plasma analyses, Victoria Sears and Laura Phelps, of Midwestern University, for their help in preparing the manuscript, and Drs Lamia Benbrahim-Talla and Larry Keefer for critically reviewing this paper. This work was supported by NIH Grants ES 006478 to WCP; DK 039773, DK 072831 and DK 074099 to JVB, Scientist Development Grant 0535492T from the American Heart Association to VSV, and by funds from the Intramural Research Program of the NIH, National Cancer Institute, Center for Cancer Research to MPW and JL.
Footnotes
DISCLOSURE
None of the authors have any conflicts of interest or financial stakes in any of the issues or products described and/or used in this work.
REFERENCES
- 1.Bernard A, Lauwerys R. Cadmium in human population. Experientia. 1984;40:143–152. doi: 10.1007/BF01963577. [DOI] [PubMed] [Google Scholar]
- 2.Fassett DW. Cadmium: biological effects and occurrence in the enviroment. Annu Rev Pharmacol. 1975;15:425–435. doi: 10.1146/annurev.pa.15.040175.002233. [DOI] [PubMed] [Google Scholar]
- 3.Jarup L, Berglund M, Elinder CG, et al. Health effects of cadmium exposure—a review of the literature and a risk estimate. Scand J Work Environ Health. 1975;24(Suppl 1):1–51. [PubMed] [Google Scholar]
- 4.Morselt AF. Environmental pollutants and diseases. A cell biological approach using chronic cadmium exposure in the animal model as a paradigm case. Toxicology. 1991;70:1–132. doi: 10.1016/0300-483x(91)90102-7. [DOI] [PubMed] [Google Scholar]
- 5.Degraeve N. Carcinogenic, teratogenic and mutagenic effects of cadmium. Mutat Res. 1981;86:115–135. doi: 10.1016/0165-1110(81)90035-x. [DOI] [PubMed] [Google Scholar]
- 6.Elinder CG, Kjellstrom T. Carcinogenic and mutagenic effects. In: Friberg L, Elinder CG, Kjellstrom T, Nordberg GF, editors. Cadmium and Health: a Toxicological and Epidemiological Appraisal. Vol. 1. CRC Press; Boca Raton, FL: 1986. pp. 205–229. [Google Scholar]
- 7.Waalkes MP, Coogan TP, Barter RA. Toxicological principles of metal carcinogenesis with special emphasis on cadmium. Crit Rev Toxicol. 1992;22:175–201. doi: 10.3109/10408449209145323. [DOI] [PubMed] [Google Scholar]
- 8.Friberg L. Cadmium and the kidney. Environ Health Perspect. 1984;54:1–11. doi: 10.1289/ehp.84541. [DOI] [PMC free article] [PubMed] [Google Scholar]
- 9.Kjellstrom T. Renal Effects. In: Friberg L, Elinder C-G, Kjellstrom T, Nordberg GF, editors. Cadmium and Health: a Toxicological and Epidemiological Appraisal. Vol. 2. CRC Press; Boca Raton, FL: 1986. pp. 21–109. [Google Scholar]
- 10.Lauwerys RR, Bernard A, Roels HA, et al. Characterization of cadmium proteinuria in man and rat. Environ Health Perspect. 1984;54:147–152. doi: 10.1289/ehp.8454147. [DOI] [PMC free article] [PubMed] [Google Scholar]
- 11.Piscator M. The nephropathy of chronic cadmium poisoning. In: Foulkes EC, editor. Cadmium, Handbook of Experimental Pharmacology. Vol. 80. Springer-Verlag; New Yor: 1986. pp. 194–197. [Google Scholar]
- 12.Akesson A, Lundh T, Vahter M, et al. Tubular and glomerular kidney effects in Swedish women with low environmental cadmium exposure. Environ Health Perspect. 2005;113:1627–1631. doi: 10.1289/ehp.8033. [DOI] [PMC free article] [PubMed] [Google Scholar]
- 13.Friedman LS, Lukyanova EM, Kundiev YI, et al. Anthropometric, environmental, and dietary predictors of elevated blood cadmium levels in Ukrainian children: Ukraine ELSPAC group. Environ Res. 2006;102:83–89. doi: 10.1016/j.envres.2006.04.002. [DOI] [PubMed] [Google Scholar]
- 14.Hellstrom L, Elinder CG, Dahlberg B, et al. Cadmium exposure and end-stage renal disease. Am J Kidney Dis. 2001;38:1001–1008. doi: 10.1053/ajkd.2001.28589. [DOI] [PubMed] [Google Scholar]
- 15.Jarup L. Cadmium overload and toxicity. Nephrol Dial Transplant. 2002;17(Suppl 2):35–39. doi: 10.1093/ndt/17.suppl_2.35. [DOI] [PubMed] [Google Scholar]
- 16.Abe T, Kobayashi E, Okubo Y, et al. Application of path analysis to urinary findings of cadmium-induced renal dysfunction. J Environ Sci Health A Tox Hazard Subst Environ Eng. 2001;36:75–87. doi: 10.1081/ese-100000473. [DOI] [PubMed] [Google Scholar]
- 17.Bernard A. Renal dysfunction induced by cadmium: biomarkers of critical effects. Biometals. 2004;17:519–523. doi: 10.1023/b:biom.0000045731.75602.b9. [DOI] [PubMed] [Google Scholar]
- 18.Mueller PW, Price RG, Finn WF. New approaches for detecting thresholds of human nephrotoxicity using cadmium as an example. Environ Health Perspect. 1998;106:227–230. doi: 10.1289/ehp.98106227. [DOI] [PMC free article] [PubMed] [Google Scholar]
- 19.Nakajima M, Kobayashi E, Suwazono Y, et al. Excretion of urinary cadmium, copper, and zinc in cadmium-exposed and nonexposed subjects, with special reference to urinary excretion of beta2-microglobulin and metallothionein. Biol Trace Elem Res. 2005;108:17–31. doi: 10.1385/bter:108:1-3:017. [DOI] [PubMed] [Google Scholar]
- 20.Roels HA, Hoet P, Lison D. Usefulness of biomarkers of exposure to inorganic mercury, lead, or cadmium in controlling occupational and environmental risks of nephrotoxicity. Ren Fail. 1999;21:251–262. doi: 10.3109/08860229909085087. [DOI] [PubMed] [Google Scholar]
- 21.Shaikh ZA, Smith LM. Biological indicators of cadmium exposure and toxicity. Experientia. 1986;(Suppl 50):124–130. doi: 10.1007/978-3-0348-7238-6_16. [DOI] [PubMed] [Google Scholar]
- 22.Shaikh ZA, Ellis KJ, Subramanian KS, Greenberg A. Biological monitoring for occupational cadmium exposure: the urinary metallothionein. Toxicology. 1990;63:53–62. doi: 10.1016/0300-483x(90)90068-r. [DOI] [PubMed] [Google Scholar]
- 23.Bernard AM, Thielemans NO, Lauwerys RR. Urinary protein 1 or Clara cell protein: a new sensitive marker of proximal tubular dysfunction. Kidney Int Suppl. 1994;47:S34–S37. [PubMed] [Google Scholar]
- 24.Klaassen CD, Liu J. Role of metallothionein in cadmium-induced hepatotoxicity and nephrotoxicity. Drug Metab Rev. 1997;29:79–102. doi: 10.3109/03602539709037574. [DOI] [PubMed] [Google Scholar]
- 25.Klaassen CD, Liu J, Choudhuri S. Metallothionein: an intracellular protein to protect against cadmium toxicity. Annu Rev Pharmacol Toxicol. 1999;39:267–294. doi: 10.1146/annurev.pharmtox.39.1.267. [DOI] [PubMed] [Google Scholar]
- 26.Nordberg M, Jin T, Nordberg GF. Cadmium, metallothionein and renal tubular toxicity. IARC Sci Publ. 1992;118:293–297. [PubMed] [Google Scholar]
- 27.Nordberg M. General aspects of cadmium: transport, uptake and metabolism by the kidney. Environ Health Perspect. 1984;54:13–20. doi: 10.1289/ehp.845413. [DOI] [PMC free article] [PubMed] [Google Scholar]
- 28.Chen L, Jin T, Huang B, et al. Critical exposure level of cadmium for elevated urinary metallothionein—an occupational population study in China. Toxicol Appl Pharmacol. 2006;215:93–99. doi: 10.1016/j.taap.2006.01.013. [DOI] [PubMed] [Google Scholar]
- 29.Broeckaert F, Clippe A, Knoops B, et al. Clara cell secretory protein (CC16): features as a peripheral lung biomarker. Ann NY Acad Sci. 2000;923:68–77. doi: 10.1111/j.1749-6632.2000.tb05520.x. [DOI] [PubMed] [Google Scholar]
- 30.Sundin DP, Cohen M, Dahl R, et al. Characterization of the beta 2-microglobulin endocytic pathway in rat proximal tubule cells. Am J Physiol. 1994;267:F380–F389. doi: 10.1152/ajprenal.1994.267.3.F380. [DOI] [PubMed] [Google Scholar]
- 31.Roels H, Bernard A, Buchet JP, et al. Urinary excretion of beta2-microglobulin and other proteins in workers exposed to cadmium, lead or mercury. Pathol Biol (Paris) 1978;26:329–331. [PubMed] [Google Scholar]
- 32.Kobayashi E, Suwazono Y, Uetani M, et al. Estimation of benchmark dose as the threshold levels of urinary cadmium, based on excretion of total protein, beta2-microglobulin, and N-acetyl-beta-d-glucosaminidase in cadmium nonpolluted regions in Japan. Environ Res. 2006;101:401–406. doi: 10.1016/j.envres.2005.12.002. [DOI] [PubMed] [Google Scholar]
- 33.Lauwerys RR, Bernard AM, Roels HA, Buchet JP. Cadmium: exposure markers as predictors of nephrotoxic effects. Clin Chem. 1994;40:1391–1394. [PubMed] [Google Scholar]
- 34.Lermioglu F, Bernard A. Effect of calmodulin-inhibitors and verapamil on the nephrotoxicity of cadmium in rat. Toxicol Lett. 1998;95:9–13. doi: 10.1016/s0378-4274(98)00016-2. [DOI] [PubMed] [Google Scholar]
- 35.Shaikh ZA, Tohyama C. Urinary metallothionein as an indicator of cadmium body burden and of cadmium-induced nephrotoxicity. Environ Health Perspect. 1984;54:171–174. doi: 10.1289/ehp.8454171. [DOI] [PMC free article] [PubMed] [Google Scholar]
- 36.Sugihira N, Tohyama C, Murakami M, Saito H. Significance of increase in urinary metallothionein of rats repeatedly exposed to cadmium. Toxicology. 1986;41:1–9. doi: 10.1016/0300-483x(86)90099-5. [DOI] [PubMed] [Google Scholar]
- 37.Feigelstock D, Thompson P, Mattoo P, et al. The human homolog of HAVcr-1 codes for a hepatitis A virus cellular receptor. J Virol. 1998;72:6621–6628. doi: 10.1128/jvi.72.8.6621-6628.1998. [DOI] [PMC free article] [PubMed] [Google Scholar]
- 38.Han WK, Bonventre JV. Biologic markers for the early detection of acute kidney injury. Curr Opin Crit Care. 2004;10:476–482. doi: 10.1097/01.ccx.0000145095.90327.f2. [DOI] [PubMed] [Google Scholar]
- 39.Ichimura T, Hung CC, Yang SA, et al. Kidney injury molecule-1: a tissue and urinary biomarker for nephrotoxicant-induced renal injury. Am J Physiol Renal Physiol. 2004;286:F552–F563. doi: 10.1152/ajprenal.00285.2002. [DOI] [PubMed] [Google Scholar]
- 40.Bailly V, Zhang Z, Meier W, et al. Shedding of kidney injury molecule-1, a putative adhesion protein involved in renal regeneration. J Biol Chem. 2002;277:39739–39748. doi: 10.1074/jbc.M200562200. [DOI] [PubMed] [Google Scholar]
- 41.Amin RP, Vickers AE, Sistare F, et al. Identification of putative gene based markers of renal toxicity. Environ Health Perspect. 2004;112:465–479. doi: 10.1289/ehp.6683. [DOI] [PMC free article] [PubMed] [Google Scholar]
- 42.Vaidya VS, Ramirez V, Ichimura T, et al. Urinary kidney injury molecule-1: a sensitive quantitative biomarker for early detection of kidney tubular injury. Am J Physiol Renal Physiol. 2006;290:F517–F529. doi: 10.1152/ajprenal.00291.2005. [DOI] [PubMed] [Google Scholar]
- 43.Goering PL, Vaidya VS, Brown RP, et al. Kidney injury molecule-1 (KIM-1) expression in kidney and urine following acute exposure to gentamicin and mercury. (abstract) The Toxicologist CD—An Official Journal of the Society of Toxicology. 2006;90:S-1. doi: 10.1093/toxsci/kfm260. [DOI] [PMC free article] [PubMed] [Google Scholar]
- 44.Perez-Rojas J, Blanco JA, Cruz C, et al. Mineralocorticoid receptor blockade confers renoprotection in preexisting chronic cyclosporine nephrotoxicity. Am J Physiol Renal Physiol. 2006;292:131–139. doi: 10.1152/ajprenal.00147.2006. [DOI] [PubMed] [Google Scholar]
- 45.Dudley RE, Gammal LM, Klaassen CD. Cadmium-induced hepatic and renal injury in chronically exposed rats: likely role of hepatic cadmium-metallothionein in nephrotoxicity. Toxicol Appl Pharmacol. 1985;77:414–426. doi: 10.1016/0041-008x(85)90181-4. [DOI] [PubMed] [Google Scholar]
- 46.Liu J, Liu Y, Habeebu SS, Klaassen CD. Susceptibility of MT-null mice to chronic CdCl2-induced nephrotoxicity indicates that renal injury is not mediated by the CdMT complex. Toxicol Sci. 1998;46:197–203. doi: 10.1006/toxs.1998.2541. [DOI] [PubMed] [Google Scholar]
- 47.Shaikh ZA, Vu TT, Zaman K. Oxidative stress as a mechanism of chronic cadmium-induced hepatotoxicity and renal toxicity and protection by antioxidants. Toxicol Appl Pharmacol. 1999;154:256–263. doi: 10.1006/taap.1998.8586. [DOI] [PubMed] [Google Scholar]
- 48.Suzuki Y. Cadmium metabolism and toxicity in rats after long-term subcutaneous administration. J Toxicol Environ Health. 1980;6:469–482. doi: 10.1080/15287398009529866. [DOI] [PubMed] [Google Scholar]
- 49.Arsalane K, Broeckaert F, Knoops B, et al. Increased serum and urinary concentrations of lung Clara cell protein in rats acutely exposed to ozone. Toxicol Appl Pharmacol. 1999;159:169–174. doi: 10.1006/taap.1999.8738. [DOI] [PubMed] [Google Scholar]
- 50.Lee YH, Shaikh ZA, Tohyama C. Urinary metallothionein and tissue metal levels of rats injected with cadmium, mercury, lead, copper or zinc. Toxicology. 1983;27:337–345. doi: 10.1016/0300-483x(83)90029-x. [DOI] [PubMed] [Google Scholar]
- 51.Edwards JR, Diamantakos EA, Peuler JD, et al. A novel method for the evaluation of proximal tubule epithelial cell viability in the intact rat kidney using ethidium homodimer. BMC Physiol. 2007;7:1. doi: 10.1186/1472-6793-7-1. [DOI] [PMC free article] [PubMed] [Google Scholar]
- 52.Cherian MG, Goyer RA, aquerriere-Richardson L. Cadmium-metallothionein-induced nephropathy. Toxicol Appl Pharmacol. 1976;38:399–408. doi: 10.1016/0041-008x(76)90146-0. [DOI] [PubMed] [Google Scholar]
- 53.Nordberg GF. Modulation of metal toxicity by metallothionein. Biol Trace Elem Res. 1989;21:131–135. doi: 10.1007/BF02917245. [DOI] [PubMed] [Google Scholar]
- 54.Webb M. Role of metallothionein in cadmium metabolism. In: Foulkes EC, editor. Cadmium, Hanbook of Experimental Pharmacology. Vol. 80. Springer-Verlag; New York: 1986. pp. 281–337. [Google Scholar]
- 55.Goyer RA, Miller CR, Zhu SY, Victery W. Non-metallothionein-bound cadmium in the pathogenesis of cadmium nephrotoxicity in the rat. Toxicol Appl Pharmacol. 1989;101:232–244. doi: 10.1016/0041-008x(89)90272-x. [DOI] [PubMed] [Google Scholar]
- 56.Squibb KS, Fowler BA. Intracellular metabolism and effects of circulating cadmium-metallothionein in the kidney. Environ Health Perspect. 1984;54:31–35. doi: 10.1289/ehp.845431. [DOI] [PMC free article] [PubMed] [Google Scholar]
- 57.Squibb KS, Pritchard JB, Fowler BA. Cadmium-metallothionein nephropathy: relationships between ultrastructural/biochemical alterations and intracellular cadmium binding. J Pharmacol Exp Ther. 1984;229:311–321. [PubMed] [Google Scholar]
- 58.Tohyama C, Shaikh ZA. Metallothionein in plasma and urine of cadmium-exposed rats determined by a single-antibody radioimmunoassay. Fundam Appl Toxicol. 1981;1:1–7. doi: 10.1093/toxsci/1.1.1-c. [DOI] [PubMed] [Google Scholar]
- 59.Singh G, Katyal SL, Gottron SA. Antigenic, molecular and functional heterogeneity of Clara cell secretory proteins in the rat. Biochim Biophys Acta. 1985;829:156–163. doi: 10.1016/0167-4838(85)90184-0. [DOI] [PubMed] [Google Scholar]
- 60.Singh G, Katyal SL. Clara cell proteins. Ann NY Acad Sci. 2000;923:43–58. doi: 10.1111/j.1749-6632.2000.tb05518.x. [DOI] [PubMed] [Google Scholar]
- 61.Bernard A, Lauwerys R. Low-molecular-weight proteins as markers of organ toxicity with special reference to Clara cell protein. Toxicol Lett. 1995;77:145–151. doi: 10.1016/0378-4274(95)03284-3. [DOI] [PubMed] [Google Scholar]
- 62.Van ME, Dumont X, Bernard A. CC16 as a marker of lung epithelial hyperpermeability in an acute model of rats exposed to mainstream cigarette smoke. Toxicol Lett. 2005;159:115–123. doi: 10.1016/j.toxlet.2005.05.007. [DOI] [PubMed] [Google Scholar]
- 63.Halatek T, Gromadzinska J, Wasowicz W, Rydzynski K. Serum clara-cell protein and beta2-microglobulin as early markers of occupational exposure to nitric oxides. Inhal Toxicol. 2005;17:87–97. doi: 10.1080/08958370590899460. [DOI] [PubMed] [Google Scholar]
- 64.Cresswell P, Springer T, Strominger JL, et al. Immunological identity of the small subunit of HL-A antigens and beta2-microglobulin and its turnover on the cell membrane. Proc Natl Acad Sci USA. 1974;71:2123–2127. doi: 10.1073/pnas.71.5.2123. [DOI] [PMC free article] [PubMed] [Google Scholar]
- 65.Kobryn A, Pacsa A, White AG, et al. Are peripheral blood lymphocytes the source of elevated B-2-microglobulin in renal transplant recipients? Transplant Proc. 1989;21:302–303. [PubMed] [Google Scholar]
- 66.O’Bryan MK, Cheng CY. Purification and cellular localization of beta2-microglobulin in the testis. Life Sci. 1997;61:487–494. doi: 10.1016/s0024-3205(97)00408-6. [DOI] [PubMed] [Google Scholar]
- 67.Poulik MD. beta2-Microglobulin: present status. Prog Clin Biol Res. 1976;5:155–177. [PubMed] [Google Scholar]
- 68.Poulik MD, Gold P, Shuster J. beta 2-Microglobulin: methods and clinical applications. CRC Crit Rev Clin Lab Sci. 1979;10:225–245. doi: 10.3109/10408367909147135. [DOI] [PubMed] [Google Scholar]
- 69.Prozialeck WC, Lamar PC, Lynch SM. Cadmium alters the localization of N-cadherin, E-cadherin, and beta-catenin in the proximal tubule epithelium. Toxicol Appl Pharmacol. 2003;189:180–195. doi: 10.1016/s0041-008x(03)00130-3. [DOI] [PubMed] [Google Scholar]
- 70.Prozialeck WC. Evidence that E-cadherin may be a target for cadmium toxicity in epithelial cells. Toxicol Appl Pharmacol. 2000;164:231–249. doi: 10.1006/taap.2000.8905. [DOI] [PubMed] [Google Scholar]
- 71.Jacquillet G, Barbier O, Cougnon M, et al. Zinc protects renal function during cadmium intoxication in the rat. Am J Physiol Renal Physiol. 2006;290:F127–F137. doi: 10.1152/ajprenal.00366.2004. [DOI] [PubMed] [Google Scholar]
- 72.Park KM, Byun JY, Kramers C, et al. Inducible nitric-oxide synthase is an important contributor to prolonged protective effects of ischemic preconditioning in the mouse kidney. J Biol Chem. 2003;278:27256–27266. doi: 10.1074/jbc.M301778200. [DOI] [PubMed] [Google Scholar]
- 73.Davis JW, Goodsaid FM, Bral CM, et al. Quantitative gene expression analysis in a nonhuman primate model of antibiotic-induced nephrotoxicity. Toxicol Appl Pharmacol. 2004;200:16–26. doi: 10.1016/j.taap.2004.02.001. [DOI] [PubMed] [Google Scholar]
- 74.Han WK, Bailly V, Abichandani R, et al. Kidney injury molecule-1 (KIM-1): a novel biomarker for human renal proximal tubule injury. Kidney Int. 2002;62:237–244. doi: 10.1046/j.1523-1755.2002.00433.x. [DOI] [PubMed] [Google Scholar]
- 75.Shoucri RM, Pouliot M. Some observations on the kinetics of the Jaffe reaction for creatinine. Clin Chem. 1977;23:1527–1530. [PubMed] [Google Scholar]
- 76.de Borst MH, van Timmeren MM, Vaidya VS, et al. Induction of kidney injury molecule-1 in homozygous Ren2 rats is attenuated by blockade of the renin-angiotensin system or p38 MAP kinase. Am J Physiol Renal Physiol. 2007;292:F313–F320. doi: 10.1152/ajprenal.00180.2006. [DOI] [PubMed] [Google Scholar]
- 77.van Timmeren MM, Bakker SJ, Vaidya VS, et al. Tubular kidney injury molecule-1 in protein-overload nephropathy. Am J Physiol Renal Physiol. 2006;291:F456–F464. doi: 10.1152/ajprenal.00403.2005. [DOI] [PubMed] [Google Scholar]
- 78.Tang W, Kido T, Gross WA, et al. Measurement of cadmium-induced metallothionein in urine by ELISA and prevention of overestimation due to polymerization. J Anal Toxicol. 1999;23:153–158. doi: 10.1093/jat/23.3.153. [DOI] [PubMed] [Google Scholar]
- 79.Halatek T, Hermans C, Broeckaert F, et al. Quantification of Clara cell protein in rat and mouse biological fluids using a sensitive immunoassay. Eur Respir J. 1998;11:726–733. [PubMed] [Google Scholar]
- 80.Pearson CA, Lamar PC, Prozialeck WC. Effects of cadmium on E-cadherin and VE-cadherin in mouse lung. Life Sci. 2003;72:1303–1320. doi: 10.1016/s0024-3205(02)02379-2. [DOI] [PubMed] [Google Scholar]
- 81.Bernard A, Hermans C. Biomonitoring of early effects on the kidney or the lung. Sci Total Environ. 1997;199:205–211. doi: 10.1016/s0048-9697(97)05497-1. [DOI] [PubMed] [Google Scholar]
- 82.Zar JH. Biostatistical Analysis. 3rd ed. Prentice Hall; Upper Saddle River, NJ: 1996. pp. 197–199. [Google Scholar]