

Abstract
Performance for identifying luminance-defined letters in peripheral vision improves with training. The purpose of the present study was to examine whether performance for identifying contrast-defined letters also improves with training in peripheral vision, and whether any improvement transfers to luminance-defined letters. Eight observers were trained to identify contrast-defined letters presented singly at 10° eccentricity in the inferior visual field. Before and after training, we measured observers’ thresholds for identifying luminance-defined and contrast-defined letters, embedded within a field of white luminance noise (maximum luminance contrast = 0, 0.25, and 0.5), at the same eccentric location. Each training session consisted of 10 blocks (100 trials per block) of identifying contrast-defined letters at a background noise contrast of 0.5. Letters (x-height = 4.2°) were the 26 lowercase letters of the Times-Roman alphabet. Luminance-defined letters were generated by introducing a luminance difference between the stimulus letter and its mid-gray background. The background noise covered both the letter and its background. Contrast-defined letters were generated by introducing a differential noise contrast between the group of pixels that made up the stimulus letter and the group of pixels that made up the background. Following training, observers showed a significant reduction in threshold for identifying contrast-defined letters (p < 0.0001). Averaged across observers and background noise contrasts, the reduction was 25.8%, with the greatest reduction (32%) occurring at the trained background noise contrast. There was virtually no transfer of improvement to luminance-defined letters, or to an untrained letter size (2× original), or an untrained retinal location (10° superior field). In contrast, learning transferred completely to the untrained contralateral eye. Our results show that training improves performance for identifying contrast-defined letters in peripheral vision. This perceptual learning effect seems to be stimulus-specific, as it shows no transfer to the identification of luminance-defined letters. The complete interocular transfer, and the retinotopic (retinal location) and size specificity of the learning effect are consistent with the properties of neurons in early visual area V2.
Keywords: Letter recognition, Peripheral vision, Perceptual learning, Second-order
1. Introduction
Performance for a variety of visual tasks improves with practice (e.g., Ball & Sekuler, 1982, 1987; Beard, Levi, & Reich, 1995; Chung, Legge, & Cheung, 2004; Chung, Levi, & Tjan, 2005; Fahle & Edelman, 1993; Fiorentini & Berardi, 1980, 1981; Karni & Sagi, 1991; Li, Levi, & Klein, 2004; McKee & Westheimer, 1978; Poggio, Fahle, & Edelman, 1992; Saarinen & Levi, 1995). This improvement is often termed “perceptual learning.” Perceptual learning occurs in foveal vision, as well as in peripheral vision. It occurs for low-level visual tasks such as discriminating the orientation of a short line segment, as well as higher-level visual tasks such as texture and face identification (Gold, Bennett, & Sekuler, 1999), or letter identification (Chung et al., 2004, 2005). Further, it occurs for unfamiliar tasks, e.g., identifying random texture patterns (Gold et al., 1999) or unfamiliar faces (see Fine & Jacobs, 2002 and Fahle, 2005 for recent reviews), as well as for highly familiar tasks such as letter identification (Chung et al., 2004, 2005).
While a number of previous studies of motion (e.g., Ball & Sekuler, 1982, 1987) and texture (Ahissar & Hochstein, 1997; Karni & Sagi, 1991, 1993) have used patterns where the target and background differed only in local motion or orientation, to date, most studies of perceptual learning of pattern recognition have employed targets that are defined by variations in local luminance, often referred to as first-order (luminance-defined) stimuli. In the absence of local luminance variations of an object, the visual system is still capable of detecting the object against its background based on other stimulus attributes such as variations in local contrast or texture. These stimuli are usually referred to as second-order stimuli. Psychophysical studies have provided ample evidence suggesting that the properties for processing first- and second-order stimuli are different. For instance, in the presence of nearby elements, the inhibition effect due to the presence of nearby elements on the target element shows higher specificity with respect to spatial frequency and orientation for first- than for second-order stimuli (Ellemberg, Allen, & Hess, 2004). The spatial extent of interaction between elements extends over a larger distance for first- than for second-order stimuli (Ellemberg et al., 2004), although this finding seems unexpected based on the larger receptive field sizes for neurons processing second-order information (Mareschal & Baker, 1998; Rosa, 1997). Adaptation to first-order stimuli shows spatial-frequency and orientation selectivity, whereas adaptation to second-order stimuli only shows spatial-frequency selectivity but transfers across orientations (McGraw, Levi, & Whitaker, 1999). In addition, adaptation to either first- or second-order stimuli does not transfer to stimuli of the other type (Whitaker, McGraw, & Levi, 1997). Besides differences in spatial properties, temporal properties also differ between first- and second-order stimuli. Visual evoked potential latencies are shorter and psychophysical reaction times are faster for first- than for second-order motion stimuli (Ellemberg et al., 2003). These results are in concordance with physiological (Baker & Mareschal, 2001; Mareschal & Baker, 1998) and brain-imaging (Smith, Greenlee, Singh, Kraemer, & Hennig, 1998) evidence that there are two distinct processing streams for first- and second-order stimuli. Given the different spatial and temporal properties of, and independent streams for the processing of first- and second-order stimuli, the key questions we asked in this study were whether or not perceptual learning also extends to second-order stimuli, and if so, whether or not the improvement obtained through training with one type of stimulus transfers to stimuli of the other type.
In this study, we chose the task of letter identification to study perceptual learning with second-order stimuli, for several reasons. First, adult humans have had a lifetime of exposure to first-order letters, and none to second-order. Thus, our initial expectation was that there would be much stronger learning for second-order stimuli, compared with that for first-order stimuli. Moreover, if as suggested above that first- and second-order stimuli are processed independently, one would expect no transfer of learning from one type of stimulus to the other. Second, we already have some knowledge about the magnitude, time course, specificity, and mechanism of perceptual learning using first-order letters. Previously, we showed that observers improved in their ability to identify low-contrast luminance-defined letters presented briefly at 10° in the inferior visual field after 6 days of training (Chung et al., 2005). Across observers, the magnitude of improvement averaged about 22% (range 17–31%). Using the external noise paradigm (Pelli, 1985; Pelli & Farell, 1999), we found that the improvement following training to identify first-order letters is a consequence of the template becoming more capable of extracting the crucial information from the target (Chung et al., 2005). If this template is unique to the processing stream of either first-or second-order targets, and because these processing streams are reported to be distinct from one another (see also Oruc, Landy, & Pelli, 2005 who reported separate letter channels for second-order letters), then improvement in the ability of the template to extract crucial information from the target of one type is unlikely to transfer to targets of the other type (e.g., from first- to second-order letters, or vice versa). In contrast, if the template occurs at the stage of processing by which the information extracted from a target is compared with some internal reference before a decision about the target is made, then improvement in the ability of this template (or stage of processing) to process letter information should be independent of whether the original letter contains first- or second-order information. In other words, improvement resulting from training of one type of stimulus should transfer to stimuli of the other type.
2. Methods
To examine the question of whether or not perceptual learning occurs for the task of second-order letter identification, we trained observers to identify contrast-defined (second-order) letters presented at 10° in the inferior visual field, over a course of 5 days. Before (pre-test) and after (post-test) training, we measured observers’ performance for identifying contrast-defined letters at three background noise levels, and compared the performance measurement obtained at pre-tests and post-tests to determine if there was any improvement due to the training. We also compared observers’ performance for identifying luminance-defined (first-order) letters in pre-tests and post-tests, in order to determine if learning to identify second-order letters transferred to the task of identifying first-order letters. To further examine the specificity of the learning, we assessed observers’ performance during pre-tests and post-tests for three additional testing conditions: (i) for a different untrained letter size; (ii) at a different untrained retinal location; and (iii) in the untrained eye.
2.1. Basic experimental design
The basic experimental design and training schedule are represented schematically in Fig. 1. The pre-test consisted of measurement of threshold for identifying contrast-defined (second-order) and luminance-defined (first-order) letters, each at three background noise contrasts (maximum luminance contrast = 0, 0.25, and 0.5, corresponding to root-mean square (rms) contrast = 0, 0.07, and 0.14, respectively; unless otherwise stated, throughout the manuscript we used maximum luminance contrast to specify our contrast values). These six conditions were tested in a random sequence that was unique for each observer. Contrast-defined letters were generated by assigning a different contrast to the white noise that made up the letter, with respect to the contrast of the background (Fig. 2). The mean luminance of the letter and its background were the same. Hence, threshold for identifying contrast-defined letters was defined as the differential contrast (ΔC) that defined the letter from its background. Luminance-defined letters were generated by assigning a different luminance value to the letter, compared with the background (Fig. 2). White noise, if present, covered both the letter and its background. Thus, threshold for identifying luminance-defined letters was defined as the Weber contrast between the letter and its background, (letter luminance – background luminance)/background luminance. Details of stimulus generation are given in the following section.
Fig. 1.

A schematic cartoon illustrating the basic experimental design of the study.
Fig. 2.

Samples of luminance-defined (top) and contrast-defined (bottom) letters, embedded at the three background noise contrast levels.
To assess whether or not the improvements following training on identifying contrast-defined letters transferred to other stimulus or testing conditions, we also tested the baseline performance of our observers on three other conditions during the pre-test. These three conditions involved identifying contrast-defined letters at a background noise contrast of 0.5: (i) for a letter size twice as large as the size used for training; (ii) at 10° in the superior visual field; and (iii) in the contralateral untrained eye. These three conditions were tested following the other six conditions as described above, and in a random sequence that was different for each observer.
Training consisted of 50 blocks of trials (100 trials per block, 10 blocks per day for 5 days) of identifying contrast-defined letters at a background noise contrast of 0.5. Each training session lasted approximately an hour.
The post-test, following the last training session, was identical to the pre-test. The nine conditions were tested in the exact same order as prescribed during the pre-test, for each observer.
2.2. Apparatus
Stimuli were generated on a Macintosh G4 computer with software written in Matlab (The MathWorks, MA) using the Psychophysics Tool-box extensions (Brainard, 1997; Pelli, 1997), and were displayed on a Dell 15 in. (Model No. M783S) monitor at a mean luminance of 32 cd/m2. The luminance of the display was measured using a Minolta photometer. By combining the red and blue output of the display using a video attenuator (Pelli & Zhang, 1991) and the use of custom-built software (Tjan, personal communication), we obtained an effective 10 bit resolution of luminance after correcting for the gamma of the display. The display measured 31.3 × 23.5 cm (1024 × 768 pixels). Observers sat at 42 cm from the display during testing. At this viewing distance, each pixel subtends 2.5 arc min.
2.3. Stimulus generation
To generate the stimulus (letter + noise), we first generated a white noise array of 256 × 256 pixels. The luminance of each pixel was randomly assigned a value from 0 to 1, according to a rectangular distribution. These luminance values were then scaled, according to the desired background noise contrast (maximum luminance contrast = 0, 0.25, or 0.5). The noise field was refreshed for each trial.
For luminance-defined letters, the target letter was positioned within a letter array of 256 × 256 pixels. Pixels that corresponded to the background were assigned the mean luminance value, while pixels that corresponded to the target letter were assigned a luminance value that differed from the background luminance by the desired luminance contrast. The noise array was then added to the letter array to result in the stimulus (letter + noise).
For contrast-defined letters, we divided the noise array into two portions—pixels that made up the letter and those that made up the background. The luminance values of the pixels that corresponded to the background were scaled according to the background noise contrast, whereas the pixels that corresponded to the letter were scaled according to the sum of background noise contrast and the desired differential contrast (ΔC).
In the event that the luminance value of a pixel exceeded the maximum physical luminance, the pixel luminance was clipped at the maximum value. This happened occasionally, with all occurrences limited to the conditions with a background noise contrast of 0.5.
2.4. Testing and psychophysical procedures
Each condition described above was tested in a separate block of trials. In each block of trials, we used the Method of Constant Stimuli to present the stimulus letter at five stimulus levels (five differential contrast (ΔC) for contrast-defined letters or five Weber contrast levels for luminance-defined letters), with each stimulus level presented 20 times within the block. On each trial, unless otherwise specified, a single letter of x-height (the height of the lowercase letter “x”) 4.2° was presented for 150 ms, at 10° below a fixation target. Letters were randomly chosen with equal probability from the 26 lowercase letters of the Times-Roman alphabet. Observers were asked to carefully fixate the fixation target throughout testing. The use of a stimulus duration of 150 ms, shorter than the latency of saccadic eye movements (Leigh & Zee, 1999), precluded observers from making a saccade to directly look at the target letter after its onset on the display monitor. Following the presentation of each letter, observers indicated their responses as to the identity of the letter using the keyboard. Audio feedback was given to indicate whether or not the response was correct. Testing was monocular. Each observer chose his/her preferred eye for testing (except for one condition when we tested the untrained eye), with the non-testing eye covered with a standard black eye-patch.
2.5. Observers
Eight young adults aged between 22 and 34 participated in this study. With the exception of RL, who was one of the authors, all other observers were unaware of the purpose of the study. All had best-corrected visual acuity of 20/20 or better in each eye and no known ocular pathology. Some of them had refractive errors and thus they wore their best optical corrections (glasses or contact lenses) during the experiment. Written informed consent was obtained from each observer after the procedures of the experiment were explained, and before the commencement of data collection. Observers IC, MK, TT, and RL had participated in other perceptual learning experiments previously, however, none involving letter identification in peripheral vision.
3. Results
Differential-contrast (ΔC) thresholds for identifying contrast-defined letters and contrast thresholds for identifying luminance-defined letters are plotted as a function of background noise contrast, and compared between the pre- and post-tests in Fig. 3. We defined threshold as the ΔC, or contrast value that yielded 50%-correct performance (after correction for guessing) on the psychometric function, constructed based on the data from each block of trials. Each panel presents data of one observer. In those few cases where thresholds were not measurable (observers AC and MK), a value of 11 was used to represent the threshold for that block of trials. Although this chosen value was arbitrary, if anything, this underestimated the improvement that we observed.
Fig. 3.

Contrast threshold for identifying luminance-defined letters (squares) or differential-contrast threshold (ΔC) for identifying contrast-defined letters (circles) are plotted as a function of background noise contrast, and compared before (unfilled symbols) and after (filled symbols) training. Each panel presents data for one observer. Error bars represent ±1 SEM.
A comparison of the threshold vs. background noise (TvN) functions in Fig. 3 reveals that thresholds are less elevated (compared with the no-noise condition) in the presence of high background noise contrast (0.5) when identifying contrast-defined letters than for luminance-defined letters. Across all observers, pre- and post-tests, threshold elevations (thresholds obtained at 0.5 background noise contrast normalized to those obtained with- out background noise) averaged 1.23 for contrast-defined letters and 1.81 for luminance-defined letters. If we assume that the shape of the TvN functions for contrast-defined letters also follows the typical shape of a noise-masking function, as is the case for luminance-defined letters (Chung et al., 2005), then the smaller threshold elevation observed at a background noise contrast of 0.5 is simply an indication that the TvN functions for contrast-defined letters are shifted upward and to the right (toward higher background noise), when compared with the TvN functions for luminance-defined letters.
Fig. 4 plots the ratios of post- and pre-test values, as a function of background noise, for identifying luminance- and contrast-defined letters. Ratios <1 represent improvements following training. Across observers, the ratios averaged 0.923 and 0.742 for identifying luminance- and contrast-defined letters, respectively, and were statistically different from one another (repeated measures ANOVA: F(df = 1,7) = 67.83, p < 0.0001). Post hoc analyses show that the group-averaged ratio for identifying luminance-defined letters (0.923) was not statistically different from a value of 1 (no improvement following training). In contrast, the group-averaged ratio for identifying contrast-defined letters (0.742) was statistically different from a value of 1 (p < 0.0001). These findings suggest that training to identify contrast-defined letters improved the performance for identifying contrast-defined letters, but the improvement did not transfer to the task of identifying luminance-defined letters.
Fig. 4.
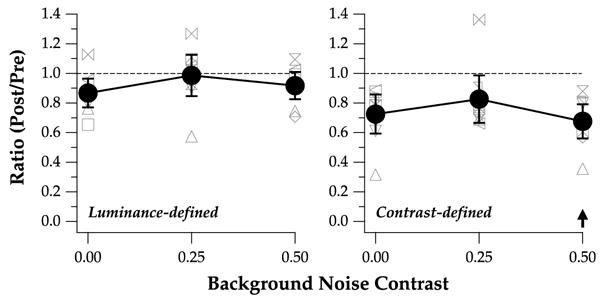
Threshold ratios (post-test/pre-test) are compared for the three background noise contrast levels, and between luminance-defined (left) and contrast-defined (right) letters. Ratios smaller than 1 represent improvements following training. Individual observers’ values are plotted as different gray symbols. Group-average values are represented by black filled circles, with the error bars representing the 95% confidence intervals. The black arrow indicates the training condition (contrast-defined letters at a background noise contrast = 0.5).
Did the improvement following training transfer to the two untrained background noise contrast (viz., 0 and 0.25)? Fig. 4 shows that the ratios were similar across the three background noise contrast for contrast-defined letters. Averaged across observers, the ratios averaged 0.73, 0.83, and 0.68, for background noise contrast of 0, 0.25, and 0.5, respectively. These ratios were not statistically different from each other (repeated measures ANOVA: F(df = 2,14) = 1.80, p = 0.20), implying that the improvement at the trained background noise contrast (0.5) transferred well to the other two untrained background noise contrast (0 and 0.25).
The progress of training for each observer, as a function of training block, is plotted in Fig. 5. Each short solid line represents the threshold averaged across the 10 blocks of each day. Like for the pre- and post-tests, we used a value of 1 to represent the threshold when it was not measurable (most obvious with observer MK). As stated earlier, for most observers, threshold ΔC decreased as training progressed (averaged ratios of post/pre-test thresholds = 0.742, significantly different from a value of 1, p < 0.0001).
Fig. 5.

Differential contrast (ΔC) for identifying contrast-defined letters is plotted as a function of training block, for each of the eight observers (gray symbols). The averaged threshold for each session (10 blocks) is represented by the black line. In the few cases where thresholds were not measurable, a value of 1.0 is used to represent the ΔC for that block of trials. Black filled symbols represent the thresholds obtained at pre- and post-tests (they are missing for pre-tests for AC and MK because their thresholds were too high to be measurable).
To examine the specificity of the learning effect, we compared the post-test/pre-test threshold ratios for the untrained letter size (twice the original size), untrained superior field and the untrained eye in Fig. 6. For comparison, the ratios for the trained condition (replotted from Fig. 4) are also included. Across observers, the ratios averaged (±95% CI) 0.88 ± 0.13, 1.02 ± 0.24, and 0.72 ± 0.11, for the untrained letter size, untrained superior field, and the untrained eye, respectively. For both the untrained letter size and untrained superior field, because the 95% CI included the value of 1 (no improvement), we concluded that there was no significant difference between thresholds obtained before and after training, or, in other words, the improvement following training did not transfer to the untrained letter size or the untrained superior visual field. In comparison, a value of 1 fell outside the 95% CI of the ratio for the untrained eye, implying that the learning transferred to the untrained eye. The magnitude of improvement (1 – ratio) was very comparable between the untrained eye (28%) and the trained eye (32%), for the same condition, suggesting an almost complete transfer of the learning to the untrained eye.
Fig. 6.
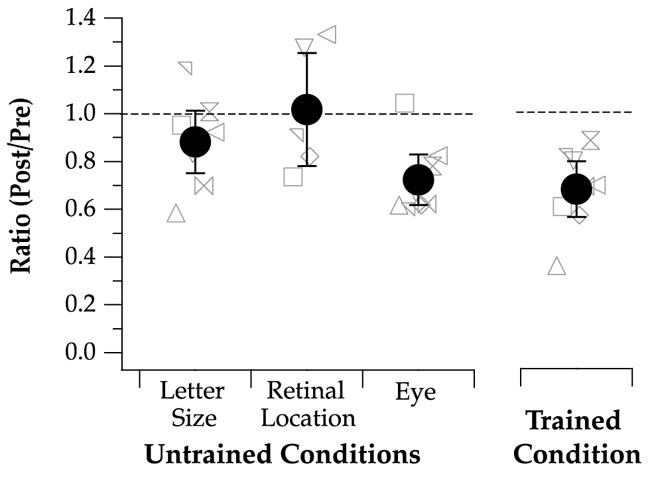
Threshold ratios (post-test/pre-test) are compared for the three conditions: untrained letter size (2× original), untrained retinal location (10° in the superior visual field) and the untrained eye. Data for the trained condition are also plotted for comparison. Individual observers’ values are plotted as different gray symbols. Group-average values are represented by black filled circles, with the error bars representing the 95% confidence intervals.
4. Discussion
In this study, we trained observers to identify contrast-defined letters at 10° in the inferior visual field over a course of 5 days. By comparing the performance for identifying luminance-defined and contrast-defined letters before and after training, we obtained the following key findings: (1) our training regime led to an improvement in the performance for identifying contrast-defined letters, but not for identifying luminance-defined letters; (2) the improvement following training at one background noise contrast transferred to the other two untrained background noise contrasts; (3) the improvement following training transferred to the contralateral untrained eye; and (4) the improvement following training did not transfer to the untrained superior visual field or to a letter size twice as large as the trained letter size.
4.1. Learning for second-order tasks
The primary questions we asked in this study were whether or not learning also extends to second-order targets, and if so, whether or not the improvement transfers to a first-order task. Based on our first key finding that training to identify contrast-defined letters led to an improvement in the performance for the same task, we conclude that perceptual learning can improve performance for second-order tasks. The magnitude of improvement (25.8%) was highly similar to that following perceptual learning of first-order letters (21.6%: Chung et al., 2005). This is somewhat surprising, considering that adult observers have previously been exposed to first-order letters all their lives. Evidently, in peripheral vision, years of passive exposure is not sufficient to make letter identification most efficient. Our finding that perceptual learning can improve performance for identifying contrast-defined letters is consistent with previous studies showing improvement following training on other types of stimuli that are not defined by variations in local luminance. Ball and Sekuler (1982, 1987) examined perceptual learning using a random-dot motion discrimination task. Karni and Sagi (1991, 1993) and Ahissar and Hochstein (1997) used arrays of texture elements (or “textons” after Julesz (1981, 1986), Julesz & Krose (1988)) in which a subset of the texture elements differs from the rest in orientations or the relative positions.
In our study, because the improvement following training to identify contrast-defined letters did not transfer to the task of identifying luminance-defined letters, we conclude that the improvement obtained following training on a second-order task does not transfer to an untrained first-order task. These findings are consistent with the converging evidence from psychophysical, physiological, and brain imaging studies (see Section 1 for references) that first- and second-order stimuli are processed by separate and distinct streams. It is commonly believed that the linear or quasi-linear neurons in V1 represent the primary site for responding to first-order stimuli that are characterized by variations in local luminance from their background. For second-order stimuli, it is postulated that the processing stream involves a filter–rectifier–filter pathway, where the first-stage filters are linear, with a possible neural substrate in the early cortical areas (Mareschal & Baker, 1998; Schofield, 2000). The output from this first-stage linear filters then undergoes some kind of nonlinear processing, possibly rectification, before feeding onto the second-stage filter. The neural site(s) of this second-stage filter in humans and primates have yet to be identified, but brain imaging experiments suggest a possible higher-order extrastriate locus, at least for motion processing (Dumoulin, Baker, Hess, & Evans, 2003; Smith et al., 1998). Given this evidence, it is not surprising that learning to identify contrast-defined (second-order) letters only improves performance for the same task, but not for the identification of luminance-defined (first-order) letters.
One potential complication is that perceptual learning, at least for first-order stimuli, is known to be specific to spatial frequency of stimulus (e.g., Fiorentini & Berardi, 1980, 1981). For second-order stimuli, McGraw et al. (1999) showed that adaptation to second-order stimuli also shows spatial-frequency selectivity. If we compare the spectral composition of luminance-defined letters with that of contrast-defined letters before rectification, there is a very distinct difference. Specifically, the amplitude of the power spectrum of luminance-defined letters shows a clear peak around 2 c/letter, corresponding to the band of spatial frequencies most important for letter identification (Chung, Legge, & Tjan, 2002; Majaj, Pelli, Kurshan, & Palomares, 2002; Solomon & Pelli, 1994); whereas the power spectrum of contrast-defined letters is flat across the range of spatial frequencies. Given that perceptual learning shows spatial-frequency specificity (Fiorentini & Berardi, 1980, 1981), the lack of a transfer of learning from contrast-defined to luminance-defined letters could also be due to the use of different early spatial scales in analyzing the letters. Indeed, one of our other results showing a lack of transfer of learning to a different letter size also supports the notion that spatial scale may be an important factor governing whether or not learning transfers between different stimuli.
Although the improvement following training does not transfer from contrast-defined to luminance-defined letters, the highly similar magnitudes of improvement obtained in the previous (21.6%) and the present (25.8%) studies suggest that the underlying mechanism for the improvement, for both luminance-defined and contrast-defined letters, could be similar. What could this underlying mechanism possibly be? By incorporating the external-noise paradigm and analyses using the linear amplifier model (e.g., Gold et al., 1999; Pelli, 1985) and the perceptual template model (e.g., Dosher & Lu, 1998, 1999; Lu & Dosher, 2004), we previously determined that the improvements following training to identify first-order letters is a consequence of the template becoming more capable of extracting the crucial information from the stimulus (Chung et al., 2005). It is possible then, that the improvement in identifying contrast-defined letters in this study was also a result of the template becoming more capable of extracting the information from the second-order stimulus. If so, and because the improvements following training to identify contrast-defined letters did not transfer to the task of identifying luminance-defined letters, we postulate that the templates at which improvements occurred are specific to the stream of processing of either first- or second-order stimuli. Moreover, the templates are evidently size specific, since the improvement did not transfer to a larger (2×) letter size. We speculate that the site of these templates is likely to be before the stage at which information extracted from the stimulus is compared with some internal decision references.
4.2. Transfer of improvements across noise background levels
Our second key finding is that the improvement following training at one background noise contrast (0.5) transferred to the other two untrained background noise contrasts (0 and 0.25). For first-order tasks, it is well established that there is an asymmetric pattern of transfer of improvements due to learning. The improvement resulting from training on a difficult task is not readily transferable to other tasks whereas the improvement resulting from training on an easy task can be transferred to other tasks (including difficult ones) readily (Ahissar & Hochstein, 1997; Liu & Weinshall, 2000). In relation to our study, a background noise contrast of 0.5 represents a difficult task. Therefore, we would not have expected a generalization of the learning effect at lower background noise contrast. Indeed, Dosher and Lu (2005) reported that training at a low external noise level improves performance at a high external noise level; however, the effect is not reciprocal in that training at a high external noise level does not lead to improved performance at low external noise level. We do not yet know if the difference between our finding and that of Dosher and Lu (2005) is due solely to the difference between learning of second- vs. first-order tasks, or whether it relates to the differences in tasks (letter identification vs. orientation discrimination).
4.3. Transfer of improvements across eyes
The almost complete transfer of the improvements following training from the trained to the untrained eye suggest that the improvements occur at a site after the input from the two eyes are combined, in other words, the site is binocular. This is consistent with psychophysical studies showing substantially higher magnitude of interocular transfer of adaptation effect for second- than for first-order stimuli in observers with normal vision (Nishida, Ashida, & Sato, 1994; Whitaker et al., 1997). Also, in amblyopic observers, both the amblyopic and the non-amblyopic eyes showed deficits in detection sensitivity when compared with control eyes from observers with normal vision. This spatial loss is greater for second- than for first-order stimuli (Wong, Levi, & McGraw, 2001). This finding, along with the finding that one amblyope in the study showed only second-order, but no first-order deficits when compared with the normal control eyes, implies that neurons processing second-order information are substantially binocular.
Corroborative evidence from neurophysiology is consistent with our speculation that neurons processing second-order information are predominantly binocular. Mareschal and Baker (1998) suggested that neurons in cat area 18 (analogous to visual area V2 in primates) are responsible for processing second-order stimuli. The majority of neurons in primate V2 are found to be binocularly driven (Burkhalter & Van Essen, 1986; Zeki, 1978), supporting our speculation that neurons processing second-order information are substantially binocular.
4.4. No transfer of improvements across visual fields
Following training to identify contrast-defined letters at 10° in the inferior visual field, we found that the improvement did not transfer to another untrained eccentric retinal location—10° in the superior visual field. This lack of transfer of improvement from one region of the visual field to another suggests that the learning effect we obtained is retinotopic, and specific to the trained location. Recent functional magnetic resonance imaging studies in humans and primates have confirmed the retinotopic organization of early visual areas V1, V2 and V3 (Fize et al., 2003; Tootell et al., 1995, 1997). Given that V2 is commonly believed to be the neural site for processing second-order information, it is not surprising that the learning effect observed in this study is specific to the trained retinal location.
It is worth pointing out that the issue of whether perceptual learning transfers to untrained retinal locations is still controversial. A handful of studies showed a retinotopic learning effect, but there are also a number of studies that showed a generalization of learning to untrained retinal locations. The few studies that showed a retinotopic learning effect (i.e., no transfer of learning to an untrained retinal location) include Karni and Sagi (1991), Beard et al. (1995), Fahle, Edelman, and Poggio (1995) and Dill and Fahle (1997). Karni and Sagi (1991) trained their observers to discriminate simple texture patterns that consisted of three diagonal bars embedded within a background of horizontal bars. In both the studies of Beard et al. (1995) and Fahle et al. (1995), observers were trained on a Vernier discrimination task. No transfer of learning to an untrained retinal location in the same eye was found, although Beard et al. found a transfer of learning to an untrained retinal location in the untrained eye that corresponded to the same cortical hemisphere as the trained retinal location. Dill and Fahle (1997) trained their observers to identify dot-matrix patterns that were made up of 6 × 6 pixel arrays with pixels randomly assigned black or white. In contrast, Fiorentini and Berardi (1981, 1987) showed a transfer of learning of discriminating complex gratings to untrained retinal locations. Sireteanu and Rettenbach (2000) reported a transfer of learning of a visual search task from the trained upper/lower fields to the untrained right/left field, and vice versa. With respect to the task of letter identification, we previously showed that perceptual learning of identifying first-order letters transferred from upper to lower field, and vice versa (Chung et al., 2004). Apparently, whether or not learning transfers to an untrained retinal location may depend on the difficulty of the task, whether it is a “low-level” or a “high-level” task, and/or whether the untrained location is within the same or the contralateral eye.
4.5. No transfer of improvements across letter sizes
The improvements following training on identifying contrast-defined letters using a letter size of 4.2° did not transfer to the untrained letter size twice as large as that used for training. This size specificity may be related to the receptive field size of neurons processing second-order stimuli. Because letters were presented at 10° below the fixation target, the untrained letters (8.4°) extend further out from the 10° eccentricity location than the trained letters (4.2°). According to Mareschal and Baker (1998), the stream responsible for processing second-order stimuli involves cat area 18, analogous to visual area V2 in primates. Rosa (1997) reported that the receptive field size for neurons in primate V2, at an eccentricity of 10°, range between 1.5° and 5°. Therefore, although the trained letter size (4.2°) is compatible with the receptive field sizes of the V2 neurons found at 10° eccentricity, the untrained letter size (8.4°) is larger, and therefore may be processed by receptive fields that were not optimal for processing the 4.2° (trained) letters, or might be processed by larger receptive fields that are centered at an eccentricity greater than 10° (but extend into the region covered by the large stimulus). Both of these scenarios imply that the neurons processing the trained (4.2°) and untrained (8.4°) letter sizes are likely to be different, which might be responsible for the size specificity observed in this study.
5. Conclusion
We showed that when observers were trained on a second-order task (identifying contrast-defined letters in our case), their performance on the same second-order task improved. However, the learning is specific as it did not transfer to a first-order task (identifying luminance-defined letters in our case) or to a larger second-order letter. This learning shows an almost complete interocular transfer, suggesting a binocular site for processing the information, and retinotopic and size specificity, all of which are consistent with the properties of neurons in early visual area V2.
Acknowledgments
This study was supported by research Grants R01-EY12810 (S.T.L.C.) and R01-EY01728 (D.M.L.) from the National Eye Institute, National Institutes of Health.
Footnotes
The maximum stimulus ΔC that could be presented depended on the background noise contrast, such that the sum of the two could not exceed a value of 1. For example, the maximum stimulus ΔC that could be presented was 0.75 for a background noise contrast of 0.25. However, thresholds obtained could be higher than the maximum stimulus ΔC, because thresholds were determined (and thus could be extrapolated) from the psychometric function fit relating percent-correct performance with stimulus ΔC.
References
- Ahissar M, Hochstein S. Task difficulty and the specificity of perceptual learning. Nature. 1997;387:401–406. doi: 10.1038/387401a0. [DOI] [PubMed] [Google Scholar]
- Baker CL, Mareschal I. Processing of second-order stimuli in the visual cortex. Progress in Brain Research. 2001;134:171–191. doi: 10.1016/s0079-6123(01)34013-x. [DOI] [PubMed] [Google Scholar]
- Ball KK, Sekuler R. A specific and enduring improvement in visual motion discrimination. Science. 1982;218:697–698. doi: 10.1126/science.7134968. [DOI] [PubMed] [Google Scholar]
- Ball KK, Sekuler R. Direction-specific improvement in motion discrimination. Vision Research. 1987;27:953–965. doi: 10.1016/0042-6989(87)90011-3. [DOI] [PubMed] [Google Scholar]
- Beard BL, Levi DM, Reich LN. Perceptual learning in parafoveal vision. Vision Research. 1995;35:1679–1690. doi: 10.1016/0042-6989(94)00267-p. [DOI] [PubMed] [Google Scholar]
- Brainard DH. The psychophysics toolbox. Spatial Vision. 1997;10:433–436. [PubMed] [Google Scholar]
- Burkhalter A, Van Essen DC. Processing of color, form and disparity information in visual areas VP and V2 of ventral extrastriate cortex in the macaque monkey. Journal of Neuroscience. 1986;6:2327–2351. doi: 10.1523/JNEUROSCI.06-08-02327.1986. [DOI] [PMC free article] [PubMed] [Google Scholar]
- Chung STL, Legge GE, Tjan BS. Spatial-frequency characteristics of letter identification in central and peripheral vision. Vision Research. 2002;42:2137–2152. doi: 10.1016/s0042-6989(02)00092-5. [DOI] [PubMed] [Google Scholar]
- Chung STL, Legge GE, Cheung SH. Letter recognition and reading speed in peripheral vision benefit from perceptual learning. Vision Research. 2004;44:695–709. doi: 10.1016/j.visres.2003.09.028. [DOI] [PMC free article] [PubMed] [Google Scholar]
- Chung STL, Levi DM, Tjan BS. Learning letter identification in peripheral vision. Vision Research. 2005;45:1399–1412. doi: 10.1016/j.visres.2004.11.021. [DOI] [PMC free article] [PubMed] [Google Scholar]
- Dill M, Fahle M. The role of visual field position in pattern-discrimination learning. Proceedings of the Royal Society of London B. 1997;264:1031–1036. doi: 10.1098/rspb.1997.0142. [DOI] [PMC free article] [PubMed] [Google Scholar]
- Dosher BA, Lu ZL. Perceptual learning reflects external noise filtering and internal noise reduction through channel reweighting. Proceedings of the National Academy of Sciences of the United States of America. 1998;95:13988–13993. doi: 10.1073/pnas.95.23.13988. [DOI] [PMC free article] [PubMed] [Google Scholar]
- Dosher BA, Lu ZL. Mechanisms of perceptual learning. Vision Research. 1999;39:3197–3221. doi: 10.1016/s0042-6989(99)00059-0. [DOI] [PubMed] [Google Scholar]
- Dosher BA, Lu ZL. Perceptual learning in clear displays optimizes perceptual expertise: Learning the limiting process. Proceedings of the National Academy of Sciences of the United States of America. 2005;102:5286–5290. doi: 10.1073/pnas.0500492102. [DOI] [PMC free article] [PubMed] [Google Scholar]
- Dumoulin SO, Baker CL, Hess RF, Evans AC. Cortical specialization for processing first- and second-order motion. Cerebral Cortex. 2003;13:1375–1385. doi: 10.1093/cercor/bhg085. [DOI] [PubMed] [Google Scholar]
- Ellemberg D, Lavoie K, Lewis TL, Maurer D, Lepore F, Guillemot JP. Longer VEP latencies and slower reaction times to the onset of second-order motion than to the onset of first-order motion. Vision Research. 2003;43:651–658. doi: 10.1016/s0042-6989(03)00006-3. [DOI] [PubMed] [Google Scholar]
- Ellemberg D, Allen HA, Hess RF. Investigating local network interactions underlying first- and second-order processing. Vision Research. 2004;44:1787–1797. doi: 10.1016/j.visres.2004.02.012. [DOI] [PubMed] [Google Scholar]
- Fahle M. Perceptual learning: Specificity versus generalization. Current Opinion in Neurobiology. 2005;15:154–160. doi: 10.1016/j.conb.2005.03.010. [DOI] [PubMed] [Google Scholar]
- Fahle M, Edelman S. Long-term learning in Vernier acuity: Effects of stimulus orientation, range and of feedback. Vision Research. 1993;33:397–412. doi: 10.1016/0042-6989(93)90094-d. [DOI] [PubMed] [Google Scholar]
- Fahle M, Edelman S, Poggio T. Fast perceptual learning in hyperacuity. Vision Research. 1995;35:3003–3013. doi: 10.1016/0042-6989(95)00044-z. [DOI] [PubMed] [Google Scholar]
- Fine I, Jacobs RA. Comparing perceptual learning tasks: A review. Journal of Vision. 2002;2:190–203. doi: 10.1167/2.2.5. [DOI] [PubMed] [Google Scholar]
- Fiorentini A, Berardi N. Perceptual learning specific for orientation and spatial frequency. Nature. 1980;287:43–44. doi: 10.1038/287043a0. [DOI] [PubMed] [Google Scholar]
- Fiorentini A, Berardi N. Learning in grating waveform discrimination: Specificity for orientation and spatial frequency. Vision Research. 1981;21:1149–1158. doi: 10.1016/0042-6989(81)90017-1. [DOI] [PubMed] [Google Scholar]
- Fize D, Vanduffel W, Nelissen K, Denys K, Chef d’Hotel C, Faugeras O, et al. The retinotopic organization of primate dorsal V4 and surrounding areas: A functional magnetic resonance imaging study in awake monkeys. Journal of Neuroscience. 2003;13:7395–7406. doi: 10.1523/JNEUROSCI.23-19-07395.2003. [DOI] [PMC free article] [PubMed] [Google Scholar]
- Gold J, Bennett PS, Sekuler AB. Signal but not noise changes with perceptual learning. Nature. 1999;402:176–178. doi: 10.1038/46027. [DOI] [PubMed] [Google Scholar]
- Julesz B. Textons, the elements of texture perception, and their interactions. Nature. 1981;290:91–97. doi: 10.1038/290091a0. [DOI] [PubMed] [Google Scholar]
- Julesz B. Texton gradients: The texton theory revisited. Biological Cybernetics. 1986;54:245–251. doi: 10.1007/BF00318420. [DOI] [PubMed] [Google Scholar]
- Julesz B, Krose B. Visual texture perception. Features and spatial filters. Nature. 1988;333:302–303. doi: 10.1038/333302a0. [DOI] [PubMed] [Google Scholar]
- Karni A, Sagi D. Where practice makes perfect in texture discrimination: Evidence for primary visual cortex plasticity. Proceedings of the National Academy of Sciences of the United States of America. 1991;88:4966–4970. doi: 10.1073/pnas.88.11.4966. [DOI] [PMC free article] [PubMed] [Google Scholar]
- Karni A, Sagi D. The time course of learning a visual skill. Nature. 1993;365:250–252. doi: 10.1038/365250a0. [DOI] [PubMed] [Google Scholar]
- Leigh RJ, Zee DS. The neurology of eye movement. 3. New York: Oxford University Press; 1999. pp. 94–96. [Google Scholar]
- Li RW, Levi DM, Klein SA. Perceptual learning improves efficiency by re-tuning the decision ‘template’ for position discrimination. Nature Neuroscience. 2004;7:178–183. doi: 10.1038/nn1183. [DOI] [PubMed] [Google Scholar]
- Liu Z, Weinshall D. Mechanisms of generalization in perceptual learning. Vision Research. 2000;40:97–109. doi: 10.1016/s0042-6989(99)00140-6. [DOI] [PubMed] [Google Scholar]
- Lu ZL, Dosher BA. Perceptual learning retunes the perceptual template in foveal orientation identification. Journal of Vision. 2004;6:44–56. doi: 10.1167/4.1.5. [DOI] [PubMed] [Google Scholar]
- Majaj NJ, Pelli DG, Kurshan P, Palomares M. The role of spatial-frequency channels in letter identification. Vision Research. 2002;42:1165–1184. doi: 10.1016/s0042-6989(02)00045-7. [DOI] [PubMed] [Google Scholar]
- Mareschal I, Baker CL. A cortical locus for the processing of contrast-defined contours. Nature Neuroscience. 1998;1:150–154. doi: 10.1038/401. [DOI] [PubMed] [Google Scholar]
- McGraw PV, Levi DM, Whitaker D. Spatial characteristics of the second-order visual pathway revealed by positional adaptation. Nature Neuroscience. 1999;2:479–484. doi: 10.1038/8150. [DOI] [PubMed] [Google Scholar]
- McKee SP, Westheimer G. Improvement in Vernier acuity with practice. Perception & Psychophysics. 1978;24:258–262. doi: 10.3758/bf03206097. [DOI] [PubMed] [Google Scholar]
- Nishida S, Ashida H, Sato T. Complete interocular transfer of motion aftereffect with flickering test. Vision Research. 1994;34:2707–2716. doi: 10.1016/0042-6989(94)90227-5. [DOI] [PubMed] [Google Scholar]
- Oruc I, Landy MS, Pelli DG. Noise masking reveals channels for second-order letters. Vision Sciences Society Annual Meeting 2005 Abstract; 2005. [DOI] [PMC free article] [PubMed] [Google Scholar]
- Pelli DG. Uncertainty explains many aspects of visual contrast detection and discrimination. Journal of the Optical Society of America A. 1985;2:1508–1532. doi: 10.1364/josaa.2.001508. [DOI] [PubMed] [Google Scholar]
- Pelli DG. The videotoolbox software for visual psychophysics: Transforming numbers into movies. Spatial Vision. 1997;10:437–442. [PubMed] [Google Scholar]
- Pelli DG, Farell B. Why use noise? Journal of the Optical Society of America A. 1999;16:647–653. doi: 10.1364/josaa.16.000647. [DOI] [PubMed] [Google Scholar]
- Pelli DG, Zhang L. Accurate control of contrast on microcomputer displays. Vision Research. 1991;31:1337–1350. doi: 10.1016/0042-6989(91)90055-a. [DOI] [PubMed] [Google Scholar]
- Poggio T, Fahle M, Edelman S. Fast perceptual learning in visual hyperacuity. Science. 1992;256:1018–1021. doi: 10.1126/science.1589770. [DOI] [PubMed] [Google Scholar]
- Rosa M. Visuotopic organization of primate extrastriate cortex. In: Rockland KS, Kaas JH, Peters A, editors. Cerebral cortex: Extrastriate cortex in primates. Vol. 12. New York: Plenum Press; 1997. pp. 127–203. [Google Scholar]
- Saarinen J, Levi DM. Perceptual learning in Vernier acuity: What is learned? Vision Research. 1995;35:519–527. doi: 10.1016/0042-6989(94)00141-8. [DOI] [PubMed] [Google Scholar]
- Schofield AJ. What does second-order vision see in an image? Perception. 2000;29:1071–1086. doi: 10.1068/p2913. [DOI] [PubMed] [Google Scholar]
- Sireteanu R, Rettenbach R. Perceptual learning in visual search generalizes over tasks, locations, and eyes. Vision Research. 2000;40:2925–2949. doi: 10.1016/s0042-6989(00)00145-0. [DOI] [PubMed] [Google Scholar]
- Smith AT, Greenlee MW, Singh KD, Kraemer FM, Hennig J. The processing of first- and second-order motion in human visual cortex assessed by functional magnetic resonance imaging (fMRI) Journal of Neuroscience. 1998;18:3816–3830. doi: 10.1523/JNEUROSCI.18-10-03816.1998. [DOI] [PMC free article] [PubMed] [Google Scholar]
- Solomon JA, Pelli DG. The visual filter mediating letter identification. Nature. 1994;369:395–397. doi: 10.1038/369395a0. [DOI] [PubMed] [Google Scholar]
- Tootell RB, Reppas JB, Kwong KK, Malach R, Born RT, Brady TJ, et al. Functional analysis of human MT and related visual cortical areas using magnetic resonance imaging. Journal of Neuroscience. 1995;15:3215–3230. doi: 10.1523/JNEUROSCI.15-04-03215.1995. [DOI] [PMC free article] [PubMed] [Google Scholar]
- Tootell RB, Mandola JD, Hadjikhani NK, Ledden PJ, Liu AK, Reppas JB, et al. Functional analysis of V3A and related areas in human visual cortex. Journal of Neuroscience. 1997;17:7060–7078. doi: 10.1523/JNEUROSCI.17-18-07060.1997. [DOI] [PMC free article] [PubMed] [Google Scholar]
- Whitaker D, McGraw PV, Levi DM. The influence of adaptation on perceived visual location. Vision Research. 1997;37:2207–2216. doi: 10.1016/s0042-6989(97)00030-8. [DOI] [PubMed] [Google Scholar]
- Wong EH, Levi DM, McGraw PV. Is second-order spatial loss in amblyopia explained by the loss of first-order spatial input? Vision Research. 2001;41:2951–2960. doi: 10.1016/s0042-6989(01)00189-4. [DOI] [PubMed] [Google Scholar]
- Zeki SM. Uniformity and diversity of structure and function in rhesus monkey prestriate visual cortex. Journal of Physiology. 1978;277:273–290. doi: 10.1113/jphysiol.1978.sp012272. [DOI] [PMC free article] [PubMed] [Google Scholar]