Abstract
Objective
A deformable registration technique was developed and evaluated to track and quantify tumor response to radiofrequency ablation for patients with liver malignancies.
Materials and methods
The method uses the combined power of global and local alignment of pre- and post-treatment computed tomography image data sets. The strategy of the algorithm is to infer volumetric deformation based upon surface displacements using a linearly elastic finite element model (FEM). Using this framework, the major challenge for tracking tumor location is not the tissue mechanical properties for FEM modeling but rather the evaluation of boundary conditions. Three different methods were systematically investigated to automatically determine the boundary conditions defined by the correspondences on liver surfaces.
Results
Using both 2D synthetic phantoms and imaged 3D beef liver data we performed gold standard registration while measuring the accuracy of non-rigid deformation. The fact that the algorithms could support mean displacement error of tumor deformation up to 2 mm indicates that this technique may serve as a useful tool for surgical interventions. The method was further demonstrated and evaluated using consecutive imaging studies for three liver cancer patients.
Conclusion
The FEM-based surface registration technique provides accurate tracking and monitoring of tumor and surrounding tissue during the course of treatment and follow-up.
Keywords: Deformable registration, Finite element modeling, Radiofrequency ablation
Introduction
Hepatocellular carcinoma (HCC) is the most common primary malignant tumor of the liver. Several minimally invasive image-guided ablative therapies which utilize thermal energy sources such as lasers, microwaves, radiofrequency (RF) and high intensity focused ultrasound (HIFU) are rapidly emerging as alternatives for treatment of primary liver malignancies when liver transplantation or surgical resection is not suitable [1,2]. Possible advantages of ablative therapies over open surgery include excellent local tumor control, less recovery times, a reasonable cost with low morbidity and mortality rates.
Percutaneous radiofrequency ablation (RFA) is one of the most effective methods for treating patients with early stage HCC who present with a single tumor smaller than 5 cm or as many as three HCC lesions, each smaller than 3 cm [3]. Tumor ablation is carried out by heating tumors using radio-frequency (RF) energy delivered through an electrode needle that is electrically insulated along all but the distal 1–3 cm of the shaft. Heat is produced by ionic agitation surrounding the electrode as the current flows to the ground resulting in coagulation necrosis. The deposition of the energy in the tissue generates a dark thermal lesion often surrounded by a bright edematous rim. The RFA procedure is considered technically successful if the tumor and a safety margin of 5–10 mm of normal hepatic tissue are completely included in the ablation zone [4]. Localization of tumors using CT image guided techniques and pre- and post-procedural analysis of ablative margins is extremely challenging from both a clinical and technical perspective.
The liver is a highly deformable soft tissue organ. A significant amount of nonlinear motion or deformation occurs in the liver in response to changes in the patient’s position, respiratory motion, and surgical manipulations. The shape and the size of the tumor appearance also depends on the dynamics of the contrast-enhancing agent used during CT imaging. Contrast agents are administrated only once during the procedure and the intensity of the image may vary significantly between the arterial and the portal venous phases of the CT scan. The majority of liver tumors can only be clearly visualized during the 2-min immediately following contrast agent injection. The apparent boundaries of the tumor can often change dramatically during the course of this time due to variations in enhancement over time.
Proper positioning of electrode is difficult due to the fact that real-time imaging can not be sustained throughout the entire RFA procedure and multiple insertions may be required to locate the center of the lesion. When the tip of the needle reaches the interface between two different types of tissue (normal and tumor), further insertion tends to deform the tissue rather than piercing it. As an alternative to the CT, the use of real-time ultrasound monitoring of the margins of lesions is limited due to presence of microbubbles arising from evaporation of intracellular water introduced during RFA. Periodic follow-up imaging every 3–6 months has become common clinical practice to enable the detection and further treatment of residual tumor regions. Results of early clinical trials showed that complete tumor necrosis was achieved in 83% of HCC tumors with diameters less than 3 cm [5] but only in 29–47% of HCC tumors greater than 3.1 cm [6].
All of these limitations make the RFA procedure very sensitive to the initial placement of the needle. To meet the challenges of RFA we have developed a surface based non-rigid method for tracking tumors across pre- and post-treatment CT liver images using a finite element model (FEM) based deformable system. There have been many liver deformation studies reported in the literature, but few have been reported on tracking metastases and primary tumors in the liver. Charnoz et al. [7] registered the segmented vascular network of the liver for tracking tumor response to treatment. However, the blood vessel branch points were difficult to identify when different acquisition times are used. Also, registering the vascular system alone does not take into account any information regarding surface liver deformation. Carrillo et al. [8] used a rigid intensity-based algorithm to perform registration of MR images of the liver which were acquired both prior to thermal ablation and following treatment. The team reported an accuracy of approximately 3 mm.
Registration of deformable organs can not be accomplished using image-based information alone. To achieve improved accuracy, intrinsic mechanical properties of the constituent tissue must also be considered. As the level of computational power continues to grow, deformable registration coupled with finite element analysis is becoming a much more practical approach for medical imaging applications.
In this paper, we propose and evaluate a new way of estimating internal deformations of organs based on the deformations of their boundaries. The proposed framework has two steps: (1) align the mesh surfaces of the imaged liver, and (2) model the volumetric deformation of the structure using a linearly elastic finite element model (FEM) using the boundary conditions generated from surface registration. For the first step, we developed deform-ICP, a variant of Iterative Closest Point (ICP) algorithm, that runs at high speed, can work in both 2D and 3D, and provides competitive results with other state of the art methods (“Registration”).
Materials and methods
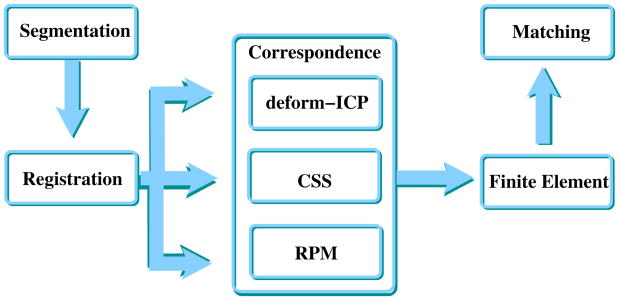
Figure 1 illustrates the main steps of the approach, which are described in detail in the following subsections of this manuscript. The flow of registration and FEM make the object of this article. To determine the proper correspondence from the registration process for use in the FEM, three different approaches were systematically investigated: Curvature Scale Space (CSS), deform-Iterative Closest Point (deform-ICP) and Robust Point Matching (RPM). The output of the proposed procedure is a match between scans of different visits so that past position of the tumor can be overlapped on the present scan of the liver to evaluate progress. The output of the matching phase is the input for the human expert.
Fig. 1.
Flow chart of the integrated process to quantify tumor motion based on boundary scans. Registration and correspondence can be implemented in several ways which have trade-offs with respect to CPU power required, applicability 2D versus 3D, and performance
Segmentation and 3D mesh generation
Volumetric images of the abdominal area were obtained with a General Electric LightSpeed CT scanner, using the following settings: 120 kV, 180 mA, standard reconstruction type, and high quality scan mode. The resolution of the CT was 512 × 512 × n, where n varied to accommodate the patient requirements. The voxel size was 0.93 mm × 0.93 mm × 1.25 mm which varied slightly among patients. The liver and tumor contour extractions were performed using MIPAV software package (http://mipav.cit.nih.gov) based on a 2D semi-automated active control model. The segmented contours were converted into volumetric binary masks and the tri-element surface mesh was extracted using the sub-voxel triangulation marching cubes algorithm [9]. Unfortunately, the resulting polygonal surfaces were too jagged and the number of triangles generated too large—approximately 800,000 triangles and 400,000 points. The surface simplification is really needed for further processing, in the finite element model (FEM), where the number of mesh vertices has a great impact on the size of matrices involved in the linear system. Using Visualization Toolkit (http://www.vtk.org), smoothing and decimation algorithms were developed in order to avoid staircase effects and to simplify the mesh. The mesh was smoothed using a windowed sinc function interpolation kernel [10] and the number of triangles in the mesh was reduced by applying a quadric decimation filter [11]. One of the advantages of this processing is that the resulting data sets require less storage space while maintaining an accurate description of the volume. The meshes were reduced to 10% of their original size. The combined effect of the smoothing and the decimation algorithms was to make the triangles of the mesh more evenly distributed while improving the appearance and maintaining an accurate mesh topology.
Based on the simplified triangulation of the surface, the goal was to generate suitable tetrahedral meshes for use in numerical simulation by finite element analysis. For FEM numerical simulation, mesh shape and size are important for computing the approximation error and determining convergence of the numerical methods. Using a public domain quality tetrahedral mesh generator TetGen (http://tetgen. berlios.de) the volume of liver along with the embedded tumor was decomposed into tetrahedral elements without changing the surface topology. TetGen performs efficient mesh refinement by inserting new vertices. The resulting tetrahedral mesh is a finite element mesh which is composed of properly shaped tetrahedrons. The resolution of the generated mesh is well adapted to the level of detail required, i.e., the mesh uses smaller tetrahedrons close to the boundary and gradually larger ones toward the interior. Figure 2 illustrates a fully connected tetrahedral mesh containing both the liver and the tumor.
Fig. 2.
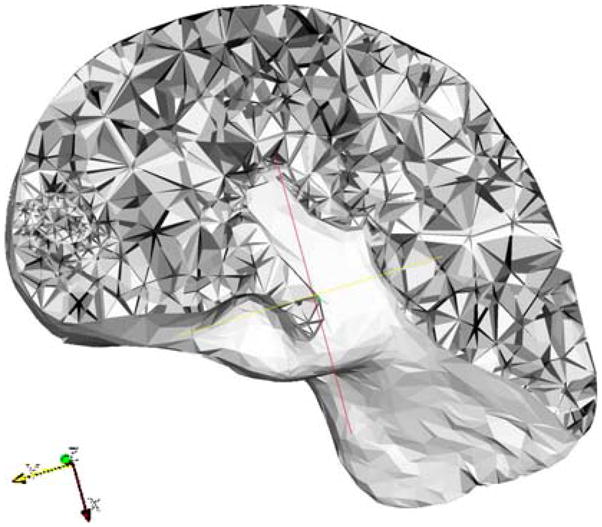
Cross section of a fully connected and consistent tetrahedral mesh for liver and tumor. As illustrated on the left side of the image, the tumor is described using higher resolution tetrahedral elements
Registration
The 3D registration problem can be divided into two parts: estimating the point correspondences and determining the transformation. Given two sets of 3D points: pre-treatment/data D = {d p } and post-treatment/model M = {mk } for each data point di ∈ D, it is necessary to find the index j of the corresponding point m j ∈ M then recover the transformation m j = di + f (di ) which aligns the corresponding points while minimizing an objective error function E (di, m j ). In our framework the process of tracking tumor location is coupled with finite element modeling wherein the boundary conditions are defined by the correspondence of liver boundary points of the 3D data sets acquired at consecutive patient visits.
For most surfaces registration strategies, closest point distances are used as initial estimates of the correspondence. The classical solution for point registration is the Iterative Closest Point (ICP) algorithm [12] where the binary point correspondences are based on a nearest neighbor heuristic. The left-hand panel of Fig. 3 shows the result of the ICP registration algorithm. Because of the nonlinear motion of the liver between consecutive studies, accurate surface registration can not be obtained when using rigid registration algorithms alone. The right-hand panel of Fig. 3 shows an example in which the tumor associated with the pre-treatment liver was erroneously registered beyond the surface limits of the post-treatment liver using rigid registration. For deformable organs, standard ICP is therefore not appropriate, so we look for alternative methods to achieve the registration and the correspondence.
Fig. 3.
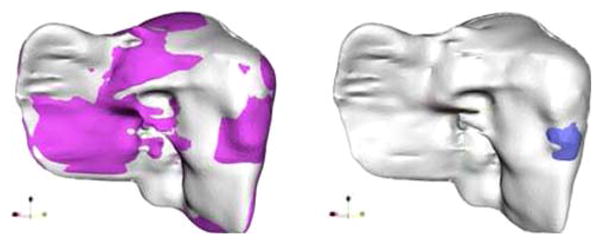
Left result of rigid ICP registration: light colored surface shows the post-treatment and dark colored rendering shows the liver prior to treatment. Right rigid registration techniques do not correct for surface deformation. The pre-treatment tumor (dark shade) is mapped outside of post-treatment liver (light gray)
To enforce properties such as one-to-one point correspondence we utilized the Robust Point Matching (RPM) algorithm [13]. The main idea of the RPM is to minimize a fuzzy assignment least squares energy function for the correspondence between two point sets. Using this method the point-to-point matching problem was solved by using a softassign method [14] and deterministic annealing [15]. The spatial mapping is solved in closed form, which permits its use for data of any dimension, 2D or 3D. While providing good correspondence, the disadvantage of RPM is that it is highly CPU intensive. Using the code made public by the authors, registration of livers with 2,400 points took 8.5 h on a Pentium 4 3.2 GHz, 2 GB RAM computer.
Another method is curvature scale space (CSS), first introduced by Mokhtarian and Macworth [16] as a new shape representation for planar curves. The curvature of a curve is defined as the derivative of the tangent angle to the curve. The basic idea behind CSS representation is to convolve a parametric representation of the curve with a Gaussian function, as the standard deviation of the Gaussian increases and to extract the curvature zero-crossing points from the resulting curves. The binary image called the curvature scale space image of the curve is obtained by displaying the resulting points in (u, σ) plane, where u is the normalized arc length and σ is the width of Gaussian kernel. Curvature scale space image representation is unique for each curve which retains the local information of the shape while being robust to noise, scale, and change of orientation. The correspondence between two curves is obtained by matching all the maxims of CSS contour plots which exceed a specific threshold. CSS also has good registration performance, but to our knowledge is only applicable for the 2D case.
Looking at these methods, it is clear that they cannot be used in an interactive fashion on 3D data of high resolution. But we can use them as comparison points in terms of performance (registration error). To address the issues, we propose a modified ICP-like registration based on a local motion function was applied for each point of interest. This method augments correspondence functions with surface properties by estimating non-rigid motion using surface normals. In the standard ICP algorithm, only 3D point coordinates are used to estimate the correspondence which results in a lack of interaction among neighboring points. Instead of assuming a trivial correspondence, the search for the closest points takes into account all the neighborhood points with a similar normal direction to that of the point of interest. The 3D point coordinates and normals are then placed together in 6D space and the squared error is computed over the neighborhood around the point of interest is minimized. Figure 4 illustrates this approach. If in the selection of the closest point only Euclidean distances are used, points a and b from the pre-treatment set will be erroneously associated with point C from the post-treatment set. However, the points a and A from the pre-treatment and corresponding post-treatment set have approximately similar normal directions. In such cases, more weight must be given to the normal component to allow the proper choice of the closest point a → A, and b → B. If we decompose the deformation into a series of small increments, the motion is estimated as a small displacement in the direction of corresponding points. At every increment the surface of the pre-treatment liver data set is deformed to map on the surface of the post-treatment liver data set, allowing all the points to move in the tangential direction. The optimal transformation is based on a closed-form solution in which singular value decomposition (SVD) is used [17]. The closed-form solution has the advantages of providing the best possible transformation in a single step and there is no need to find a good initial guess. The main advantage of the algorithm is that the estimation of deformation is accomplished in small incremental steps, and the motion is applied to the corresponding point set at each iteration.
Fig. 4.
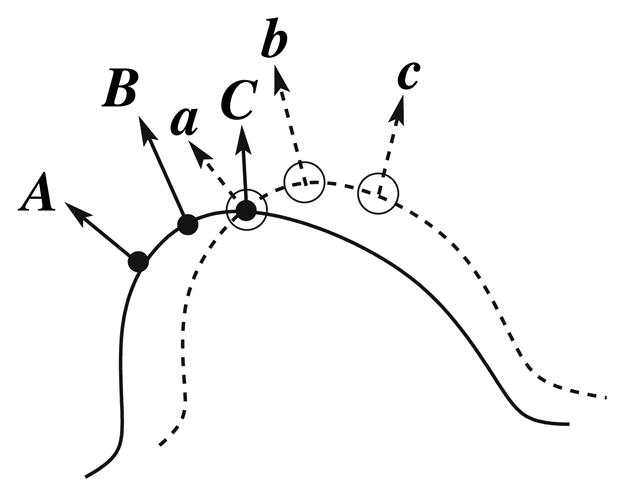
Basic idea for deform-ICP: in addition to the actual position of the point, each normal is used as well in order to improve the associations between the data and the model. In this example, points a and C would be associated by the standard ICP, whereas deform-ICP associates a and A, b and B, c and C
Finite element method (FEM)
The final step of our approach is to model the deformation of soft tissue based on linear elasticity theory. When the liver is treated as a purely elastic structure, at the equilibrium state, the strain energy stored as a result of tissue distortion is equivalent to the work of external forces applied to its surface.
The tissue deformation can be characterized in terms of the organ displacement where the local consistency of the motion is examined with respect to energy conservation. The minimum variation of total energy is described as:
where V represents the continuous domain of the volume of the deformable object, u = u(x, y, z) is the displacement vector, F which represents all the forces applied, σ is the Cauchy stress tensor and ε is the linear strain tensor. The relation between the stress and the displacement can be written as: ε = Bu. Assuming that liver is an elastic, non-compressible material which is isotropic and homogeneous, the stress σ and strain ε are related to each other via Hooke’s law σ = Dε. In this equation the components of the stiffness matrix D depends on two elasticity parameters, Young’s Modulus E and Poisson’s ratio ν. Finite element methods (FEM) are regarded as a versatile, effective and accurate technique for discretization of continuum models. In the FEM framework, the continuous domain V is decomposed into discrete finite elements, e, and joined at discrete node points i. The displacements of points inside the element are approximated as a linear combination of the components of the interpolation functions (shaped functions) applied to the node displacements ui [18]. The unknown node displacements ui are subjected to the imposed forces, elastic modeling and boundary constraints and are usually calculated by solving a set of linear or nonlinear algebraic equations. The relationship between the nodal forces, fi, and the nodal displacements, ui, which is minimized at every node, i, of each element, e, assuming that point loads are acting on the nodes. This can be expressed as:
with , wherein Ke is the element stiffness matrix and Ve volume of element. An equilibrium expression which corresponds to a minimum of Π is derived for each element, e, and then assembled in a large and sparse linear system K u = F, where K is the stiffness matrix numerically integrated over the object’s volume, V. u is the displacement vector of all nodes and F is a vector that combines all external forces and boundary conditions which describe the initial and the end states of the deformation process. The dimension of global stiffness matrix K is 3N x3N and the dimension of the global force vector F is 3N (N is the total number of nodes).
We used the volumetric tetrahedral mesh to approximate the transformation which is parametrized by the displacements at each vertex of the mesh. The precision of the approximation improves with the level of discretization and the degree of interpolation chosen, however this is achieved with a penalty in terms of computational time and memory size. We took advantage of tetrahedral volumetric mesh building. In this structure the finite element model is a two-node element. The resulting mesh structure is a consistent tetrahedral mesh that contains physically connected liver and tumor. We have chosen this two-node element because it simplifies the integration of the derivatives of the energy function and the stiffness matrix requires less intensive computation. Instead of using forces which are difficult to determine accurately, we impose boundary conditions to the liver object by assigning fixed values to the displacement vector, u. Boundary conditions are assigned to surface nodes based on changes in node positions during the course of the registration process. Material properties and boundary conditions are integrated over each element of the mesh and distributed over the mesh’s nodes thereby driving the deformation while it propagates throughout the entire volume. Free software package Z88 (http://www.z88.org) was used to generate the solution for the linear system of equations providing the displacements of all internal nodes of the volumetric mesh and allowing reliable tracking of each tumor’s deformation.
Results
Quantitative validation of the deformable registration algorithms has proved to be difficult because of the general lack of ground-truth information. The goal of this section is to evaluate the framework proposed with respect to registration performance of the three possible registration methods. For the evaluation we used a rubber phantom for the 2D case, and a beef liver for the 3D case, each containing 21 artificial markers. The four-step algorithm proposed in Fig. 1 was evaluated in order to predict the location of the markers in deformed data sets. The contours of the closed curve and the 21 markers were automatically segmented from all four representations and a one-to-one correspondence was assigned for the markers in the deformed states. In order to evaluate the proper correspondence in the applied boundary conditions the closed curves/surfaces were registered using three different algorithms: CSS, deform-ICP, RPM. The degree of deformation of both 2D and 3D data was characterized as the length of the displacement vectors of all i = 1, …, 21 markers. Based on the centroid locations of the destination markers in the image, , and the centroid locations of the markers in the deformed image, , the accuracy of the deformation model can be calculated by the vector length:
The effect of the material parameters is minimal because all the displacements derived from the results of the registration are essentially infinite forces applied on the surface of the liver.
2D rubber phantom
We created a rubber balloon model that was used to induce measurable deformations. The balloon was stretched over a circular ring with the diameter of 42 mm. A closed curve was drawn on the balloon in the shape of a 2D liver section and 21 points of 1 mm diameter were drawn inside the closed curve with approximately uniform distribution. The centroids of these points served as targets while performing multiple deformations of the curve to simulate consecutive visits. In all, the base model was deformed into three different representations that were generated by manually stretching the balloon at different locations. Figure 5 shows the balloon base model and one of the deformed states.
Fig. 5.
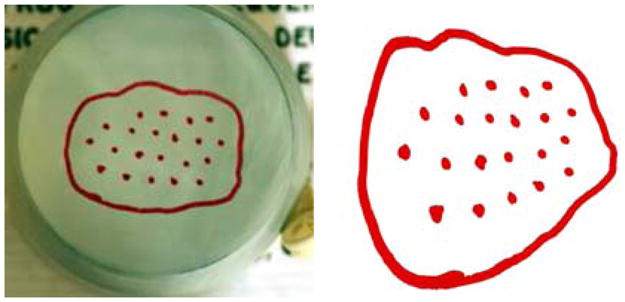
Left The base 2D rubber phantom model. Right One deformation scanned and segmented
The interior of the closed curve with all 21 markers were tessellated using the 2D finite element mesh generator and Delaunay triangulator, Triangle [19,20]. Figure 6 illustrates the two step procedure consisting of registration followed by the finite element analysis.
Fig. 6.
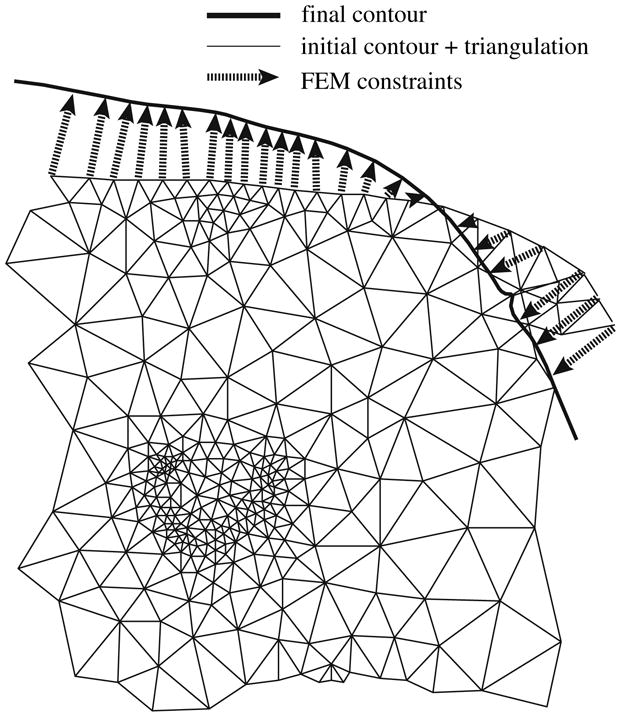
Boundary conditions and finite element triangulation. The triangulation uses a higher resolution wherever more detail is perceived. The FEM constraints are generated based on the correspondence produced by the registration algorithm
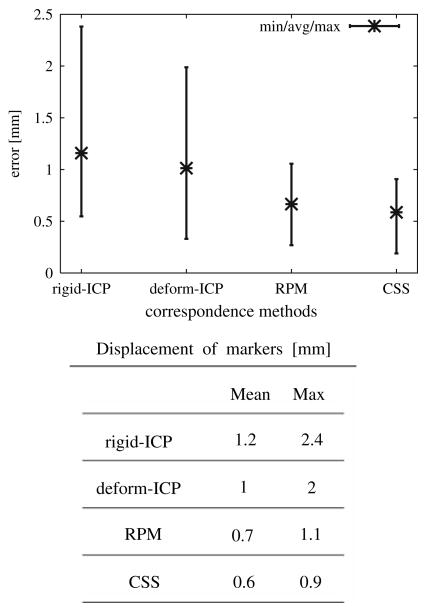
We generated deformation data sets for four different instances and twelve registration–deformation results were obtained, resulting in a distribution of displacement vectors. The minimum, average and maximum of displacement for all markers over all twelve results are shown in Fig. 7 and the mean value is reported in the corresponding table.
Fig. 7.
2D registration errors for different correspondence methods: deform-ICP, RPM and CSS algorithms
The average registration error using a finite element model was slightly higher when the deform-ICP algorithm was used (1 mm) compared as to when the Robust Point Matching (RPM) algorithm (0.7 mm) was utilized. This error is due to the lack of correspondence information provided in the calculation of the boundary conditions.
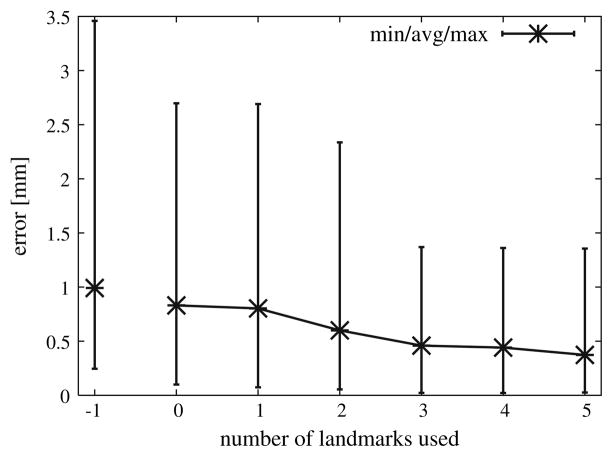
In order to further improve results we studied the manner in which radiologists have traditionally assessed consecutive imaging studies. Radiologists typically look for blood vessels as landmarks. In trying to implement an analogous procedure using a computer-based approach there were difficulties when trying to extract landmarks in the two images that actually corresponded to the same physical location. To evaluate the potential of this approach we have randomly selected a small number of representative landmark points in the original, non-deformed image, forcing them to be part of the FEM node structure and specifically tracked each of them in the deformed images. Figure 8 shows the deformation results using different numbers of landmark points in conjunction with the deform-ICP algorithm. The average registration–deformation error was about 0.5 mm when three landmark points were used. A maximum error of 0.7 and 0.3 mm was achieved when 1 and 5 landmark points were used.
Fig. 8.
Deform-ICP registration errors with different number of landmark points
By having the radiologist introduce a few landmark points the accuracy is improved while at the same time the computer-assisted tools add speed and reliability to the assessment which may make it practical for inclusion in the interventional and treatment planning process.
These results show that the proposed framework gives a low registration error, especially when the correspondence part of registration is better, as in the case of CSS. This error can be decreased further if additional correspondence points are indicated by a human expert.
3D beef liver phantom
The accuracy of the deformable model was subsequently evaluated using an excised beef liver. To simulate the internal abdominal environment and to minimize assumptions, the beef liver was embedded in agar gel to preserve its natural shape, as shown in Fig. 9 top. Using a syringe, 21 plastic beads were uniformly distributed throughout the liver. All the markers had the same spherical shape with diameter of 5 mm. We limited the number of these artificial markers because each insertion tears the tissue, and the shafts produced by the insertion affects the isotropic properties of the liver. Although feasible, in this paper we do not address the deformation when the liver is a compressible, anisotropic material.
Fig. 9.

3D beef liver phantom: top initial setup with a beef liver immersed in agar gel. Middle CT sections of two deformations with the same plastic bead marker indicated in each pose. Lower 3D markers uniformly distributed inside the meshed liver
The deformable registration component of our approach is based on changes in surface position, thus three deformation types characteristic for real patient acquisitions were simulated by compressing and tilting the container in which the liver is submerged. The beef liver data sets were scanned with General Electric LightSpeed CT scanner, and volumetric images were obtained using the following scanner settings: 120 kV, 180 mA, standard reconstruction type, and high quality scan mode producing a voxel size of 0.45 mm × 0.45 mm × 1 mm. Each CT scan consisted of 130 slices of 1-mm thick (512 × 512 pixels, 16 bits) exported in DICOM format. Figure 9 displays the original setup of the beef liver.
Using the 3D mesh generator TetGen, high quality tetrahedral meshes were created that conform to the input surface meshes so that some nodes of this model corresponded to the centroids of the markers. The displacement of all vertices in the volumetric mesh can be reconstructed by the linear force–deformation relation K u = F, for a stiffness matrix K with parameters Young’s modulus E and Poisson’s ratio ν. The liver is filled with blood which implies that ex vivo tissues should not behave like in vivo tissues. Appropriate linear elastic material parameter values for the beef liver were determined from the literature [21]. Most soft tissues are considered roughly non-compressible materials and are assumed to have a Poisson’s ration in the range of 0.45 < ν < 0.49. We assumed isotropic and linear material properties, with E describing the stiffness of the material of 11 kPa and ν describing the compressibility of the material of 0.47. Only the Poisson’s ratio was significant in our FEM analysis since only displacement boundary conditions were applied. Finite element analysis was performed in a single step on a Centrino Duo 1 GHz Dell with 1 GB of RAM with a average clock time of 10 s.
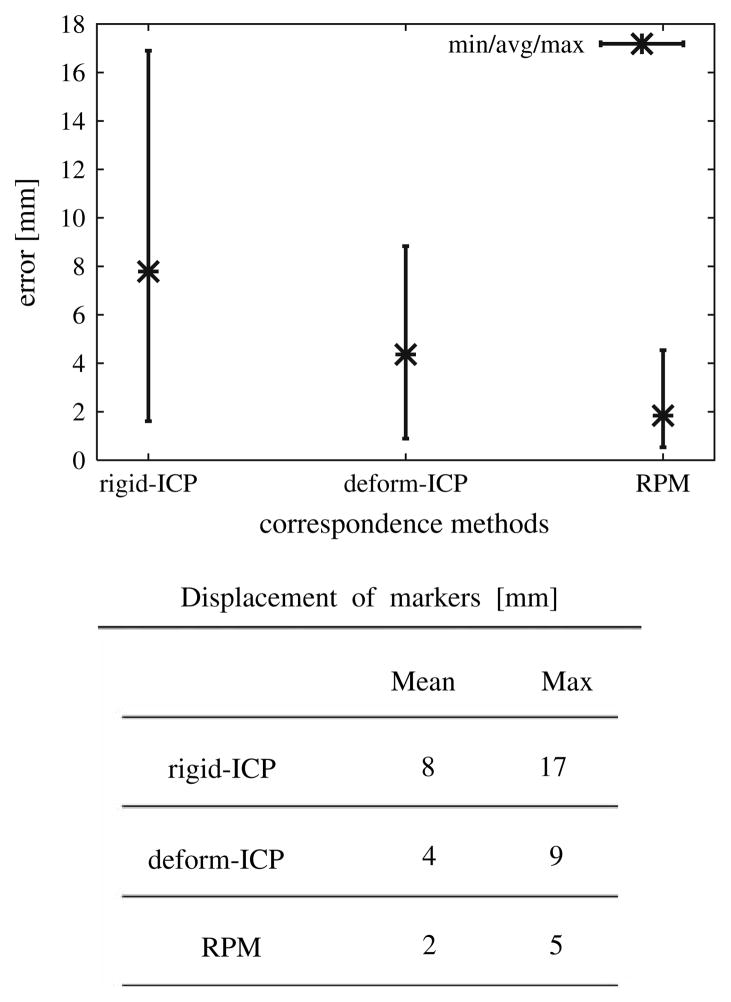
The accuracy of the deformation was shown to depend on the deviation of displacements and the boundary conditions generated by the surface registration. In order to evaluate the proper correspondence in the applied boundary conditions the liver’s surfaces were registered using deform-ICP and RPM algorithms. There were 4 instances of the deformation data sets and 12 registration–deformation results were obtained generating a distribution of displacement vectors. The minimum, average and maximum of displacement for all markers over all 12 results are shown in Fig. 10 and the mean value is reported in the corresponding table.
Fig. 10.
3D registration errors for different correspondence methods: deform-ICP and RPM
Experiments conducted have shown that the length of the error for the interior markers was smaller than that for the markers close to the surface. The deformation error is more sensitive for the markers located close to the surface, because the boundary conditions have a larger impact on the surface mesh nodes than on the interior ones.
The FEM model provided significant improvement over the rigid registration. Since the model is primarily driven by the surface data, the method by which boundary conditions are chosen for each node can play a significant role in the resulting accuracy. The maximum registration error using the deform-ICP algorithm was 9 mm, with a 20 s running time. At the expense of much larger pre-processing time (8.5 h) the error was 5 mm when the Robust RPM algorithm was used.
Patients study
The proposed model for deformable liver surface registration was subsequently used to predict the location of the tumors in data sets for three patients with hepatocellular carcinoma or with liver metastasis. In the future we plan to extend the number of patients. Before treatment planning each patient underwent intravenous contrast CT imaging. The liver was imaged during exhale breath-hold (reducing respiratory motion artifacts) before and after the injection of contrast including early and late hepatic arterial phases and the portal venous phases. All images used in our experiments were acquired during the portal venous phase because the important details for detecting and characterizing hypo-vascular lesions and metastatic deposits are apparent during this phase. At the time of radio-frequency ablation treatment another CT scan of the patient was obtained. A diagnostic contrast enhanced CT scan was obtained 1, 3 and 12 months after the completion of treatment. Volumetric images were obtained with General Electric LightSpeed CT scanner, using the following scanner settings: 120 kV, 180 mA, standard reconstruction type, and high quality scan mode. The resolution of the CT was 512 × 512 × n, where n varied to accommodate the patient extent and the voxel size was 0.93 mm × 0.93 mm × 1.25 mm slightly varying between patients. Figure 11 shows the pre-treatment, 1 and 3 month follow-up CT scans for one of the patients with tumor location determined by visual comparison. The rigid-ICP method predicted the tumor position outside of the liver, but with the deform-ICP method the actual position of the tumor is inside of the liver.
Fig. 11.

Top three CT scans for one of the patients treated by percutaneous radiofrequency ablation of HCC : the pre-treatment image, 1 month follow-up, and 3 months follow-up. Bottom Visual comparison of tumor location (black mesh); cross-section of the liver boundary registered with standard, rigid-ICP (light gray surface); cross-section of the liver boundary registered with deform-ICP (dark colored surface). Note that the tumor is registered outside the liver by the standard ICP method
Discussion and conclusions
The use of sequential follow-up CT scans which can reliable correlate the spatial position of tumor recurrences and progression are very important in interventional procedures. In order to accurately simulate soft-tissue changes, physically motivated deformable models are required and the parameters of the tissue must be well defined. While it is a challenging problem to obtain realistic material properties for all the tissues and structures that constitute the liver, we were able to design, develop and evaluate a reliable and efficient method for predicting changes in tumor location across pre-and post-treatment images using simple approximations. The method incorporates a non-rigid registration and a linearly elastic finite element model. Surface matching between pre- and post-treatment data was performed by the modified ICP algorithm and the results were input as boundary conditions for the finite element model to calculate the volumetric deformation. We demonstrated the convergence and robustness of this approach using both phantom data and actual patient data sets. While we are encouraged by the results of the feasibility experiments we acknowledge that we did not take into account the possible migration of the implanted markers. However, the obtained mean displacement errors of deformation results were very good and are in agreement with previous studies done for those cases. The registration accuracy and possible migration of internal fiducial 2 mm gold markers implanted into 4 patients with liver tumors and 14 patients with prostate cancer were investigated by Kitamura et al. [22]. Using a real-time tumor-tracking radiation therapy system, the relative relationship between the coordinates of the center of mass of the organs and those of the markers were calculated. Assuming that organs did not shrink, grow, or rotate the maximum standard deviation of migration error in each direction was estimated to be less than 2.5 mm for the liver and less than 2.0 mm for the prostate.
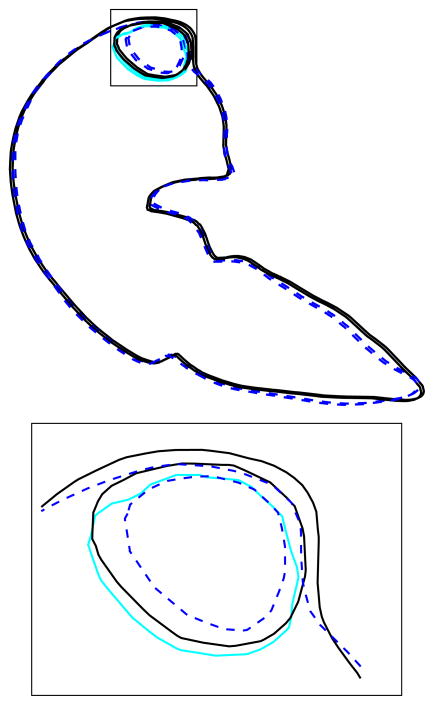
Deformable surface registration is obviously a sine qua non for interventional radiology. Careful planning of RFA interventions is of great importance in order to limit the damage of the healthy tissues. Using the current standard of care for CT screening this procedure is performed without the benefit and guidance of intravenous contrast. Under these conditions it is possible to identify the liver, but the tumor margins are often not visible. To evaluate the tumor extent the results of the deformable registration model can be easily integrated in the pre-treatment scan reading work flow performed by physicians. Through deformable registration the tumor position identified on the pre-treatment CT scan adapts and adjusts to the new position of the patient at the time of treatment. In addition to registration of pre-treatment images the tumor response and changes in the normal tissue are determined by registration of the post-treatment follow-up images. Figure 12 shows the accuracy of tumor deformation determined by visual comparison of the predicted and actual contour position in the pre and post-treatment data sets.
Fig. 12.
Cross-section FEM deformation result with enlarged detail: dark solid lines represents the pre-treatment, dotted lines represents post-treatment, and light gray (blue) the deformed pre-treatment tumor. A 3D view of the detail is presented in Fig. 11
The FEM deformable surface registration model can be applied to other soft, elastic organs such as lungs, prostate, colon or breast. Different organs have different material properties, such as Young’s modulus, and a realistic value is hard to be generated taken into account that this parameter can differ from patient to patient. In our FEM analysis the effect of elastic modulus is limited, and only Poisson ratio was used since the displacements of boundary conditions were assigned to the surface.
For future work, it is feasible to incorporate the liver’s surrounding organs in the registration process for better characterization of the boundary conditions. The liver’s deformation would then be driven by the internal forces between adjacent organs based on a volumetric mesh generated on the entire region of interest. We would like to extend this approach on different deformable organs such as the prostate or the colon. This new method can cope with extreme deformations when insertion of different devices is constrained by the nearby environment. We would also like to evaluate the use of Hausdorff distance for measurements between 3D models and mesh simplification [23]. Another possible direction to extend this work is to use a visco-elastic model that promises even higher fidelity than the current linear elastic model.
Advanced clinical applications have become a critical component of the work flow of radiologists as well as the team of other clinicians who interact with the image data sets. Our vision was to leverage our core expertise in detection and registration to deliver applications that can potentially meet the requirements for a range of interventional and surgical procedures.
Contributor Information
Gabriela Niculescu, Center for Biomedical Imaging and Informatics, The Cancer Institute of New Jersey, New Brunswick, NJ, USA, gnicules@eden.rutgers.edu.
John L. Nosher, Department of Radiology, UMDNJ-Robert Wood Johnson Medical School, New Brunswick, NJ, USA
M. D. Benjamin Schneider, Department of Radiology, UMDNJ-Robert Wood Johnson Medical School, New Brunswick, NJ, USA.
David J. Foran, Center for Biomedical Imaging and Informatics, The Cancer Institute of New Jersey, New Brunswick, NJ, USA Department of Radiology, UMDNJ-Robert Wood Johnson Medical School, New Brunswick, NJ, USA.
References
- 1.Hargreaves GM, Adam R, Bismuth H. Results after nonsurgical local treatment of primary liver malignancies. Langenbecks Arch Surg. 2000;385:185–193. doi: 10.1007/s004230050263. [DOI] [PubMed] [Google Scholar]
- 2.Goldberg SN, Dupuy DE. Image-guided radiofrequency tumor ablation: challenges and opportunities—part I and II. J Vasc Intervent Radiol. 2001;12:1021–1032. 1135–1148. doi: 10.1016/s1051-0443(07)61587-5. [DOI] [PubMed] [Google Scholar]
- 3.Bruix J, Sherman M, Llovet JM, et al. Clinical management of hepatocellular carcinoma. Conclusions of the Barcelona—2000 EASL conference, European Association for the Study of the Liver. J Hepatol. 2001;35:421–430. doi: 10.1016/s0168-8278(01)00130-1. [DOI] [PubMed] [Google Scholar]
- 4.Goldberg SN, Grassi CJ, Cardella JF, et al. Image-guided tumor ablation: standardization of terminology and reporting criteria. For the Society of Interventional Radiology Technology Assessment Committee and the International Working Group on Image-Guided Tumor Ablation. J Vasc Intervent Radiol. 2005;16:765–778. doi: 10.1097/01.RVI.0000170858.46668.65. [DOI] [PubMed] [Google Scholar]
- 5.Lu DS, Yu NC, Raman SS, et al. Radiofrequency ablation of hepatocellular carcinoma: treatment success as defined by histologic examination of the ex planted liver. Radiology. 2005;234:954–960. doi: 10.1148/radiol.2343040153. [DOI] [PubMed] [Google Scholar]
- 6.Livraghi T, Goldberg SN, et al. Hepatocellular carcinoma: radio-frequency ablation of medium and large lesions. Radiology. 2000;214(3):761–768. doi: 10.1148/radiology.214.3.r00mr02761. [DOI] [PubMed] [Google Scholar]
- 7.Charnoz A, Agnus V, Soler L. Portal vein registration for the follow-up of hepatic tumors. Medical image computing and computer-assisted interventions (MICCAI) Lecture notes in Computer Science. 2004;3216:878–886. doi: 10.1007/11566489_20. [DOI] [PubMed] [Google Scholar]
- 8.Carrillo A, Duerk JL, Lewin JS, Wilson DL. Semiautomatic 3-D image registration as applied to interventional MRI liver cancer treatment. IEEE Trans Med Imaging. 2000;19(3):175–185. doi: 10.1109/42.845176. [DOI] [PubMed] [Google Scholar]
- 9.Lorensen WE, Cline HE. Marching cubes: a high resolution 3D surface reconstruction algorithm. ACM Comput Graph. 1987;2(4):163–169. [Google Scholar]
- 10.Taubin G, Zhang T, Golub G. Optimal Surface Smoothing as Filter Design. Lecture notes in Computer Science; Proceedings of the fourth European Conference on Computer Vision; 1996. pp. 283–292. [Google Scholar]
- 11.Garland M, Heckbert PS. Surface Simplification Using Quadric Error Metrics. Proceedings of the 24th conference on computer graphics and interactive techniques (SIGGRAPH); 1997. pp. 209–216. [Google Scholar]
- 12.Besl PJ, McKey ND. A method for registration of 3D shapes. IEEE Trans PAMI. 1992;14(2):239–256. [Google Scholar]
- 13.Chui H, Rangarajan A. A new point matching algorithm for non-rigid registration. Comput Vis Image Underst. 2003;89(2–3):114–141. [Google Scholar]
- 14.Gold S, Rangarajan A, Lu CP, Pappu S, Mjolsness E. New algorithms for 2-D and 3-D point matching: pose estimation and correspondence. Pattern Recognit. 1998;31(8):1019–1031. [Google Scholar]
- 15.Geiger D, Girosi F. Parallel and deterministic algorithms from MRFs: surface reconstruction. IEEE Trans Pattern Anal Mach Intell. 1991;13(5):401–412. [Google Scholar]
- 16.Mokhtarian F, Macworth AK. A theory of multiscale, curvature-based shape representation for planar curves. IEEE Trans Pattern Anal Mach Intell. 1992;14(8):789–805. [Google Scholar]
- 17.Horn B, Hilden HM, Negahdaripour S. Closed form solution of absolute orientation using orthonormal matrices. J Opt Soc Am. 1998;5(7):1127–1135. [Google Scholar]
- 18.Zienkewickz OC, Taylor RL. The finite element method. 4. McGraw-Hill; New York: 1989. [Google Scholar]
- 19.Shewchuk JR. Triangle: engineering a 2D quality mesh generator and delaunay triangulator. Applied computational geometry: towards geometric engineering of Lecture Notes in Computer Science. 1996;1148:203–222. [Google Scholar]
- 20.Shewchuk JR. Delaunay refinement algorithms for triangular mesh generation. Comput Geom Theory Appl. 2002;22(1–3):21–74. [Google Scholar]
- 21.Fung YC. Biomechanics: mechanical properties of living tissues. Springer; New York: 1993. [Google Scholar]
- 22.Kitamura K, Shirato H, Shimizu S, et al. Registration accuracy and possible migration of internal fiducial gold marker implanted in prostate and liver treated with real-time tumor-tracking radiation therapy (RTRT) Radiother Oncol. 2002;62(3):275–281. doi: 10.1016/s0167-8140(02)00017-8. [DOI] [PubMed] [Google Scholar]
- 23.Aspert N, Santa-Cruz D, Ebrahimi T. Mesh: measuring error between surfaces using the Hausdorff distance. Proceedings of the IEEE International Conference on Multimedia and Expo (ICME); 2002. pp. 705–708. [Google Scholar]


