

Abstract
BACE1 activity is significantly increased in the brains of Alzheimer’s disease patients, potentially contributing to neurodegeneration. The voltage-gated sodium channel (Nav1) β2-subunit (β2), a type I membrane protein that covalently binds to Nav1 α-subunits, is a substrate for BACE1 and γ-secretase. Here, we find that BACE1-γ-secretase cleavages release the intracellular domain of β2, which increases mRNA and protein levels of the pore-forming Nav1.1 α-subunit in neuroblastoma cells. Similarly, endogenous β2 processing and Nav1.1 protein levels are elevated in brains of BACE1-transgenic mice and Alzheimer’s disease patients with high BACE1 levels. However, Nav1.1 is retained inside the cells and cell surface expression of the Nav1 α-subunits and sodium current densities are markedly reduced in both neuroblastoma cells and adult hippocampal neurons from BACE1-transgenic mice. BACE1, by cleaving β2, thus regulates Nav1 α-subunit levels and controls cell-surface sodium current densities. BACE1 inhibitors may normalize membrane excitability in Alzheimer’s disease patients with elevated BACE1 activity.
Alzheimer’s disease is the most common cause of dementia and is characterized by a progressive decline in memory and cognitive function. Patients in late stages often show severe personality changes and various neuropsychiatric symptoms, including depression, aggressiveness, agitation and generalized anxiety1. Epileptic and myoclonic seizures are common in early-onset Alzheimer’s disease with familial presenilin mutations, but are also found in late-onset forms of the disease2-5. The incidence of seizures in Alzheimer’s disease patients is at least six to tenfold higher than in the age-matched population3,4. Some of these functional disturbances may reflect altered neuronal excitability.
Voltage-gated sodium channels (Nav1) consist of a single pore-forming α-subunit and one or two β accessory subunits6. Ten α- and four β-subunits are currently known. The β1-4 subunits are type I single-transmembrane proteins with extracellular immunoglobulin and short intracellular carboxy-terminal domains that modify the localization, cell-surface expression and inactivation of sodium channels by interacting directly with the α-subunits6-8. β-subunits, especially β1and β2-subunits, also modulate cell adhesion and neurite outgrowth in vitro9,10. The β2-subunit has an important role in the regulation of sodium-channel density and function in neurons in vivo, and is required for normal action-potential generation and the control of membrane excitability11,12. A large fraction of α-sodium channel subunits exist as a free intracellular pool and are not attached to the β2-subunit. Disulfide linkage of α-subunits with the β2-subunit results in the appearance of sodium channels at the cell surface13. Although all the β-subunits are expressed in the central nervous system (CNS), only four of the ten α-subunits are primarily detected in the CNS. Among them, Nav1.1 and 1.3 are mainly localized to somatodendritic regions, whereas Nav1.2 and 1.6 are distributed to axons in a myelin-dependent manner14.
BACE1 (β-site APP cleaving enzyme 1, memapsin 2, Asp 1) or β-secretase cleaves the ectodomain of the Alzheimer-associated amyloid precursor protein (APP) to generate a membrane-bound C-terminal fragment (β-CTF) and secreted APPβ15,16. BACE1 activity and levels are significantly increased in the brains of Alzheimer’s disease patients, perhaps contributing to the progression of the disease by increasing Aβ production17-19. In addition, BACE1 seems to be essential for cognitive, emotional and synaptic functions by modulating membrane excitability in neurons20. Until recently, only a few BACE1 substrate proteins have been identified in vivo, in addition to the APP family of proteins21-23. We recently reported that the β2-subunit of Nav1 is sequentially cleaved by ADAM10, an ectodomain sheddase, and presenilin-γ-secretase24. Another group found that β2- and β4-subunits are cleaved by BACE1, followed by presenilin-γ-secretase processing25. However, only β2 seems to be a BACE1 substrate in the cortex25. These studies suggest that β2 may undergo processing via either the α-γ or β-γ cleavage pathways. In this study, we ask how elevated BACE1 activity affects β2 processing and Nav1 function.
RESULTS
β2 is a substrate for both BACE1 and an α-secretase-like activity
We first examined whether BACE1 and α-secretase activities could generate two C-terminal fragments (CTFs) of β2 corresponding to the individual cleavage products of β- and α- secretase. Two β2-CTFs were resolved in CHO cell lines stably expressing human β2 tagged with V5-His. These bands increased in intensity when the γ-secretase inhibitor DAPT was used to prevent degradation of the CTFs (Fig. 1a). Similar β2-CTFs were also identified in SH-SY5Y neuroblastoma cells that overexpress β2 (data not shown).
Figure 1.

BACE1-mediated cleavage of β2 generates β2-CTFβ and β2-ICD. Full-length β2 (β2 FL), β2-CTFs, and β2-ICD were detected by C-terminal V5 epitope staining. (a) 16% Tricine and 12% NuPage (MOPS running buffer) gel systems resolve β2-CTFs into two separate bands in CHO cells stably transfected with β2. (b) Western blot analysis of β2 processing in CHO cells with or without overexpressing BACE1. Elevated BACE1 results in increased β2-CTFβ generation, further potentiated by the γ-secretase inhibitor DAPT. Similar changes occur in APP β-CTF, but not in the levels of the control transferrin receptor. The shorter β2-CTFα is hard to detect due to the strong increase in β2-CTFβ levels. (c) Constitutive β2-ICD generation in B104 cells stably expressing BACE1, in addition to β2. (d) Cell-free generation of β2-CTFβ in membranes isolated from CHO cells expressing BACE1 and β2, blocked by the BACE inhibitor GL189 or pH 7.0. (e) Side-by-side comparison of BACE1- and α-secretase-mediated β2-CTF generation with the indicated treatments and BACE1 transfection in CHO cells expressing β2. (f) Schematic representation of APP-like processing of β2. Approximate positions of α-, β-, and γ-secretase-like cleavages in APP and β2, and terminology of respective C-terminal cleavage products are shown.
To identify the specific cleavage product of β2 produced by BACE1, a β2 cDNA construct was transiently transfected into CHO cells that did or did not express human BACE1. BACE1 expression alone increased the level of the longer β2-CTF, which was further enhanced by treatment with the γ-secretase inhibitor DAPT (Fig. 1b). As this fragment is likely to be the product of BACE1 cleavage, we named it ‘CTFβ’. The shorter fragment, the α-secretase cleavage product of β2 (see below), was termed ‘CTFα’. Levels of the transferrin receptor, which was used as a control, were unchanged by BACE1 expression. As expected, APP β-CTF (C99) levels were also increased (Fig. 1b). A similar overexpression of BACE1 did not affect the processing of nectin-1α, a control γ-secretase substrate protein (data not shown). These data both confirm a BACE1-mediated cleavage of β2 and identify CTFβ as the cleavage product.
Ectodomain cleavages of γ-secretase substrate proteins generate CTFs, which are further processed by γ-secretase to release soluble intracellular domains (ICDs)26. We therefore hypothesized that BACE1-mediated processing of β2 may increase the amount of substrate available for γ-secretase cleavage and release a soluble intracellular β2-ICD. ICDs in general, including β2-ICD, undergo fast turnover in the cytoplasm or nucleus, and are difficult to detect in intact cells or tissues. Supporting this, a β2-ICD with a relative molecular mass of 10,000 (Mr 10K) was detected in cells that coexpress high levels of β2 and BACE1, but not in control cells that only express β2 (Fig. 1c). The size of β2-ICD detected in the cells exactly matches that of the β2-ICD generated from a cell-free γ-secretase assay (see Supplementary Information, Fig. S1a). Elevated BACE1 activity leads to increased β2-CTFβ, and then β2-ICD, through sequential cleavage by γ-secretase. BACE1 activity regulates β2-ICD levels by controlling the amount of β2-CTFβ substrate available for γ-secretase cleavage.
BACE1 activity is characterized by an acidic pH preference in cell-free assays16. Therefore, BACE1-dependent β2 cleavage was studied in these assays at neutral or acidic pH. Membrane fractions from CHO cells stably expressing BACE1 and transiently expressing β2, when incubated at pH 4.5 but not at pH 7, generated a CTF, confirming the acidic pH preference of BACE1-mediated cleavage (Fig. 1d). This cleavage was completely blocked by the specific BACE1 inhibitor, GL189 (ref. 22). These experiments confirm that β2 is a substrate for BACE1 cleavage in a cell-free assay.
To confirm that the short and the long CTFs are differentially produced by either α- or β-secretase cleavage in CHO cells expressing β2, the activity of the two secretases was selectively modulated and the resulting fragments were resolved side-by-side (Fig. 1e). Treatment with 12-O-tetra-decanoylphorbol-13-acetate (TPA), an activator of α-secretase, induced the generation of CTFα and this was inhibited by the α-secretase inhibitor TAPI-1 (Fig. 1e and see Supplementary Information, Fig. S1c). In the presence of TAPI-1 and the γ-secretase inhibitor DAPT, CTFβ levels increased because DAPT prevents degradation of the fragment by γ-secretase, and overexpression of BACE1 increased CTFβ (Fig. 1e). These data confirm that the longer CTF is a product of BACE1, whereas the shorter is generated by α-secretase protease activity. The proteolytic processing of APP and β2 are remarkably similar (Fig. 1f).
β2-ICD regulates mRNA and protein levels of Nav1.1
We next investigated whether BACE1, γ-secretase, or β2-ICD modulate the pore-forming Nav1 α-subunit mRNA and protein levels. Among the four major Nav1 α-subunits expressed in the CNS, we focused on the neuronal α-subunit Nav1.1 because of its tight association with the β2 subunit, and high expression levels in adult human brains27-29. In addition, mutations in this α-subunit gene induce seizures30. For these experiments, B104 rat neuroblastoma cells that express functional Nav1s were used31.
Stable expression of BACE1 increased β2-CTF and Nav1.1 levels (Fig. 2a). To assess whether Nav1 α-subunit mRNA levels were affected by BACE1 expression, two sets of real-time RT-PCR primers were designed to amplify rat Nav1.1 (see Supplementary Information, Fig. S2a). Real-time RT-PCR analysis showed a close correlation between Nav1.1 mRNA and β2-CTF levels in clones with increasing BACE1 expression (Fig. 2b). In the cell line with the highest β2-CTF levels, Nav1.1 mRNA was induced ∼22-fold compared to parental cells without β2 expression. Nav1.1 is normally expressed at low levels in B104 neuroblastoma cells31. BACE1 expression did not consistently alter Nav1.3 and Nav1.6 α-subunit transcripts (data not shown). The increased amount of Nav1.1 mRNA was not simply due to BACE1 overexpression, because no increase in Nav1.1 mRNA levels was detected in B104 cells expressing BACE1 in the absence of β2 (Fig. 2b). These data suggest that elevated BACE1 activity, resulting in cleavage of β2, increases Nav1.1 mRNA and protein levels.
Figure 2.

BACE1 regulates Nav1.1 levels. (a) Representative western-blot analysis of β2-subunit and Nav1.1 α-subunit in B104 cells stably expressing β2 alone or together with BACE1. BACE1 overexpression elevates the levels of both β2-CTFs and Nav1.1. (b) Histograms showing the relative amounts of β2-CTF and Nav1.1 mRNA in stable B104 cell clones expressing β2 alone or together with BACE1. Nav1.1 mRNA levels were normalized to GAPDH levels. Relative changes in Nav1.1 mRNA were calculated by setting mRNA levels in B104 parental cells to 1. Similarly, β2-CTF levels in a B104 cell expressing only β2 was set to 1 to calculate the relative changes in β2-CTF (n = 3 for RT-PCR analysis). (c) Histogram showing relative mRNA levels of Nav1.1 and Nav1.3 in B104 cells stably expressing β2 treated with increasing concentrations of the BACE inhibitor dr9 (one way ANOVA followed by a post hoc Tukey’s test; the double asterisk indicates P <0.01; n = 3 for each condition) (d) Western blot analysis of Nav1.1 levels in B104 cells stably expressing β2 treated with increasing concentrations of dr9. (e) Endogenous β2-CTF levels in rat primary cortical neurons (DIV7). Full-length β2 and β2-CTFs were detected by both GW83 and GW93 antibodies, generated against the C-terminus of β2. The proteosomal inhibitor clasto-lactacystein β-lactone (lactacystein) was used for easy detection of endogenous β2-CTFs. The γ-secretase inhibitor DAPT elevated endogenous β2-CTF levels, whereas cotreatment with two different BACE inhibitors (dr9 and BACE inhibitor IV) specifically reduced β2-CTF and APP C99 levels. The asterisk indicates a nonspecific band. (f) Nav1.1 mRNA levels also decrease when rat primary neuronal cultures are treated with dr9 (one way ANOVA followed by a post hoc Tukey’s test, the asterisk indicates P <0.05 compared to DMSO treated cells; n = 3 for each condition). The error bars in all panels represent s.e.m.
To assess whether decreased BACE1 activity reduces Nav1.1 mRNA and protein levels, B104 cells stably expressing β2 were transfected with a cell-permeable BACE inhibitor OM009-DR9 (dr9)32. dr9 blocks generation of APP-β-CTF (C99), β2-CTF and β2-ICD in CHO cells expressing APP or β2, respectively (see Supplementary Information, Fig. S1b). Real-time RT-PCR analysis showed that dr9 treatment decreased Nav1.1 mRNA levels in a dose-dependent manner while slightly, but not significantly, increasing Nav1.3 mRNA levels (Fig. 2c). Western-blot analysis confirmed that decreased Nav1.1 mRNA resulted in reduced protein (Fig. 2d). ADAM10, an α-secretase, cleaves β2 and generates β2-ICD after γ-secretase cleavage of β2-CTFα24. The transient expression of ADAM10, similarly to BACE1, increased Nav1.1 mRNA levels, strengthening the suggestion that release of β2-ICD mediates the enhanced transcription of Nav1.1, as β2-ICD was released after both β- and α-secretase cleavages of β2 (see Supplementary Information, Fig. S2b). Finally, rat primary cortical neurons (DIV 7) were prepared to examine whether inhibition of endogenous BACE activity reduces Nav1.1 mRNA levels. In these experiments, we used GW83 and GW93 antibodies that recognize the C-terminus of β2, and which detect endogenous β2 in rat neuronal cells33. Treatment of the neuronal cultures with 1 μM dr9 or BACE inhibitor IV decreased endogenous β2-CTF levels (Fig. 2e). Conversely, a γ-secretase inhibitor, DAPT, increased β2-CTF (Fig. 2e). These data suggest that endogenous β2 undergoes sequential BACE1 and γ-secretase-mediated cleavages in primary cortical neurons. The BACE inhibitor dr9 also reduced Nav1.1 mRNA levels, by ∼40%, in a time-dependent manner (Fig. 2f). We conclude that endogenous BACE activity in primary neuronal modulates Nav1.1 levels.
As β2-ICD is a γ-secretase cleavage product, we predict that direct inhibition of γ-secretase activity would reduce Nav1.1 expression. As expected, the γ-secretase inhibitor DAPT increased β2-CTF levels in B104 cells stably expressing β2, indicating reduced β2-ICD generation (Fig. 3a). DAPT treatment also decreased endogenous Nav1 α-subunit protein levels, including Nav1.1 (Fig. 3a). DAPT treatment did not decrease Nav1 α-subunit protein levels in B104 parental cells (data not shown), and the low endogenous expression of β2 in B104 cells may account for this. DAPT reduced Nav1.1 mRNA levels by ∼60%, but not Nav1.3 mRNA levels (Fig. 3b). These data show that γ-secretase-mediated cleavage of β2 modulates Nav1.1 α-subunit levels and this regulation may occur at the transcriptional level.
Figure 3.
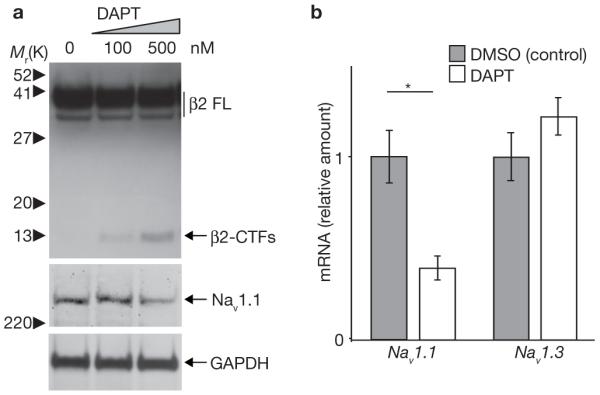
DAPT treatment decreases Nav1.1 protein and mRNA levels. (a) Western blot analysis of β2 and Nav1.1 α-subunit in B104 cells stably expressing β2, treated with increasing concentrations of DAPT for 48 h. (b) Histograms showing relative mRNA levels of Nav1.1 and Nav1.3 in B104 cells stably expressing β2 and treated with 500 nM DAPT or DMSO control for 48 h. (Student’s t-test, the asterisk indicates P <0.05; n = 3 for each condition; DMSO treated samples were regarded as 1 for comparison). The error bars represent s.e.m.
To directly determine whether β2-ICD regulates this α-subunit expression, we used a recombinant β2-ICD fragment24. Transient and stable expression of β2-ICD led to 2-3-fold increase in Nav1.1 mRNA levels in human neuroblastoma SH-SY5Y (Fig. 4a), suggesting that β2-ICD is involved in the transcriptional activation of this Nav1 α-subunit. Western-blot analysis also indicated an increase in Nav1.1 protein levels in SH-SY5Y cells in response to β2-ICD (Fig. 4b). Overexpression of β2-ICD also increased Nav1.1 levels 2-5-fold in B104 neuroblastoma cells (see Supplementary Information, Fig. S3a, b). Immunofluorescence staining showed that the majority of the stably overexpressed β2-ICD localized to the nuclei of SH-SY5Y cells (Fig. 4c). These data are compatible with a role of β2-ICD as a regulator of Nav1 α-subunit Nav1.1 expression. Fig. 4d summarizes the results that Nav1.1 levels correlate only with changes of β2-ICD, not with β2-CTF or full-length β2.
Figure 4.

Overexpression of recombinant β2-ICD increases Nav1.1 α-subunit levels. (a) Both transient and stable expression of recombinant β2-ICD elevates Nav1.1 mRNA levels in SH-SY5Y cells. Two constructs designed to express YFP or LacZ were used as negative controls for transient expression experiments. For statistical analysis, one way ANOVA followed by a post hoc Tukey’s test was used for transient expression experiment and a Student’s t-test was used for stable expression. The single asterisk indicates P <0.05 and the double asterisk indicates P <0.01 (n = 3 for each condition). The error bars represent s.e.m. (b) Western-blot analysis of Nav1.1 levels in parental SH-SY5Y cells and the same cells stably expressing β2-ICD. (c) Confocal images of stably overexpressed β2-ICDs. β2-ICD localizes to the nuclei of SH-SY5Y cells, stained with propidium iodide in mixed cultures of SH-SY5Y cells stably expressing various levels of β2-ICD immunostained with anti-V5 antibody. (d) Summary of the results shown in Figs 2, 3 and 4. Nav1.1 levels correlate with changes in β2-ICD, not β2-CTF or full-length β2.
Increased β2-CTF and Nav1.1 levels in BACE1-transgenic mice and brains of Alzheimer’s disease patients
We then asked whether endogenous β2 processing and Nav1 α-subunit levels are increased in the brains of transgenic mice expressing human BACE1 (ref. 34). BACE1-transgenic homozygote mice expressing human BACE1 at levels 7-, 10- and 20- fold (7X, 10X and 20X) above wild type, and heterozygote mice expressing ∼10X BACE1 were used for biochemical analysis. For statistical analysis, four BACE1 heterozygote mice (BACE1tg/-) and three wild-type control mice were used (Fig. 5c, d). Two different antibodies recognizing the C-terminus of β2 detected human and mouse β2-CTFs in CHO cells stably expressing human β2, in brains from BACE1-transgenic and control mice, and in a brain lysate from Alzheimer’s disease patients (see Supplementary Information, Fig. S4a-c). Endogenous β2-CTFs, detected by the same antibodies, were elevated in BACE1-transgenic mice compared to control wild-type brains, whereas full-length β2 levels decreased slightly (Fig. 5a). Nav1.1 protein and mRNA levels were also elevated in homozygote and heterozygote BACE1-trangenic mice, as shown by western blot and real-time RT-PCR analysis, respectively (Fig. 5a-d). In addition, a dose-dependent relationship was detected between BACE1 and Nav1.1 mRNA levels (Fig. 5d). Taken together, these in vivo data confirm the results obtained in the cell-based systems indicating that endogenous β2 is a substrate for BACE1-mediated cleavage, which in turn modulates Nav1 α-subunit levels.
Figure 5.

Endogenous β2-CTF and Nav1.1 levels increase in BACE1-transgenic mouse brains. (a) Western-blot analysis of full-length β2, β2-CTFs and Nav1.1 α-subunit in brains from two control mice (WT) and BACE1-transgenic mice (BACE1 Tg, 10 or 20-fold expression of BACE1 compared to wild-type). GW93 antibody was used to detect full-length β2 and an anti-β2 antibody was used to detect β2-CTF in mouse brains. (b) Relative Nav1.1 mRNA levels were quantified by real-time RT-PCR analysis. BACE1-Tg mice, which overexpress 10- or 20-fold BACE1, showed increased Nav1.1 mRNA levels compared to control mice of the same genetic background. The error bars of these samples represent the s.e.m. and are derived from one triplicate RT-PCR analysis. (c) Quantitative analysis of Nav1.1 protein levels in three control brains and four brains from heterozygote BACE1-transgenic mice (BACE1tg/-) expressing approximately tenfold BACE1 compared to control brains (Student’s t-test, the asterisk indicates P <0.05; n = 3 for each genotype). The error bars represent s.e.m. (d) Quantitative analysis of Nav1.1 mRNA levels in control and BACE1-transgenic brains expressing approximately tenfold BACE1 (BACE1tg/-) and 20-fold BACE1 (BACE1tg/tg). A Student’s t-test was used for statistical analysis. The asterisk indicates P <0.05 (n = 4 for BACE1tg/- and n = 3 for control mice). The error bars represent s.e.m. The sample marked # is derived from triplicate RT-PCR analysis.
Several studies have shown a significant increase in BACE1 activity in the brains of late-onset Alzheimer’s disease patients17-19. Our findings raise the possibility that β2 processing, similar to APP, may also be altered in the brains of Alzheimer’s disease patients, leading to an elevation in Nav1 α-subunit levels. Therefore, we assessed the levels of β2, β2-CTFs and Nav1 α-subunits in brain samples from Alzheimer’s disease patients previously characterized for BACE1 activity and levels19. Western-blot analysis revealed full-length β2 in 10 brain samples from Alzheimer’s disease patients with confirmed high BACE1 activity, and in 11 non-Alzheimer’s disease control samples, as well as a 10K band that was only highly increased in the Alzheimer’s disease samples (see Supplementary Information, Fig. S5a). This smaller band corresponds to the predicted size of the endogenous β2-CTF, as opposed to the 14K band observed in cells expressing β2-V5-His (see Supplementary Information, Fig. S4a-c). The β2-CTF levels were significantly elevated in brain samples obtained from Alzheimer’s disease patients compared to controls (see Supplementary Information, Fig. S5b; P <0.05, Student’s t-test). Furthermore, β2-CTF levels correlated with BACE1 levels (see Supplementary Information, Fig. S5c; P <0.01, Pearson’s correlation test). To determine whether the increased BACE1-mediated processing of β2 in the brains of Alzheimer’s disease patients results in altered Nav1 α-subunit expression, western blots of the brain samples were reprobed with anti-Nav1.1 antibodies. Nav.1.1 levels were increased in the brains of Alzheimer’s disease patients, loosely correlating with elevated β2-CTF levels (see Supplementary Information, Fig. S5a). Considering that Nav1.1 is neuron-specific and the number of neurons in the brains of Alzheimer’s disease patients is reduced due to neuronal death, the average threefold increase in Nav1.1 observed may reflect an even higher increase per neuron. Our data show that elevated levels of Nav1.1 are associated with elevated BACE1 activity in Alzheimer’s disease patients.
BACE1 expression reduces sodium-current densities in neuroblastoma cells and hippocampal neurons from BACE1-transgenic mice
In primary neuronal cultures, newly synthesized Nav1 α-subunits accumulate inside the cells and only a relatively small fraction of active channels reach the cell surface35. To determine whether the BACE1-mediated induction of Nav1.1 alters sodium-channel density or kinetics, total sodium currents were recorded by whole-cell voltage-clamp in B104 cells stably expressing β2 or β2 together with BACE1. Unexpectedly, overexpression of BACE1 significantly decreased sodium-current density compared to B104 cells transfected only with β2 (Fig. 6a).
Figure 6.

BACE1 overexpression reduces sodium-current density and surface levels of Nav1 α-subunits in B104 neuroblastoma cells and hippocampal neurons. (a) Representative Na+ current measurements from B104 cells stably expressing β2, or β2 + BACE1 (left). Peak sodium current was measured at 0 mV and normalized to cell capacitance to get current densities (middle). Current density levels decreased in cells overexpressing BACE1 (Student’s t-test, triple asterisk indicates P <0.0001; β2, n = 13; β2 + BACE1, n = 17). Mean conductance-voltage relationships and steady-state inactivation of sodium currents in B104 cells stably expressing β2 or β2 + BACE1 together are shown on the right. Data from individual experiments were fit with a Boltzmann relationship. (b) Representative sodium0current measurements from hippocampal neurons acutely-dissociated from BACE1-transgenic (BACE1 Tg) and wild-type control mice (left). Na+ current density levels decreased in hippocampal neurons from BACE1-transgenic mice compared to control mice (middle; Student’s t-test, triple asterisk indicates P <0.0001; BACE1 transgenic, n = 13 from three mice; WT, n = 14 from three mice). Mean conductance-voltage relationships and steady-state inactivation of sodium currents in hippocampal neurons from BACE1-transgenic and wild-type mice are shown on the right. (c) β2 cells, β2 + BACE1 clone 11 and β2 + BACE1 clone 28 were surface-biotinylated, captured, and analysed by western blot analysis using an anti-pan Nav1 α-subunit antibody. (d) Quantitative analysis of surface Nav1 α-subunit levels in β2 cells and β2 + BACE1 clone 11 (Student’s t-test, the asterisk indicates P <0.05; n = 3 for each cell type; the average surface level of Nav1 α-subunit in β2 cells is regarded as 1). (e) Surface-biotinylation of hippocampal slices acutely prepared from BACE1-transgenic and wild-type mice. Four matching slice pairs from similar locations of the brain were selected from BACE1-transgenic and wild-type mice, respectively (slice 1-4). Slices with same numbers are derived from similar brain sections of each mouse. Biotinylated surface Nav1.1 is captured and detected in hippocampal slices from both BACE1-transgenic and wild-type mice. (f) Quantitative analysis of surface Nav1.1 α-subunit levels in hippocampal slices from BACE1-transgenic and wild-type mice (Student’s t-test, asterisk indicates P <0.05; n = 4 for each genotype; the biotin-captured Nav1.1 α-subunit were normalized to total Nav1.1 α-subunit levels). (g) Punctate Nav1.1 staining largely colocalized with HSP70 proteins in immunofluorescence microscopy experiments. All error bars represent s.e.m.
Setting cut-off sodium currents at 20 pA, we found that all 13 cells with β2 expression alone exhibited robust sodium currents (Fig. 6a), with an average current density of 40.5 pA/pF (Fig. 6a). However, in the β2 + BACE expressing cells, 11 out of 17 cells (65%) had completely lost their sodium currents and measurable sodium currents were present in the remaining six cells (35%). The average current density in these six cells was 28 pA/pF, which is a 30% decrease compared to the β2-only cells. To calculate global mean current density for the β2 + BACE cells, the data from all 17 cells was averaged. Small variations in BACE1 expression levels amongst the stably transfected cells may explain why six of the 17 β2 + BACE cells partially retained sodium currents. A decrease in sodium-channel activity was also observed in another independent β2 and BACE1 coexpressing cell line (data not shown). However, no significant changes were found in the voltage dependence of channel activation and inactivation, suggesting that the decreased sodium-channel activity resulting from BACE1 expression was not caused by any changes in the kinetic properties of the sodium channels (Fig. 6a). This observation suggests that BACE1 cleavage of β2 does not induce a conformational change in the sodium channel α/β complex. Instead, we conclude that the elevated Nav1 α-subunit Nav1.1, resulting from β2 cleavage, is not translocated to the membrane, thus decreasing sodium-current density at the cell surface.
To determine whether elevated BACE1 levels decrease sodium current density in vivo, sodium currents were studied in acutely isolated hippocampal neurons from BACE1-transgenic and control wild-type mice. Using whole-cell voltage-clamp recordings, sodium-current densities were 50% lower in hippocampal neurons from BACE1-transgenic mice than control wild-type mice (Fig. 6b; P <0.001, t-test, n = 14 for BACE1-transgenic mice, n = 13 for wild-type mice). There was no difference in the voltage-dependence of activation and inactivation, and the slight shift in the voltage-dependence of activation was not significant (Fig. 6b). These data confirm that BACE1 regulates sodium-current density in adult neurons, as well as in B104 neuroblastoma cell lines, providing evidence that BACE1 regulates sodium-channel activity in vivo.
BACE1 expression in the cell lines used for the current density recordings (clone 11 and 28 in Fig. 2b) induced 3-5-fold increases in Nav1.1 mRNA and protein levels, respectively. To determine whether decreased sodium currents were the result of a failure of functional channels to reach the cell surface, total cell-surface proteins in the two BACE1-overexpressing cell lines were biotinylated, captured by Neutravidin beads and analysed by western blotting using an anti-pan Nav1 α-antibody. Although BACE1 expression slightly increased Nav1 α-subunit levels in the total lysate, surface Nav1 α-subunit levels decreased in these cells (Fig. 6c). Quantitative analysis showed a ∼73% decrease in surface Nav1 α subunit levels in B104 cells stably expressing β2 and BACE (clone 11) compared to cells expressing β2 alone (Fig. 6d; Student’s t-test, P <0.05, n = 3). To determine whether increased BACE1 activity also decreased surface expression of Nav1 α-subunit in hippocampal neurons, surface biotinylation studies were performed on hippocampal slices acutely prepared from BACE1-transgenic and wild-type mice according to previously described methods36. Four matching slice pairs from similar locations of the brain were selected from BACE1-transgenic and wild-type mice, respectively (Fig. 6e). Biotinylated surface Nav1.1 was captured and detected in the hippocampal slices from both BACE1-transgenic and wild-type mice, whereas an intracellular negative control protein, GAPDH, was not detected in the same conditions. Surface Nav1.1 expression was 51% lower in BACE1-transgenic mice compared to wild-type mice (Fig. 6f; Student’s t-test, P <0.05, n = 4). Finally, we attempted to identify the intracellular compartment where Nav1.1 protein accumulates in the BACE1 + β2 expressing cells. Confocal immunofluorescence microscopy revealed that Nav1.1 accumulates in a punctate intracellular compartment that costained with an antibody against heat shock protein 70 (HSP70), a stress-inducible chaperone protein (Fig. 6g). Addition of Nav1.1 antigenic peptide completely abolished this punctate staining (data not shown). This unusual punctate compartment did not costain with antibodies recognizing Golgi or endoplasmic recticulum compartments (data not shown). Decreased surface levels of Nav1 α-subunits in the BACE1-overexpressing cells are likely to reflect, in spite of an increase in Nav1.1, intracellular retention of Nav1 α. Interestingly, a decrease in 3H-saxitoxin binding and sodium-current density is observed in neuronal cells in β2-subunit knockout mice11. Taken together, these data indicate that cleavage of β2 in BACE1-overexpressing cells results in a major reduction in the transfer of the Nav1s to the membrane, and a consequent reduction in membrane excitability.
DISCUSSION
We confirm that the Nav1 β2-subunit is a substrate for BACE1 and γ-secretase cleavage, allowing release of a β2-ICD. β2-ICD in turn, increases Nav1.1 α-subunit mRNA and protein levels in cell-based assays. We also find elevated β2-CTF and Nav1 α-subunit levels in BACE1-transgenic mouse brains and in brain samples with high levels of BACE1 from Alzheimer’s disease. However, the increased Nav1.1 associated with the cleavage of β2 accumulates inside the cell, with a marked reduction in sodium-current density and cell-surface Nav1 α-subunit levels (Fig. 6).
Studies in β2 knockout mice show that absence of β2 leads to a large decrease in sodium-current density11,12. Similarly, we find that BACE1 expression decreases sodium current density in both β2-expressing neuroblastoma cells and hippocampal neurons from BACE1-transgenic mice, which indicates that the numbers of functional sodium channels on the cell surface are substantially reduced. The heart α-subunit, Nav1.5, accumulates in the endoplasmic reticulum when overexpressed in HEK294 cells or cardiac myocytes, although the mechanism is unknown37,38. Elevated levels of one specific α-subunit may cause retention of other functional channels in the secretory compartment or downregulation of other α-subunits. BACE1 may process β2 to prevent translocation of Nav1.1 to the cell surface or, alternatively, increased BACE1 activity at the cell surface may promote an enhanced turnover of functional channels. BACE1 overexpression in mice induces neurochemical changes, alterations in exploratory behaviour, learning deficits and neurodegenerative symptoms39,40. Recently, it has been reported that BACE1-knockout mice displayed hypomyelination in the central and peripheral nervous system, possibly through a decrease in neuregulin-1 processing23,41. These findings support multiple roles for BACE1 in regulating neuronal function, possibly through regulated processing of neuronal BACE1 substrate proteins like the β2 subunit.
Increased β2-subunit processing and altered Nav1 α-subunit levels in brains from Alzheimer’s disease patients suggests that Nav1 subcellular localization and activity may be altered by the disease. Mutations in sodium-channel subunits are linked to epilepsy, amongst other neurological problems, and both gain- and loss-of-function imbalances in sodium-channel function may lead to seizures42,43. Thus, the unusual processing of β2 in brains from Alzheimer’s disease patients may lead or contribute to epileptic symptoms. Generalized seizures frequently occur late in the course of Alzheimer’s disease, and patients with a younger age of dementia onset are particularly susceptible 4. The finding that BACE1 cleaves the β2-subunit, and that this ultimately decreases α-subunit trafficking to the membrane surface, suggests that BACE1 inhibitors, currently developed to reduce Aβ generation, may also be effective in the treatment of epileptic symptoms derived from abnormal neuronal activity in Alzheimer’s disease patients.
METHODS
Plasmids, transfection, reagents and primary neuronal cultures
Expression constructs encoding full-length human β2 and β2-ICD (SCN2B, gi:21361089) containing a C-terminal V5-His tag have been described previously24. Effectene (Qiagen, Valencia, CA) was routinely used for transfecting cell lines. DAPT, L-685, 458, GL189, BACE inhibitor IV and clasto-lactacystein β-lactone were purchased from Calbiochem (San Diego, CA). TAPI-1 was obtained from BIOMOL (Plymouth, PA) and TPA was from Sigma (St Louis, MO). Rat primary cortical neuronal cultures were prepared and maintained in neurobasal media (Gibco-BRL, Carlsbad, CA) supplemented with B27 and 0.5 mM l-glutamine, as previously described24. The neuronal cultures were maintained at 37 °C in a humidified 5% CO2 atmosphere for 7-13 days.
Western-blot analysis
Cell lysates were prepared by directly extracting cells in a buffer containing 10 mM Tris-HCl at pH 6.8, 1 mM EDTA, 150 mM NaCl, 0.25% NP-40, 1% Triton X-100, and a protease inhibitor cocktail (Roche, Basel, Switzerland), followed by centrifugation at 16,000g. Proteins (20-100 μg) were resolved on 4-12% gradient Bis-Tris gels, 12% Bis-Tris gels, or 16% Tricine gels (Invitrogen, Carlsbad, CA), depending on the individual experiment, as described. The blots were visualized by enhanced chemiluminescence (ECL). The images were captured by using BioMax film (Kodak, Rochester, NY) or VersaDoc imaging system (Biorad, Hercules, CA), and quantified using QuantityOne software (Biorad).
In vitro generation of β2-CTFβ and β2-ICD
Membrane preparation and in vitro generation of β2-CTFβ were performed as previously described16. P2 membrane fraction was prepared and resuspended in 20 mM sodium acetate buffer at pH 4.5 containing 5 mM EDTA, 250 nM DAPT and a protease inhibitor cocktail (Roche). In vitro β-cleavage experiments were performed by incubating the membrane fractions at 37 °C for 2 h in the presence or absence of the indicated amounts of GL189, a β-secretase inhibitor. For different pH conditions, an aliquot of resuspended membrane samples was mixed with 100 mM HEPES buffer at pH 7.4 (1:1 v/v). Membrane preparation and in vitro generation of β2-ICD were performed as previously described24.
Quantitative RT-PCR
Levels of sodium-channel genes were analysed by quantitative RT-PCR performed in a Light Cycler PCR system (Biorad) with SYBR Green PCR mix (Applied Biosystems, Foster City, CA). GAPDH mRNA levels were used as normalization control for all experiments.
Analysis of BACE1-transgenic and control mice brains
Brains of BACE1-transgenic and control littermate mice were obtained from V. Lee (University of Pennsylvania, Philadelphia, PA). The frozen brains were cut into half for protein and mRNA analysis. For protein analysis, brains were homogenized in 0.5 ml of disrupting buffer containing 10 mM Tris-HCl at pH 6.8, 1 mM EDTA, 150 mM NaCl and a protease inhibitor cocktail (Roche). Membrane fractions were separated by centrifugation at 100,000g for 1 h and extracted with lysis buffer containing 10 mM Tris-HCl at pH 6.8, 2% SDS, 1 mM EDTA, 150 mM NaCl, and a protease inhibitor cocktail. Proteins (90 μg) were resolved on 12% gradient Bis-Tris gels or 3-8% Tris-acetate gels.
Preparation of acutely dissociated hippocampal neurons
Hippocampal neurons from BACE1-trangenic and control mice (1-2-month old) were acutely isolated using standard procedures10. Mice were decapitated under isoflurane anaesthesia and brains were rapidly removed and iced. Slices (400 μm) were cut and transferred to a low-calcium buffer containing 15 mM HEPES at pH 7.4, 140 mM sodium isethionate, 2 mM KCl, 2 mM MgCl2, 0.1 mM CaCl2 and 23 mM glucose. Slices were incubated for 1-5 h in NaHCO3-buffered Earle’s Balanced Salt Solution (EBSS, Sigma) bubbled with 95% O2 and 5% CO2. CA1/2 regions of hippocampus were removed from the individual slices under a dissecting microscope, and placed in a treatment chamber containing protease type XIV (1.5 mg ml-1, Sigma). After 35-45 min enzyme treatment, the tissue was rinsed and dissociated mechanically, using a series of fire-polished Pasteur pipettes. The cell suspension was plated into a 35-mm tissue-culture dish (Corning, Corning, NY).
Electrophysiology
Whole-cell patch-clamp recordings were obtained using an Axopatch 200A amplifier and pClamp8 (Molecular Devices, Sunnyvale, CA). B104 cells and CA1/2 hippocampal neurons were plated on 35-mm culture dish for recording. All recordings were performed at room temperature. Fire polished patch pipettes were made from 1.5 mm borosilicate glass (WPI) using a Sutter P-97 puller (Sutter, Novato, CA) with ∼2-3 MΩ resistances. Signals were digitized at 10 kHz and filtered at 5 kHz. Capacity currents were cancelled and series resistance compensated by the prediction method (∼80%) and by the 10 μs lag feedback method (70-80%). Linear leakage currents were digitally subtracted online with P/4 routines. Bath solution was 10 mM HEPES at pH 7.4, 130 mM NaCl, 4 mM KCl, 2 mM CaCl2, 1 mM MgCl2, 0.1 mM CdCl2, 5 mM glucose, and 10 mM TEA-Cl. Internal solution 10 mM HEPES at pH 7.3, 130 mM CsCl, 10 mM NaCl, 2 mM TEA-Cl, 10 mM EGTA, 0.5 mM CaCl2, 1 mM MgCl2, 5 mM MgATP, 0.5 mM NaGTP, and 2 mM glucose. After establishing whole-cell configuration, cells were held at -70 mV. A -110 mV prepulse were applied for 180 msec to remove resting inactivation, followed by a series of depolarizing voltage commands from -70 to 80 mV in steps of 10 mV for 10 msec with 0.5 s interval. To determine the voltage dependence of channel activation, the sodium conductance (GNa) was calculated by dividing the peak current for each voltage step by the driving force (Vm-Vrev) then normalized to the peak conductance (Gmax) and plotted against Vm. Availability curves were generated from a double-pulse protocol consisting of one constant 30 ms pulse to 0 mV after 180-ms prepulses to voltages varying from -120 to 10 mV in steps of 10 mV. Peak sodium current during the test pulse was normalized and plotted versus prepulse. Data were fit by a Boltzmann relationship: G = Gmax / (1 + exp[(V1/2 - Vm)/k)), where V1/2 is the potential at which half of the channels are activated or inactivated and k is the slope factor (in mV). Peak currents at 0 mV were measured and averaged by cell capacitance for current density calculation (pA/pF).
Cell-surface biotinylation
For surface biotinylation of cultured cells, semi-confluent cells were washed three times with cold HBSS, and incubated with 1 ml HBSS containing 0.5 mg ml-1 sulpho-NHS-Biotin (Pierce, Rockford, IL) at 4 °C for 30 min. The reaction was stopped by adding 100 μM l-lysine. Then cells were extracted with a lysis buffer containing 10 mM Tris-HCl at pH 6.8, 1 mM EDTA, 150 mM NaCl, 0.2% SDS, 0.5% sodium deoxycholate, 1% Triton X-100 and protease inhibitors, followed by a spin at 16,000g. Biotinylated proteins were captured by Neutravidin beads (Pierce) at 4 °C overnight. Acute hippocampal slices were surface-biotinylated according to a previously described method36. The slices were prepared as described earlier and incubated with 100 μM sulpho-NHS-Biotin (Pierce) in EBSS bubbled with 95% O2 and 5% on ice for 80 min. The reaction was stopped by washing three-times with cold EBSS containing 100 μM l-lysine. Surface Nav1 α-subunits were detected by western-blot analysis.
Statistical analyses
All statistical analyses were performed using a two-tailed Student’s t-test or one-way ANOVA followed by a post hoc Tukey’s test. Error bars represented in graphs denote the s.e.m.
Supplementary Material
Figure 7.
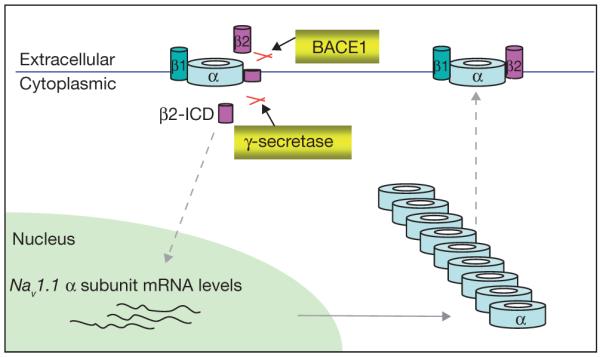
Schematic representation showing BACE1-mediated regulation of Nav1. BACE1, followed by PS1-γ-secretase, cleavage promotes release of β2-ICD. β2-ICD, in turn, increases Nav1.1 α-subunit mRNA and protein levels. Elevated Nav1.1 accumulates inside cells while cell-surface Nav1 α-subunit levels are largely reduced.
ACKNOWLEDGEMENTS
We thank S. Lichtenthaler (Ludwig-Maximilians-Universität, Germany) for the human Alzheimer’s disease ADAM10 construct, H. Federoff (University of Rochester) for the nectin-1 C-terminal antibody, A. Saunders (Drexel University) for the human BACE1 construct, J. Tang (University of Oklahoma) for the dr9 inhibitor, S. Tate (GlaxoSmithKline), and C. Plumpton (GlaxoSmithKline) for sodium channel antibodies. We would also like to thank L. Isom (University of Michigan) and R. E. Tanzi (Massachusetts General Hospital) for their helpful suggestions. This work is supported by grants from the National Institutes of Health, the National Institute of Aging and the John Douglas French Alzheimer’s Foundation.
Footnotes
COMPETING FINANCIAL INTERESTS
The authors declare no competing financial interests.
References
- 1.Assal F, Cummings JL. Neuropsychiatric symptoms in the dementias. Curr. Opin. Neurol. 2002;15:445–450. doi: 10.1097/00019052-200208000-00007. [DOI] [PubMed] [Google Scholar]
- 2.Mendez M, Lim G. Seizures in elderly patients with dementia: epidemiology and management. Drugs Aging. 2003;20:791–803. doi: 10.2165/00002512-200320110-00001. [DOI] [PubMed] [Google Scholar]
- 3.Hesdorffer DC, Hauser WA, Annegers JF, Kokmen E, Rocca WA. Dementia and adult-onset unprovoked seizures. Neurology. 1996;46:727–730. doi: 10.1212/wnl.46.3.727. [DOI] [PubMed] [Google Scholar]
- 4.Hauser WA, Morris ML, Heston LL, Anderson VE. Seizures and myoclonus in patients with Alzheimer’s disease. Neurology. 1986;36:1226–1230. doi: 10.1212/wnl.36.9.1226. [DOI] [PubMed] [Google Scholar]
- 5.Larner AJ, Doran M. Clinical phenotypic heterogeneity of Alzheimer’s disease associated with mutations of the presenilin-1 gene. J. Neurol. 2006;253:139–158. doi: 10.1007/s00415-005-0019-5. [DOI] [PubMed] [Google Scholar]
- 6.Isom LL. Sodium channel β subunits: anything but auxiliary. Neuroscientist. 2001;7:42–54. doi: 10.1177/107385840100700108. [DOI] [PubMed] [Google Scholar]
- 7.Catterall WA. Molecular mechanisms of gating and drug block of sodium channels. Novartis Found. Symp. 2002;241:206–18. [PubMed] [Google Scholar]
- 8.Catterall WA. From ionic currents to molecular mechanisms: the structure and function of voltage-gated sodium channels. Neuron. 2000;26:13–25. doi: 10.1016/s0896-6273(00)81133-2. [DOI] [PubMed] [Google Scholar]
- 9.Malhotra JD, Kazen-Gillespie K, Hortsch M, Isom LL. Sodium channel β subunits mediate homophilic cell adhesion and recruit ankyrin to points of cell-cell contact. J. Biol. Chem. 2000;275:11383–11388. doi: 10.1074/jbc.275.15.11383. [DOI] [PubMed] [Google Scholar]
- 10.Davis TH, Chen C, Isom LL. Sodium channel β 1 subunits promote neurite outgrowth in cerebellar granule neurons. J. Biol. Chem. 2004;279:51424–51432. doi: 10.1074/jbc.M410830200. [DOI] [PubMed] [Google Scholar]
- 11.Chen C, et al. Reduced sodium channel density, altered voltage dependence of inactivation, and increased susceptibility to seizures in mice lacking sodium channel β2-subunits. Proc. Natl Acad. Sci. USA. 2002;99:17072–17077. doi: 10.1073/pnas.212638099. [DOI] [PMC free article] [PubMed] [Google Scholar]
- 12.Lopez-Santiago LF, et al. Sodium channel β2 subunits regulate tetrodotoxin-sensitive sodium channels in small dorsal root ganglion neurons and modulate the response to pain. J. Neurosci. 2006;26:7984–7994. doi: 10.1523/JNEUROSCI.2211-06.2006. [DOI] [PMC free article] [PubMed] [Google Scholar]
- 13.Catterall WA. Molecular properties of voltage-sensitive sodium channels. Annu. Rev. Biochem. 1986;55:953–985. doi: 10.1146/annurev.bi.55.070186.004513. [DOI] [PubMed] [Google Scholar]
- 14.Lai HC, Jan LY. The distribution and targeting of neuronal voltage-gated ion channels. Nature Rev. Neurosci. 2006;7:548–562. doi: 10.1038/nrn1938. [DOI] [PubMed] [Google Scholar]
- 15.Vassar R, et al. β-secretase cleavage of Alzheimer’s amyloid precursor protein by the transmembrane aspartic protease BACE. Science. 1999;286:735–741. doi: 10.1126/science.286.5440.735. [DOI] [PubMed] [Google Scholar]
- 16.Sinha S, et al. Purification and cloning of amyloid precursor protein β-secretase from human brain. Nature. 1999;402:537–540. doi: 10.1038/990114. [DOI] [PubMed] [Google Scholar]
- 17.Fukumoto H, Cheung BS, Hyman BT, Irizarry MC. β-Secretase protein and activity are increased in the neocortex in Alzheimer disease. Arch. Neurol. 2002;59:1381–1389. doi: 10.1001/archneur.59.9.1381. [DOI] [PubMed] [Google Scholar]
- 18.Tyler SJ, Dawbarn D, Wilcock GK, Allen SJ. α- and β-secretase: profound changes in Alzheimer’s disease. Biochem. Biophys. Res. Commun. 2002;299:373–376. doi: 10.1016/s0006-291x(02)02635-9. [DOI] [PubMed] [Google Scholar]
- 19.Yang LB, et al. Elevated β-secretase expression and enzymatic activity detected in sporadic Alzheimer’s disease. Nature Med. 2003;9:3–4. doi: 10.1038/nm0103-3. [DOI] [PubMed] [Google Scholar]
- 20.Laird FM, et al. BACE1, a major determinant of selective vulnerability of the brain to amyloid-β amyloidogenesis, is essential for cognitive, emotional, and synaptic functions. J. Neurosci. 2005;25:11693–11709. doi: 10.1523/JNEUROSCI.2766-05.2005. [DOI] [PMC free article] [PubMed] [Google Scholar]
- 21.Kitazume S, et al. Characterization of α 2,6-sialyltransferase cleavage by Alzheimer’s β-secretase (BACE1) J. Biol. Chem. 2003;278:14865–14871. doi: 10.1074/jbc.M206262200. [DOI] [PubMed] [Google Scholar]
- 22.Lichtenthaler SF, et al. The cell adhesion protein P-selectin glycoprotein ligand-1 is a substrate for the aspartyl protease BACE1. J. Biol. Chem. 2003;278:48713–48719. doi: 10.1074/jbc.M303861200. [DOI] [PubMed] [Google Scholar]
- 23.Willem M, et al. Control of peripheral nerve myelination by the β-secretase BACE1. Science. 2006;314:664–666. doi: 10.1126/science.1132341. [DOI] [PubMed] [Google Scholar]
- 24.Kim DY, Ingano LA, Carey BW, Pettingell WH, Kovacs DM. Presenilin/γ-secretase-mediated cleavage of the voltage-gated sodium channel β2-subunit regulates cell adhesion and migration. J. Biol. Chem. 2005;280:23251–23261. doi: 10.1074/jbc.M412938200. [DOI] [PubMed] [Google Scholar]
- 25.Wong HK, et al. β subunits of voltage-gated sodium channels are novel substrates of β-site amyloid precursor protein-cleaving enzyme (BACE1) and γ-secretase. J. Biol. Chem. 2005;280:23009–23017. doi: 10.1074/jbc.M414648200. [DOI] [PubMed] [Google Scholar]
- 26.Koo EH, Kopan R. Potential role of presenilin-regulated signaling pathways in sporadic neurodegeneration. Nature Med. 2004;10:S26–S33. doi: 10.1038/nm1065. [DOI] [PubMed] [Google Scholar]
- 27.Gong B, Rhodes KJ, Bekele-Arcuri Z, Trimmer JS. Type I and type II Na(+) channel α-subunit polypeptides exhibit distinct spatial and temporal patterning, and association with auxiliary subunits in rat brain. J. Comp. Neurol. 1999;412:342–352. [PubMed] [Google Scholar]
- 28.Whitaker WR, et al. Distribution of voltage-gated sodium channel α-subunit and β-subunit mRNAs in human hippocampal formation, cortex, and cerebellum. J. Comp. Neurol. 2000;422:123–139. doi: 10.1002/(sici)1096-9861(20000619)422:1<123::aid-cne8>3.0.co;2-x. [DOI] [PubMed] [Google Scholar]
- 29.Whitaker WR, et al. Changes in the mRNAs encoding voltage-gated sodium channel types II and III in human epileptic hippocampus. Neuroscience. 2001;106:275–285. doi: 10.1016/s0306-4522(01)00212-3. [DOI] [PubMed] [Google Scholar]
- 30.Meisler MH, Kearney J, Ottman R, Escayg A. Identification of epilepsy genes in human and mouse. Annu. Rev. Genet. 2001;35:567–588. doi: 10.1146/annurev.genet.35.102401.091142. [DOI] [PMC free article] [PubMed] [Google Scholar]
- 31.Dib-Hajj SD, Hinson AW, Black JA, Waxman SG. Sodium channel mRNA in the B104 neuroblastoma cell line. FEBS Lett. 1996;384:78–82. doi: 10.1016/0014-5793(96)00273-6. [DOI] [PubMed] [Google Scholar]
- 32.Chang WP, et al. In vivo inhibition of Abeta production by memapsin 2 (β-secretase) inhibitors. J. Neurochem. 2004;89:1409–1416. doi: 10.1111/j.1471-4159.2004.02452.x. [DOI] [PubMed] [Google Scholar]
- 33.Pertin M, et al. Upregulation of the voltage-gated sodium channel β2 subunit in neuropathic pain models: characterization of expression in injured and non-injured primary sensory neurons. J. Neurosci. 2005;25:10970–10980. doi: 10.1523/JNEUROSCI.3066-05.2005. [DOI] [PMC free article] [PubMed] [Google Scholar]
- 34.Lee EB, et al. BACE overexpression alters the subcellular processing of APP and inhibits Abeta deposition in vivo. J. Cell Biol. 2005;168:291–302. doi: 10.1083/jcb.200407070. [DOI] [PMC free article] [PubMed] [Google Scholar]
- 35.Schmidt JW, Catterall WA. Biosynthesis and processing of the α subunit of the voltage-sensitive sodium channel in rat brain neurons. Cell. 1986;46:437–444. doi: 10.1016/0092-8674(86)90664-1. [DOI] [PubMed] [Google Scholar]
- 36.Thomas-Crusells J, Vieira A, Saarma M, Rivera C. A novel method for monitoring surface membrane trafficking on hippocampal acute slice preparation. J. Neurosci. Methods. 2003;125:159–166. doi: 10.1016/s0165-0270(03)00050-5. [DOI] [PubMed] [Google Scholar]
- 37.Zimmer T, Benndorf K. The human heart and rat brain IIA Na+ channels interact with different molecular regions of the β1 subunit. J. Gen. Physiol. 2002;120:887–895. doi: 10.1085/jgp.20028703. [DOI] [PMC free article] [PubMed] [Google Scholar]
- 38.Zhou J, Yi J, Hu N, George AL, Jr., Murray KT. Activation of protein kinase A modulates trafficking of the human cardiac sodium channel in Xenopus oocytes. Circ. Res. 2000;87:33–38. doi: 10.1161/01.res.87.1.33. [DOI] [PubMed] [Google Scholar]
- 39.Harrison SM, et al. BACE1 (β-secretase) transgenic and knockout mice: identification of neurochemical deficits and behavioral changes. Mol. Cell. Neurosci. 2003;24:646–655. doi: 10.1016/s1044-7431(03)00227-6. [DOI] [PubMed] [Google Scholar]
- 40.Rockenstein E, et al. High β-secretase activity elicits neurodegeneration in transgenic mice despite reductions in amyloid-β levels: implications for the treatment of Alzheimer disease. J. Biol. Chem. 2005;280:32957–32967. doi: 10.1074/jbc.M507016200. [DOI] [PubMed] [Google Scholar]
- 41.Hu X, et al. Bace1 modulates myelination in the central and peripheral nervous system. Nature Neurosci. 2006;9:1520–1525. doi: 10.1038/nn1797. [DOI] [PubMed] [Google Scholar]
- 42.Spampanato J, Escayg A, Meisler MH, Goldin AL. Functional effects of two voltage-gated sodium channel mutations that cause generalized epilepsy with febrile seizures plus type 2. J. Neurosci. 2001;21:7481–7490. doi: 10.1523/JNEUROSCI.21-19-07481.2001. [DOI] [PMC free article] [PubMed] [Google Scholar]
- 43.Claes L, et al. De novo mutations in the sodium-channel gene SCN1A cause severe myoclonic epilepsy of infancy. Am. J. Hum. Genet. 2001;68:1327–1332. doi: 10.1086/320609. [DOI] [PMC free article] [PubMed] [Google Scholar]
- 44.Mendez MF, Catanzaro P, Doss RC, ARquello R, Frey WH., 2nd Seizures in Alzheimer’s disease: clinicopathologic study. J. Geriatr. Psychiatry. Neurol. 1994;7:230–233. doi: 10.1177/089198879400700407. [DOI] [PubMed] [Google Scholar]
Associated Data
This section collects any data citations, data availability statements, or supplementary materials included in this article.