Abstract
Recent advances in micro-magnetic resonance imaging (μMRI) now allow noninvasive assessment of mechanical properties of trabecular bone (TB) in vivo by micro finite-element analysis. The first aim of this work was to address the implications of limited resolution and signal-to-noise ratio on elastic properties of TB derived under conditions of in vivo imaging via simulation at various resolutions and noise levels on the basis of models derived from μCT images at 21μm isotropic voxel size from cores of cadaveric human TB (N=13) from three anatomic sites. The second aim was to compare how elastic constants derived from actual MR images at 9.4 Tesla at 50μm isotropic voxel size compare with those from high-resolution μCT. Elastic moduli computed from simulated “in vivo” μMR images were highly correlated with those obtained from μCT (R2=0.99) and the data were relatively immune to noise. Correlations of similar strength were obtained between estimated moduli from μCT and acquired high-field MR images. Systematic errors manifesting in significant deviations of the slopes from unity are caused by higher apparent bone-volume fraction of the MR images but can potentially be corrected with appropriate histogram-standardization techniques.
Keywords: Noise, Resolution, MRI, Trabecular Bone, Mechanical Properties
Introduction
Currently, bone mineral density (BMD), measured by dual-energy X-ray absorptiometry (DXA), is the accepted method for prediction of fracture risk of bone.1 However, it has been increasingly recognized that properties of TB other than bone mass, in particular microstructure, also contribute to fracture risk.2 Studies of mechanical properties of TB have shown variations as high as 50% for bone with similar bone volume fraction (BV/TV).3
Advances in imaging technology, notably high-resolution MRI (μMRI) and peripheral quantitative CT (HR-pQCT), now permit acquisition of images at peripheral locations such as the distal radius,4-6 distal tibia4-6 or calcaneus 7,8 at resolutions adequate to at least partially resolve the TB network. High-resolution imaging in conjunction with image-based finite-element (FE) analysis techniques has shown great potential for estimating mechanical properties of TB.9-11 Recently, image-based FE analysis of the hip,12 calcaneus,13 and distal tibia14 from patients who had undergone treatment, showed significant improvements in mechanical properties despite undetectable changes in either BMD or BV/TV. However, it should be noted that these analysis were based on images with partially resolved TB network showing density variations.
In principle, FE techniques can be applied to images derived from any imaging modality; but so far most work has been done on the basis of μCT images,15 but more recently μMR has been used to generate FE meshes 14,16,17. For FE analysis linear resolutions at least on the order of trabecular thickness are desirable for faithful representation of the TB network.18 In μMRI the resolution attainable in vivo is limited by the achievable signal-to-noise ratio (SNR), whereas in μCT resolution is radiation dose limited. In μMRI, voxel sizes used in recent work range from 137×137×350 μm3 to 172×172×700 μm3.7,19,20 In HR-pQCT voxel sizes are smaller,5,21,22 typically on the order of 80×80×80 μm3. In MRI the width of the point spread function (PSF), which determines resolution, is about 20% greater than the linear dimensions of the imaging voxel.23 In CT, however, the PSF is usually considerably larger than the voxel dimension 24 and the actual resolution of HR-pQCT is thus substantially lower than 80μm.
Micro-MR images of TB are fundamentally different from μCT images. In MRI bone appears dark due to the limited detectability and relatively low abundance of protons in bone. On the other hand, the protons in bone marrow provide a strong signal of sufficient life time (T2 ∼ 50 ms) to permit spatial encoding under ordinary scanning conditions.25 However, trabeculae appear larger than in μCT images due to susceptibility discontinuity-induced artifacts resulting in some overestimation of BV/TV.26,27 While the feasibility of estimating elastic moduli based on high-resolution μCT is well established, the implications of limited SNR and resolution on Young’s and shear moduli derived from μMRI-based FE analysis has not previously been investigated.
The objectives of the present work were twofold. The first was to isolate the role of resolution and SNR from modality-specific effects, such as susceptibility boundary effects, on elastic moduli of TB estimated from FE analysis using simulated μMR images. The second objective was to compare elastic properties estimated from FE analysis of actual MR images obtained at 400 MHz (9.4 Tesla) at voxel sizes similar to those achievable by μCT scanning with those obtained from μCT images.
Methods
Trabecular bone sample preparation
Thirteen TB samples (7 proximal femora, 3 proximal tibiae, and 3 third lumbar vertebrae) were extracted from fresh frozen human cadavers (6 male, 1 female; ages 44-69 years). Cylindrical samples (5.2 mm diameter and 30 mm length) were cored (Core Drills 102057; Starlite, Rosemont, PA) along the superior—inferior direction for vertebral bodies and along principal trabecular orientation for femora and tibiae with marrow in situ following previously published protocols.28 Subsequently, bone marrow was removed with repeated use of a water jet. De-marrowed specimens were kept hydrated, wrapped in gauze, and stored at -20°C in air-tight containers until use.
Micro-CT Imaging
After thawing at room temperature, the cylindrical specimens were aligned and stabilized with wet gauzes in a 15-ml centrifuge tube along their longitudinal axis. Subsequently, the specimen was inserted into the specimen holder of a μCT system (vivaCT 40; SCANCO Medical, Bassersdorf, Switzerland). The central 15 mm of the 30 mm length was scanned at 21-μm nominal isotropic voxel size (55 kVp, 109 μA, 290 ms integration time).
Simulation of “in vivo” μMRI
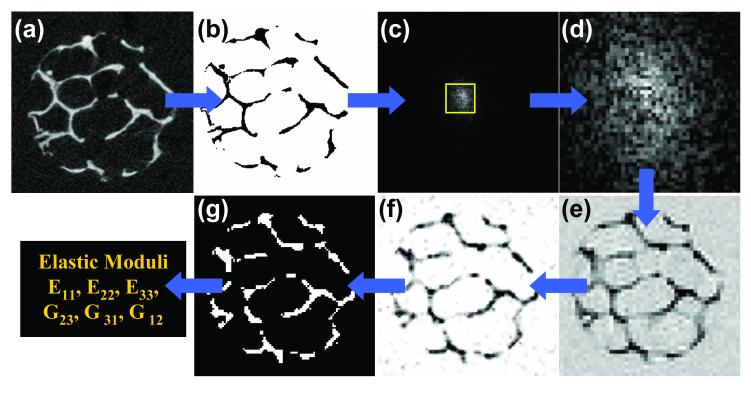
To evaluate the dependence of elastic properties on resolution and SNR, μMR images were simulated on the basis of segmented μCT images serving as an approximation to the ground truth (Figure 1). For this purpose the μCT images were first binarized with a threshold set at the mid-point of the two modes (bone and background) of the histogram. Since in MRI the signal-producing entity is bone marrow, zero and maximum intensity were assigned to the bone and marrow phases, respectively. The resulting binary systems were then Fourier inverted to yield spatial frequency domain (k-space) data and low-pass filtered so as to provide, after inverse Fourier transformation, two sets of images with anisotropic (126×126×396 μm3) and isotropic (126×126×126 μm3) voxel size. The former is close to the image voxel size achieved in vivo at peripheral locations 4 and the feasibility of isotropic resolution has recently been demonstrated.29 Gaussian-distributed random numbers with standard deviation σ were added to the real and imaginary parts of the k-space data sets. Subsequently, the absolute values of the noisy images were computed, thereby converting Gaussian to Rician noise, 30 the type of noise found in MR images. The σ values were chosen to yield the desired image SNR (defined as the ratio between the mean marrow intensity and σ) ranging from 6 to 14, a range typical of in vivo μMR images of TB. 23 These simulated “μMR images” were subvoxel processed 31 (an algorithm used to enhance the apparent resolution of in vivo μMR images), and segmented at constant threshold. Finally, identical ROIs (∼ 4×4×4 mm3) were automatically extracted from both binarized μCT and simulated μMR images for FE analysis.
Figure 1.
Illustration of the image acquisition, processing, and analysis flow: a) μCT image from a distal tibia specimen (21×21×21 μm3 voxel size); b) segmented and intensity inverted to mimic μMRI; (c) k-space magnitude map after 3D FFT and addition of noise with central region indicated; (d) low-pass filtered to reduce spatial resolution; (e) 3D inverse FFT to produce an image with in-vivo μMRI characteristics; f) subvoxel processed; g) segmented for μFE analysis.
MR imaging
The specimen cores were immersed in water doped with 1-mM Gd-DTPA to shorten the longitudinal relaxation time to about 300 ms, consistent with fatty marrow 26 (the specimens cannot be imaged with marrow in place since air inclusions would cause artifacts).25 The samples were then individually centrifuged at 2000 rpm for 5 minutes to remove remaining air trapped in the inter-trabecular spaces. 3D MR images were acquired on a 9.4 T (400 MHz) μMRI system (Bruker DMX 400; Billerica, MA) at isotropic voxel size using a 3D spin-echo pulse sequence with TE = 15 ms, TR = 107 ms, FOV = 6.4×6.4×25.6 mm3, and scan time ∼ 2 hours. The chosen voxel size is about twice that of the μCT images but is the smallest achievable in realistic scan times. (A further reduction by a factor of 2 in all three linear dimensions would increase the scan time 64-fold to achieve the same SNR).
Finite-element analysis
Binarized common ROIs from μMR, simulated μMR, and μCT images were used to calculate elastic material constants (three Young’s moduli, E11, E22, E33 and three shear moduli, G23, G31, G12) using a previously published FE algorithm.14,32 The bone tissue properties were chosen as homogeneous, isotropic, and linearly elastic with a Young’s modulus of 15 GPa and a Poisson’s ratio of 0.3 assigned to each FE. Six FE analyses were performed for each image, representing three uniaxial compression tests and three shear tests.32,33 The overall stiffness tensor was first calculated in terms of the original image coordinate system (X1, X2, and X3) in which X3 coincided with the physical axis of the specimen. By contrast, X1 and X2 were chosen arbitrarily since anterior-posterior or medio-lateral orientation had not been retained. Subsequently, the principal directions of the stiffness matrix were calculated by minimizing off-diagonal elements yielding a new principal coordinate system that parallels the direction of the mechanical eigenvectors (x1, x2, and x3). The transformed stiffness matrix was used to estimate E11, E22, and E33. The elastic material constants were sorted with E11 representing the smallest and E33 the largest modulus (E33 > E22 > E11).13
Processing of μCT and MR images
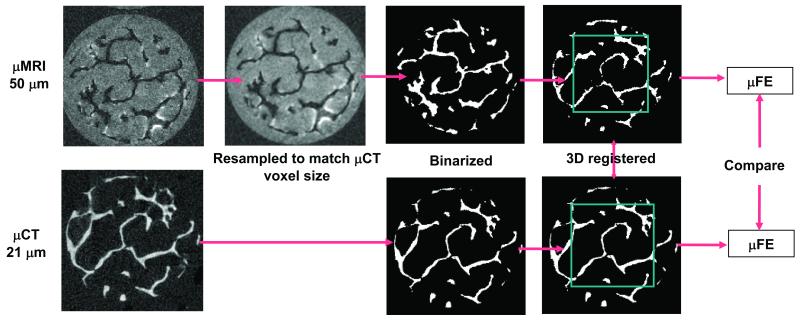
Figure 2 describes the preprocessing steps needed to select common ROIs from the MR and μCT images for FE analysis. The 3D gray-scale μCT images were binarized as described before. The voxel-based representation of the TB network resulting from these binary images served as ground-truth reference for comparison with MR images. To minimize the bias due to resolution, the MR images were resampled to μCT voxel size by 3D cubic interpolation. The resulting MR images can be segmented analogous to the μCT images by selecting a threshold between the two modes. However, direct binarization of grayscale MR images typically results in apparent thickening of trabeculae compared to μCT images due to overestimation of BV/TV resulting from susceptibility broadening. The binarization is further complicated by the relatively wide range of histogram means found for both bone (and “marrow”) intensities. A histogram-standardization technique was therefore used to transform the mean intensities to common values (for details see Appendix A). The binarization of the transformed images was achieved by setting a common threshold between the two peaks of the histogram. The threshold value determines the slope of the regression of BV/TV derived from MR and μCT images. For this study, a threshold was selected such that the slope ∼ 1. After resampling the MR images to μCT voxel size, rigid-body registration was performed using an automatic registration technique developed in the authors’ laboratory. 34 The details and the performance of this registration technique are described in Appendix B. Three sets of common ROIs (4×4×4 mm3) were then extracted from each MR and μCT image for μFE and architectural analysis, the latter comprising trabecular thickness (Tb.Th*), trabecular separation (Tb.Sp*), and trabecular number (Tb.N*).
Figure 2.
Processing steps used to extract TB volumes from MR images that correspond to matching μCT image volumes for μFE analysis. Acquired MR images were resampled to μCT voxel size and BV/TV corrected prior to segmentation. Segmented MR and μCT images were registered and regions of interest were extracted for μFE analysis.
Results
Elastic properties of TB derived from simulated “in-vivo” μMRI
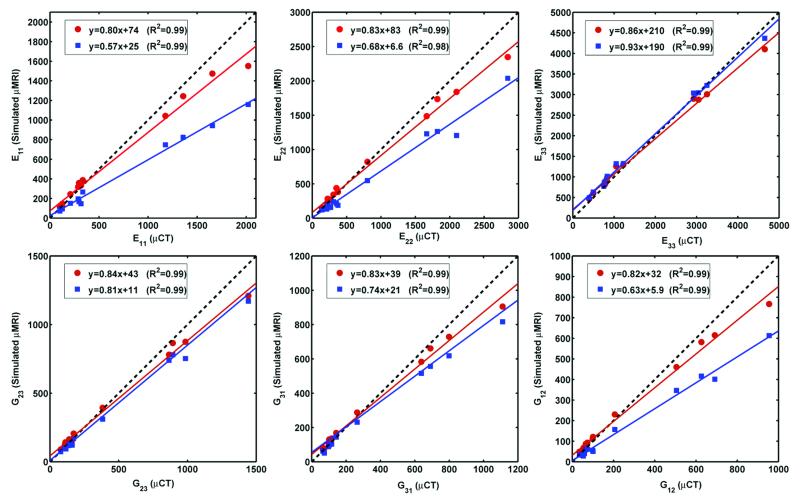
Figure 3 shows the effect of resolution on the correlation between elastic moduli derived from μCT and simulated “in vivo” μMR images. Strong correlations were obtained for both anisotropic (126×126×396 μm3) and isotropic (126×126×126 μm3) voxels size. It is noted that isotropic voxel size yielded slope and intercept closer to the expected ideal value compared to the anisotropic voxel size for five of the parameters, except for E33. For E33 both slopes were close to unity. Small non-zero y-intercepts were noted for all elastic constants at isotropic voxel (all p<0.01) size while only E33 and G31 differed significantly at anisotropic voxel size (p<0.01).
Figure 3.
Elastic moduli (MPa) derived from simulated μMR images at voxel sizes characteristic of in-vivo TB imaging versus those obtained from μCT data: ( ) 126×126×126 μm3, (
 ) 126×126×396 μm3 voxel size.
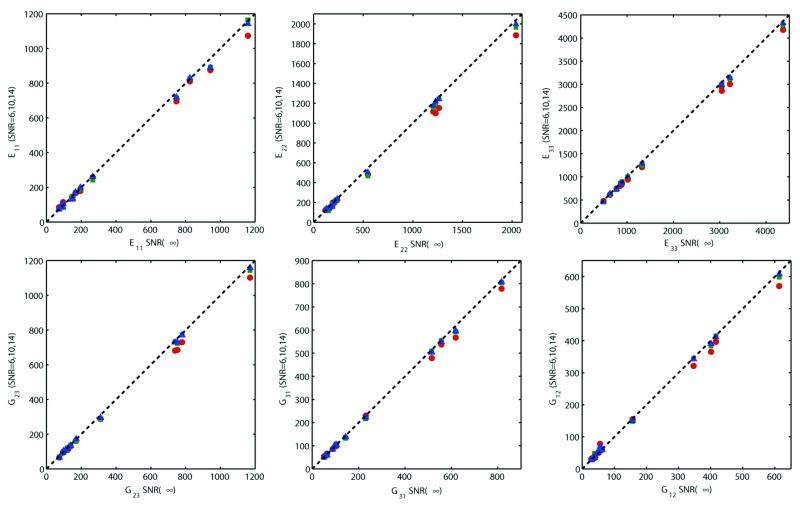
Figure 4 shows the effect of noise on elastic properties derived from simulated μMR images. The estimated moduli were found to be stable and close to those of the noiseless values (SNR = ∞) for SNR ranging from 6-14. However, the elastic moduli become increasingly underestimated with decreasing SNR in a predictable manner, a trend observed for all six parameters.
Figure 4.
Correlation of the elastic moduli (MPa) derived from simulated μMR images at SNR=∞ with those at SNR = 14 ( ), 10 (
 ), and 6 (
 ) at 126×126×396 μm3 voxel size. Dotted line represents the line of identity.
Trabecular bone mechanical and architectural constants derived from actual MR and μCT Images
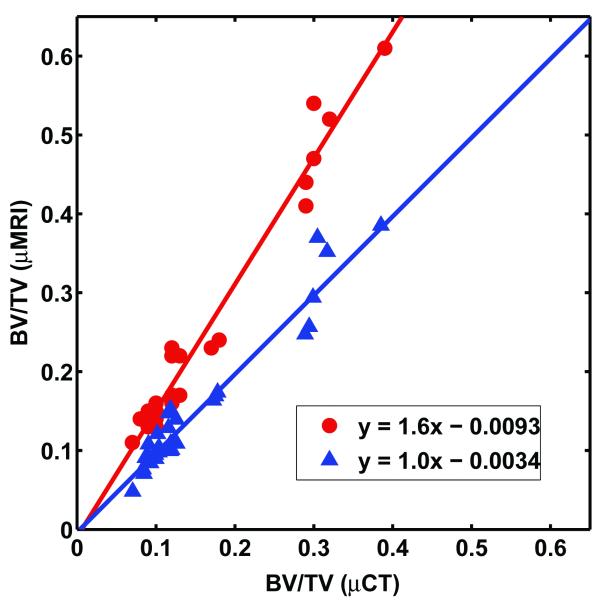
The registration 34 between μCT and MR images produced closely matched ROIs (Appendix B) even when the images differ considerably due to modality-specific variations in the representation of the structure, for example susceptibility-induced broadening of the trabeculae in MRI.35 The correlation of BV/TV derived from MR and μCT images is shown in Figure 5. Direct binarization of MR images using the mid-point of the mean bone and “marrow” intensities as the threshold (i.e., without histogram standardization), resulted in overestimation of BV/TV compared to reference μCT values, with a slope of 1.61. The histogram standardization followed by binarization with a common threshold resulted in a correlation with slope 1.02. The range of BV/TV for the 30 data sets was wide (0.06-0.39) and non-uniformly distributed.
Figure 5.
Comparison of BV/TV computed from 9.4 T images at 50×50×50 μm3 voxel size with those derived from μCT images at 21×21×21 μm3 voxel size ( ) with and (
 ) without histogram standardization.
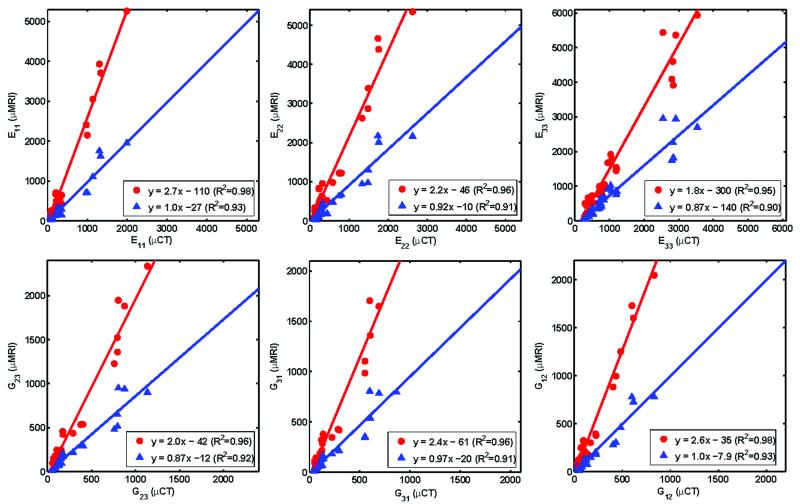
Figure 6 shows the results of inter-modality correlations of elastic moduli derived by μFE analysis. The correlations were strong (R2 ranging from 0.90 to 0.93) with slopes close to unity for all six moduli with non-significant y-intercepts, except for E33 and G31 derived from histogram corrected images (p<0.05). Architectural parameters were also highly correlated between the two modalities (R2 ranging from 0.78 to 0.97). Histogram standardization caused the slope for Tb.Th* to decrease to 0.91 from 2.1 but did not affect those of the other parameters significantly (Table 1).
Figure 6.
Comparison of elastic moduli (MPa) computed on the basis of μMR 9.4 T images at 50×50×50 μm3 voxel size with those derived from μCT images at 21×21×21 μm3 voxel size, with ( ) and without (
 ) histogram standardization.
Table 1.
Slope, intercept and R2 values of the linear regression between architectural parameters derived from actual μMR (50×50×50 μm3) and high-resolution μCT (21×21×21 μm3) images before and after histogram standardization.
| Tb.Th* | Tb.Sp* | Tb.N* | ||||
|---|---|---|---|---|---|---|
| Before | After | Before | After | Before | After | |
| Slope | 2.147 | 0.914 | 0.858 | 0.932 | 1.121 | 1.253 |
| Intercept | -0.102*) | 0.007 | 0.001 | 0.002 | 0.249*) | -0.134**) |
| R2 | 0.797 | 0.776 | 0.926 | 0.964 | 0.926 | 0.972 |
p<0.05
p=0.05
Discussion
While μMR images acquired in vivo from patients have recently been used as input to FE solvers 14, the effect of limited resolution and SNR on the derived parameters had not previously been investigated. Similarly, imaging modality-specific effects on mechanical parameters derived from ROI-matched μCT and MR images at similar resolution had not previously been reported. The present data show that variations in SNR and effective image resolution produce systematic errors in the computed mechanical parameters. There is currently no standard for image resolution in μMRI of TB in vivo. Image voxel sizes used range from 172×172×700μm3 19 to 137×137×350μm3 20 for structural studies in the distal extremities, with typical scan times on the order of 15 minutes. Our data show that the correlations between μCT and simulated μMR-based elastic parameters improve at isotropic voxel sizes as opposed to the more commonly used anisotropic voxel sizes (generally dictated by SNR limitations). The improved accuracy is attributed to the more faithful representation of transverse trabeculae (i.e. those perpendicular to the bone’s macroscopic anatomic axis), which, of course, play a critical role for loading in transverse direction. We note in Figure 3 that the deviation in the slope from unity for correlations between moduli obtained from simulated “in-vivo” resolution MR images and those derived from high-resolution μCT images depends on the direction of loading. The deviation is less for E33 (longitudinal loading direction) than for E11 and E22 (transverse loading directions). This finding is plausible since E33 is largely determined by trabeculae oriented along the direction perpendicular to the imaging slice, thus increased slice thickness will not substantially affect recovery of these trabeculae.
The chosen SNR range (6-14) for the simulations of the in-vivo regime of TB imaging is realistic for the resolutions at which clinical studies have been performed in the authors’ laboratory.36 The data suggest that while the linear relations between “ground-truth” remains intact, the elastic moduli become increasingly underestimated with decreasing SNR, a trend observed for all six parameters. Increasing noise levels in images can result in artifactual erosion leading to apparent disconnection of TB rods after binarization, thereby causing a reduction in the estimated parameter values. Nevertheless, the high correlation between elastic parameters derived from μCT and simulated μMR data under realistic resolutions and noise levels suggests the potential for estimating mechanical moduli on the basis of in vivo μMR images, thereby circumventing the need of deriving architectural parameters as surrogates of mechanical parameters.
Mechanical (and architectural) parameters derived from high-field μMRI and high-resolution μCT were highly correlated with a slope close to unity. The observed level of correlation suggests the overall topology of the trabecular network to be largely preserved in the MR images in spite of their lower spatial resolution and artifacts from locally induced inhomogeneous fields resulting from magnetic susceptibility effects at the bone-marrow interface.35,37 The results also show that histogram standardization is essential, in particular for MR images. The proposed simple method is based on mapping the mean intensities of bone and “marrow” of the bimodal histogram to common values, thereby allowing choice of a single threshold for binarization of the MR images, even in the absence of the corresponding micro-CT images. For a given field strength, the threshold can be empirically chosen to yield a slope of unity for the regression between BV/TV calculated from μMR and μCT images. Without histogram standardization, the estimated mechanical constants will be overestimated (by a factor of 1.8-2.7 according to Figure 6) due to the systematic overestimation of the BV/TV (by a factor of 1.6 according to Figure 5). These values are in agreement with the previously established power (∼square) law relation between BV/TV and elastic moduli.38 Lastly, histogram standardization also improved the agreement between μMR and μCT derived architectural parameters, in particular for Tb.Th* (Table 1).
This study has some limitations. While the simulations of MR images on the basis of binarized high-resolution μCT images are realistic in terms of the noise and point-spread function behavior of MR images, they of course do not capture other modality-specific effects, in particular susceptibility boundary effects. However, these effects are less severe at clinical field strengths (1.5T and, more recently, 3T) at which TB imaging is typically performed. As far as the comparison between acquired μMR and μCT images is concerned, these effects are exacerbated by gadolinium doping, which causes a slight increase in the bone -“bone marrow” susceptibility difference.37 In addition, even very small air inclusions in the marrow spaces (difficult to remove with centrifugation) can give rise to artifacts in the MR images since the susceptibility of air differs from that of water by 9 ppm.39 We do not know the effective resolution of the μCT images (resolution in μCT is determined, among other parameters, by the focal spot of the X-ray tube). In terms of voxel size the μMR images in the present study was larger by a factor of two in all three spatial dimensions. However, matching the MR to the CT voxel size would have increased scan time by over two orders of magnitude to achieve comparable SNR, which would have been impractical. Nevertheless, in spite of these complicating factors we found the level of agreement between the two modalities remarkable.
In conclusion, this work shows that mechanical constants derived from relatively low-resolution images and in the presence of noise -- both characteristic of in vivo MRI -- are highly correlated with those obtained at μCT resolution. Further, within the range of SNR achievable in vivo, the derived elastic constants are remarkably immune to noise. Similarly, relative elastic moduli derived from acquired high-resolution μMR images compare favorably with those obtained from μCT. Systematic errors manifesting in deviations of the slope of the correlations from unity are largely explained by differences in apparent trabecular volume fraction for the two modalities. In summary, it is concluded that FE models constructed from images at in vivo resolution and SNR may be useful for prediction of the bone’s mechanical behavior in patient studies.
Acknowledgements
This work was supported by NIH grants R01 AR 41443, R01 AR 53156, R01 AR55647, and R01 AR51376.
Appendix A
Histogram Standardization
Let Ibefore and Iafter represent the intensities of a given voxel in an image before and after histogram standardization, respectively. Then, Iafter can be calculated by the transformation given by
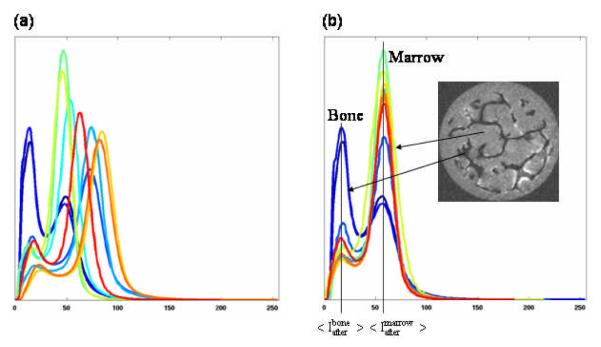
where <…> represents the mean intensity of bone (or marrow) in the image before and after his histogram standardization. The values of and can be automatically estimated based on the histogram before transformation and and can be set as desired. For this study, and were chosen as the median of mean intensity values of bone and marrow, respectively, in all 10 images. The application of the histogram standardization to all the grayscale MR images, with intensity range 0-255, thus transformed the mean intensity of bone and marrow to and , respectively. The standardization technique effectively transformed the mean intensity of bone (and marrow) of all the images to a fixed value thereby enabling common threshold selection for segmentation (Figure A1).
Figure A1.
The histograms of MR images (a) before and (b) after histogram standardization.
Appendix B
Performance of the registration algorithm
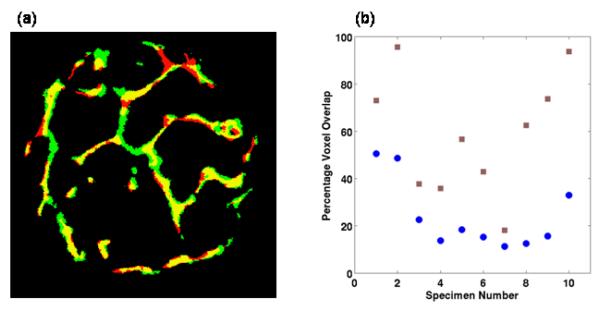
Figure B1 summarizes the registration results obtained with the TB images, where close alignment of MR and μCT images are visually evident, a trend observed for all the images. The voxel overlap between MR and μCT images improved considerably for most images after the co-registration. Considerable MR-image distortion due to air inclusions and residual bone marrow resulted in a low voxel overlap for specimen 7. However, the voxel overlap was still improved after registration.
Figure B1.
Voxel overlap between the μCT and registered MR images; (a) example mid-slice from a μCT (red) and MR (green) images overlaid onto each other with yellow representing the regions of overlap between the μCT and MR images; (b) comparison of voxel-overlap before and after registration for ten 3D TB specimen images ( ) before and (
 ) after registration.
References
- 1.Assessment of fracture risk and its application to screening for postmenopausal osteoporosis. Report of a WHO Study Group. World Health Organ Tech Rep Ser. 1994;843:1–129. [PubMed] [Google Scholar]
- 2.Riggs BL, Melton LJ., 3rd Bone turnover matters: the raloxifene treatment paradox of dramatic decreases in vertebral fractures without commensurate increases in bone density. J Bone Miner Res. 2002;17:11–14. doi: 10.1359/jbmr.2002.17.1.11. [DOI] [PubMed] [Google Scholar]
- 3.Ulrich D, Hildebrand T, Van Rietbergen B, et al. The quality of trabecular bone evaluated with micro-computed tomography, FEA and mechanical testing. Stud Health Technol Inform. 1997;40:97–112. [PubMed] [Google Scholar]
- 4.Benito M, Gomberg B, Wehrli FW, et al. Deterioration of trabecular architecture in hypogonadal men. J Clin Endocrinol Metab. 2003;88:1497–1502. doi: 10.1210/jc.2002-021429. [DOI] [PubMed] [Google Scholar]
- 5.Boutroy S, Bouxsein ML, Munoz F, et al. In vivo assessment of trabecular bone microarchitecture by high-resolution peripheral quantitative computed tomography. J Clin Endocrinol Metab. 2005;90:6508–6515. doi: 10.1210/jc.2005-1258. [DOI] [PubMed] [Google Scholar]
- 6.MacNeil JA, Boyd SK. Load distribution and the predictive power of morphological indices in the distal radius and tibia by high resolution peripheral quantitative computed tomography. Bone. 2007;41:129–137. doi: 10.1016/j.bone.2007.02.029. [DOI] [PubMed] [Google Scholar]
- 7.Boutry N, Cortet B, Dubois P, et al. Trabecular bone structure of the calcaneus: preliminary in vivo MR imaging assessment in men with osteoporosis. Radiology. 2003;227:708–717. doi: 10.1148/radiol.2273020420. [DOI] [PubMed] [Google Scholar]
- 8.Link TM, Vieth V, Matheis J, et al. Bone structure of the distal radius and the calcaneus vs BMD of the spine and proximal femur in the prediction of osteoporotic spine fractures. Eur Radiol. 2002;12:401–408. doi: 10.1007/s003300101127. [DOI] [PubMed] [Google Scholar]
- 9.Niebur GL, Feldstein MJ, Yuen JC, et al. High-resolution finite element models with tissue strength asymmetry accurately predict failure of trabecular bone. J Biomech. 2000;33:1575–1583. doi: 10.1016/s0021-9290(00)00149-4. [DOI] [PubMed] [Google Scholar]
- 10.Pistoia W, van Rietbergen B, Laib A, et al. High-resolution three-dimensional-pQCT images can be an adequate basis for in-vivo microFE analysis of bone. J Biomech Eng. 2001;123:176–183. doi: 10.1115/1.1352734. [DOI] [PubMed] [Google Scholar]
- 11.Saxena R, Keller TS, Sullivan JM. A Three-Dimensional Finite Element Scheme to Investigate the Apparent Mechanical Properties of Trabecular Bone. Comput Methods Biomech Biomed Engin. 1999;2:285–294. doi: 10.1080/10255849908907993. [DOI] [PubMed] [Google Scholar]
- 12.Keaveny TM, Bouxsein ML. Theoretical Implications of the Biomechanical Fracture Threshold. J Bone Miner Res. 2008 doi: 10.1359/JBMR.080406. [DOI] [PMC free article] [PubMed] [Google Scholar]
- 13.van Rietbergen B, Majumdar S, Newitt D, et al. High-resolution MRI and micro-FE for the evaluation of changes in bone mechanical properties during longitudinal clinical trials: application to calcaneal bone in postmenopausal women after one year of idoxifene treatment. Clin Biomech (Bristol, Avon) 2002;17:81–88. doi: 10.1016/s0268-0033(01)00110-3. [DOI] [PubMed] [Google Scholar]
- 14.Zhang XH, Liu XS, Vasilic B, et al. In Vivo muMRI Based Finite Element and Morphological Analyses of Tibial Trabecular Bone in Eugonadal and Hypogonadal Men Before and After Testosterone Treatment. J Bone Miner Res. 2008 doi: 10.1359/JBMR.080405. [DOI] [PMC free article] [PubMed] [Google Scholar]
- 15.van Rietbergen B. Micro-FE analyses of bone: state of the art. Adv Exp Med Biol. 2001;496:21–30. doi: 10.1007/978-1-4615-0651-5_3. [DOI] [PubMed] [Google Scholar]
- 16.Newitt DC, van Rietbergen B, Majumdar S. Processing and analysis of in vivo high-resolution MR images of trabecular bone for longitudinal studies: reproducibility of structural measures and micro-finite element analysis derived mechanical properties. Osteoporos Int. 2002;13:278–287. doi: 10.1007/s001980200027. [DOI] [PubMed] [Google Scholar]
- 17.Alberich-Bayarri A, Moratal D, Marti-Bonmati L, et al. Volume mesh generation and finite element analysis of trabecular bone magnetic resonance images. Conf Proc IEEE Eng Med Biol Soc. 2007;1:1603–1606. doi: 10.1109/IEMBS.2007.4352612. [DOI] [PubMed] [Google Scholar]
- 18.Ladd AJ, Kinney JH. Numerical errors and uncertainties in finite-element modeling of trabecular bone. J Biomech. 1998;31:941–945. doi: 10.1016/s0021-9290(98)00108-0. [DOI] [PubMed] [Google Scholar]
- 19.Majumdar S, Link TM, Augat P, et al. Trabecular bone architecture in the distal radius using magnetic resonance imaging in subjects with fractures of the proximal femur. Magnetic Resonance Science Center and Osteoporosis and Arthritis Research Group. Osteoporos Int. 1999;10:231–239. doi: 10.1007/s001980050221. [DOI] [PubMed] [Google Scholar]
- 20.Wehrli FW, Hwang SN, Ma J, et al. Cancellous bone volume and structure in the forearm: noninvasive assessment with MR microimaging and image processing. Radiology. 1998;206:347–357. doi: 10.1148/radiology.206.2.9457185. [DOI] [PubMed] [Google Scholar]
- 21.Boutroy S, Van Rietbergen B, Sornay-Rendu E, et al. Finite element analysis based on in vivo HR-pQCT images of the distal radius is associated with wrist fracture in postmenopausal women. J Bone Miner Res. 2008;23:392–399. doi: 10.1359/jbmr.071108. [DOI] [PubMed] [Google Scholar]
- 22.MacNeil JA, Boyd SK. Accuracy of high-resolution peripheral quantitative computed tomography for measurement of bone quality. Med Eng Phys. 2007;29:1096–1105. doi: 10.1016/j.medengphy.2006.11.002. [DOI] [PubMed] [Google Scholar]
- 23.Wehrli FW, Saha PK, Gomberg BR, et al. Noninvasive assessment of bone architecture by magnetic resonance micro-imaging-based virtual bone biopsy. Proc IEEE. 2003;91:1520–1542. [Google Scholar]
- 24.Feldkamp LA, Goldstein SA, Parfitt AM, et al. The direct examination of three-dimensional bone architecture in vitro by computed tomography. J Bone Miner Res. 1989;4:3–11. doi: 10.1002/jbmr.5650040103. [DOI] [PubMed] [Google Scholar]
- 25.Chung HW, Wehrli FW, Williams JL, et al. Quantitative analysis of trabecular microstructure by 400 MHz nuclear magnetic resonance imaging. J Bone Miner Res. 1995;10:803–811. doi: 10.1002/jbmr.5650100518. [DOI] [PubMed] [Google Scholar]
- 26.Jara H, Wehrli FW, Chung H, et al. High-resolution variable flip angle 3D MR imaging of trabecular microstructure in vivo. Magn Reson Med. 1993;29:528–539. doi: 10.1002/mrm.1910290415. [DOI] [PubMed] [Google Scholar]
- 27.Last D, Peyrin F, Guillot G. Accuracy of 3D MR microscopy for trabecular bone assessment: a comparative study on calcaneus samples using 3D synchrotron radiation microtomography. Magma. 2005;18:26–34. doi: 10.1007/s10334-004-0075-3. [DOI] [PubMed] [Google Scholar]
- 28.Keaveny TM, Guo XE, Wachtel EF, et al. Trabecular bone exhibits fully linear elastic behavior and yields at low strains. J Biomech. 1994;27:1127–1136. doi: 10.1016/0021-9290(94)90053-1. [DOI] [PubMed] [Google Scholar]
- 29.Magland JF, Wald MJ, Lemdiasov R, et al. In Vivo Trabecular Bone Micro-Imaging at Isotropic Resolution Using 3D FLASE with Parallel Imaging at 3T. Proc Int Soc Mag Res Med. 2008;16:2527. [Google Scholar]
- 30.Gudbjartsson H, Patz S. The Rician distribution of noisy MRI data. Magn Reson Med. 1995;34:910–914. doi: 10.1002/mrm.1910340618. [DOI] [PMC free article] [PubMed] [Google Scholar]
- 31.Hwang SN, Wehrli FW. Subvoxel processing: a method for reducing partial volume blurring with application to in vivo MR images of trabecular bone. Magn Reson Med. 2002;47:948–957. doi: 10.1002/mrm.10138. [DOI] [PubMed] [Google Scholar]
- 32.van Rietbergen B, Odgaard A, Kabel J, et al. Direct mechanics assessment of elastic symmetries and properties of trabecular bone architecture. J Biomech. 1996;29:1653–1657. doi: 10.1016/0021-9290(96)00093-0. [DOI] [PubMed] [Google Scholar]
- 33.Hollister SJ, Brennan JM, Kikuchi N. A homogenization sampling procedure for calculating trabecular bone effective stiffness and tissue level stress. J Biomech. 1994;27:433–444. doi: 10.1016/0021-9290(94)90019-1. [DOI] [PubMed] [Google Scholar]
- 34.Rajapakse CS, Magland JF, Wehrli FW. Fast prospective registration of in vivo MR images of trabecular bone microstructure in longitudinal studies. Magn Reson Med. 2008;59:1120–1126. doi: 10.1002/mrm.21593. [DOI] [PMC free article] [PubMed] [Google Scholar]
- 35.Chung H, Wehrli FW, Williams JL, et al. Relationship between NMR transverse relaxation, trabecular bone architecture, and strength. Proc Natl Acad Sci U S A. 1993;90:10250–10254. doi: 10.1073/pnas.90.21.10250. [DOI] [PMC free article] [PubMed] [Google Scholar]
- 36.Wehrli FW, Ladinsky GA, Jones C, et al. In vivo magnetic resonance detects rapid remodeling changes in the topology of the trabecular bone network after menopause and the protective effect of estradiol. J Bone Miner Res. 2008;23:730–740. doi: 10.1359/JBMR.080108. [DOI] [PMC free article] [PubMed] [Google Scholar]
- 37.Hwang SN, Wehrli FW. Experimental evaluation of a surface charge method for computing the induced magnetic field in trabecular bone. J Magn Reson. 1999;139:35–45. doi: 10.1006/jmre.1999.1744. [DOI] [PubMed] [Google Scholar]
- 38.Helgason B, Perilli E, Schileo E, et al. Mathematical relationships between bone density and mechanical properties: a literature review. Clin Biomech (Bristol, Avon) 2008;23:135–146. doi: 10.1016/j.clinbiomech.2007.08.024. [DOI] [PubMed] [Google Scholar]
- 39.Hopkins JA, Wehrli FW. Magnetic susceptibility measurement of insoluble solids by NMR: magnetic susceptibility of bone. Magn Reson Med. 1997;37:494–500. doi: 10.1002/mrm.1910370404. [DOI] [PubMed] [Google Scholar]


