

Abstract
This study evaluated the neural basis of verbal working memory (WM) function in a group of 20 children and adolescents with fetal alcohol spectrum disorders (FASDs) and 20 typically developing comparison participants using functional magnetic resonance imaging (fMRI). Both groups showed prominent activation in the frontal‐parietal‐cerebellar network known to be important for verbal WM. Despite equivalent behavioral performance between groups, alcohol‐exposed individuals showed increased activation relative to typically developing individuals in left dorsal frontal and left inferior parietal cortices, and bilateral posterior temporal regions during verbal WM. These effects remained even when group differences on IQ were statistically controlled. This pattern of increased activation coupled with equivalent behavioral performance between groups suggests that individuals with FASD recruit a more extensive network of brain regions during verbal WM relative to typically developing individuals. These findings may suggest that frontal‐parietal processing during verbal WM is less efficient in alcohol‐exposed individuals. Hum Brain Mapp 2009. © 2009 Wiley‐Liss, Inc.
Keywords: working memory, prenatal alcohol exposure, development, fMRI
INTRODUCTION
Alcohol is a known teratogen and prenatal exposure can lead to severe neurological, cognitive, growth, and behavioral abnormalities (Jones and Smith,1975; Riley et al.,2004), resulting in a spectrum of disorders known as fetal alcohol spectrum disorders (FASDs). Those individuals most severely affected exhibit facial dysmorphology, which is required for a diagnosis of fetal alcohol syndrome (FAS) (Jones and Smith,1975). However, even individuals without the facial dysmorphology required for a diagnosis of FAS have been shown to suffer neurological, behavioral, and cognitive deficits (Mattson and Riley,1998; Roebuck et al.,1999). Microcephaly is a common gross neurological abnormality among individuals with a full FAS diagnosis (Jones and Smith,1975), but a number of quantitative brain imaging studies have also revealed both cortical and subcortical anatomical anomalies across the spectrum of disorders. Structural dysmorphology has been reported for numerous subcortical and cortical structures, including the corpus callosum (Bookstein et al.,2001; Sowell et al.,2001a), cerebellar vermis (O'Hare et al.,2005; Sowell et al.,1996), basal ganglia (Archibald et al.,2001; Mattson et al.,1996), and parietal lobe (Archibald et al.,2001). Cortical surface analyses have revealed increased grey matter thickness relative to typically developing individuals in the posterior temporal and inferior parietal lobes (Archibald et al.,2001; Sowell et al.,2001b,2002a), and the right frontal lobe (Sowell et al.,2008). Studies evaluating brain shape abnormalities in alcohol‐exposed individuals have also revealed decreased brain size in the posterior temporal and inferior parietal lobes and orbitofrontal cortex (Sowell et al.,2002a).
Numerous neuropsychological investigations have demonstrated deficits in general intelligence, verbal and visual‐spatial‐based learning, attention, and executive functioning (Mattson and Riley,1998; Rasmussen et al.,2006; Riley and McGee,2005; Streissguth et al.,2004), and it has not been determined if there are any cognitive domains unaffected by prenatal alcohol exposure. Working memory (WM) is a psychological construct thought to represent the temporary storage and manipulation of information that is required for concurrent cognition (Baddeley,1986,1992,2003; Smith and Jonides,1998; Smith et al.,1998), and neuropsychological and neuroimaging studies have implicated frontal, parietal (Braver et al.,1997; Callicott et al.,1999; Rypma et al.,1999), and cerebellar regions (Desmond et al.,1997; Kirschen et al.,2005) as being crucial for performance within this cognitive domain. Although WM function has not been extensively evaluated in FASDs (Rasmussen,2005), one study noted that the neuropsychological tasks that best discriminated alcohol‐exposed participants from comparison participants were those that placed the highest demands on WM (Kodituwakku et al.,1995), and on the basis of this observation suggested that WM dysfunction is a primary mechanism of cognitive deficit in FASDs (Rasmussen,2005). More recently, Burden and colleagues used a factor analytic approach to examine the effects of prenatal alcohol exposure on working memory. Findings from this prospective study indicated that WM is the component of attention most affected by moderate to heavy amounts of alcohol exposure. Furthermore, WM was sensitive to the effects of prenatal alcohol exposure beyond the global intellectual deficits reflected in IQ differences common in this population (Burden et al.,2005). Therefore, although WM dysfunction appears to be a core cognitive deficit in FASD, no studies have examined the effects of prenatal alcohol exposure on the neural basis of WM using functional neuroimgaing methods and direct statistical comparisons between individuals with FASDs and comparison participants.
Few studies have focused on relationships between brain dysmorphology and cognitive function. Correlations between brain structural dysmorphology and impaired verbal‐based learning and memory have been observed in the cerebellum (O'Hare et al.,2005) and corpus callosum (Sowell et al.,2001a) within individuals with FASDs. In both of these studies, greater dysmorphology was associated with greater impairment on a test of verbal learning and memory. Verbal learning and memory was also found to correlate with grey matter thickness in right frontal regions in individuals with FASDs (Sowell et al.,2008). Two recent fMRI investigations of brain function in individuals with FASDs have revealed altered recruitment of brain regions in response to verbal learning (Sowell et al.,2007) in some of the same subjects studied here, and response inhibition (Fryer et al.,2007) in an independent sample. In both instances, alcohol‐exposed participants showed increased prefrontal activation coupled with decreased activation in the subcortical region important for performance on the particular task under study, that is, medial temporal regions for verbal learning (Sowell et al.,2007) and the caudate nucleus for response inhibition (Fryer et al.,2007).
A previous fMRI investigation of visual‐spatial WM function in individuals with FASDs reported brain activation differences between this group and typically developing individuals (Malisza et al.,2005), but group performance differences and a lack of direct statistical comparisons between groups make interpretation of those findings problematic (Bookheimer and Sowell,2005). Previous neuropsychological studies (Burden et al.,2005; Kodituwakku et al.,1995) have implicated WM dysfunction as central to the cognitive deficits characteristic of prenatal alcohol exposure. Furthermore, given known structural abnormalities in brain regions critical for WM, such as inferior parietal regions (Sowell et al.,2002a,b) and the cerebellum (Archibald et al.,2001; O'Hare et al.,2005) among individuals with FASDs, and previous reports of altered recruitment of prefrontal and subcortical structures necessary for verbal learning (Sowell et al.,2007) and response inhibition (Fryer et al.,2007), we sought to evaluate the neural basis of verbal WM in this population. Based on the findings reviewed above, we predicted altered recruitment of the frontal‐parietal‐cerebellar verbal WM network among individuals with FASDs relative to typically developing comparison participants.
MATERIALS AND METHODS
Participants
Demographic information for all participants is shown in Table I. Twenty children and adolescents with FASDs (age range 7–15; M = 10.7; SD = 2.4) participated in this study. Participants were recruited from the Western Regional Training Center for Fetal Alcohol Spectrum Disorders at UCLA. Diagnostic procedures are described in detail in previous reports (O'Connor et al.,2006; Sowell et al.,2007). Adult guardians of minor participants underwent an extensive interview to determine maternal alcohol consumption during pregnancy. Although information about the specific amount of maternal alcohol consumption was unable to be ascertained, maternal alcohol use was confirmed by either self‐report, reliable collateral report, or caregiver report. When possible, all instances of self‐report were collaborated with medical and/or legal records. Next, an experienced rater examined all alcohol‐exposed children using the Diagnostic Guide for Fetal Alcohol Spectrum Disorders: The 4‐digit Diagnostic Code (Astley,2004). This diagnostic system rates the expression magnitude of four key diagnostic features of FASDs: (i) growth deficiency; (ii) FAS facial phenotype, including short palpebral fissures, epicanthal folds, smooth philtrum, and thin upper lip; (iii) central nervous system dysfunction; and (iv) history of prenatal alcohol exposure. Ratings on each of these four scales are combined into a single diagnostic code that is then used to classify participants. Using this diagnostic code, four participants were diagnosed with FAS, six with partial FAS, one with sentinel physical findings, and nine with alcohol‐related neurodevelopmental disorder. These groups were combined into a single alcohol‐exposed group for the image analyses.
Table 1.
Demographics and behavioral performance on the verbal Sternberg working memory task for the FASDs and control groups
| Control (N = 20) | FASDs (N = 20) | Group differences | |
|---|---|---|---|
| Demographics | |||
| Age | 10.9 (2.7) | 10.7 (2.4) | None |
| Female/male | 11/9 | 9/11 | None |
| WISC FSIQ | 110.9 (18.0) | 90.2 (15.9) | Con > FASD [t(38) = 3.85, P < 0.0001] |
| Total brain volume | 1,419.1 (160.4) | 1,274.4 (118.0) | Con > FASD [t(38) = 3.25, P = 0.002] |
| Digit span forward | 8.6 (2.1) | 7.1 (1.7) | Con > FASD [t(35) = 2.33, P = 0.026] |
| Digit span backward | 7.7 (2.4) | 6.3 (1.9) | Con > FASD [t(35) = 1.99, P = 0.055] |
| Parent IQ | 112.8 (16.9) | 113.7 (9.6) | None |
| Parent education | 15.5 (3.1) | 16.6 (2.3) | None |
| Family annual income | 7 (2.7) | 7.7 (1.9) | None |
| Task performance | |||
| Accuracy, low | 96 (6.5) | 85 (15) | Con > FASD [t(38) = 2.74, P = 0.009] |
| Accuracy, medium | 92 (15) | 84 (14) | None |
| Accuracy, high | 73 (16) | 64 (19) | None |
| RT, low | 0.808 (0.187) | 0.795 (0.161) | None |
| RT, medium | 0.914 (0.169) | 0.882 (0.162) | None |
| RT, high | 0.925 (0.158) | 0.893 (0.139) | None |
Values presented as mean (SD). Total brain volume is given in cm3. Family annual income is a categorical variable (1 ≤ $5,000, 2 = $5,000–9,999, 3 = $10,000–19,999, 4 = $20,000–29,999, 5 = $30,000–39,999, 6 = $40,000–49,999, 7 = $50,000–74,999, 8 = $75,000–100,000, 9 ≥ $100,000).
Accuracy is percentage correct. Response time (RT) in seconds.
FASDs, fetal alcohol spectrum disorders group; FSIQ, full‐scale IQ.
Twenty typically developing children and adolescents (age range 7–15; M = 10.9; SD = 2.7) were studied as a comparison group. Participants were recruited from the greater Los Angeles area. All comparison participants were screened for neurological impairments, psychiatric illness, history of learning disability, and developmental delay. Individuals presenting with any of these conditions were excluded. Adult guardians of minor participants underwent an extensive interview to determine maternal alcohol consumption during pregnancy. Comparison participants were excluded if they had a history of maternal gestational consumption of one drink or more per week, or more than two drinks on any one occasion. All participants and their parents gave their informed assent/consent to participate in the study, which was approved by the Institutional Review Board of the University of California, Los Angeles. The individuals included in the present study represent a subset of all of the individuals we have studied as part of our ongoing longitudinal research project examining neurodevelopmental outcomes associated with prenatal alcohol exposure. As such, we were able to include only those subjects that met the diagnostic criteria described above, and the behavioral and image quality criteria (described below).
Stimuli and Task Parameters
Subjects performed a parametric verbal Sternberg working memory task, similar to that used by Desmond and colleagues to examine cerebrocerebellar networks in adults (Chen and Desmond,2005; Desmond et al.,2003). Stimuli consisted of a horizontal array of uppercase consonant letters and pound (#) symbols. There were three types of arrays: high WM load (six letters), medium WM load (three letters and three “#” symbols), and low WM load (one letter and five “#” symbols). For the medium and low load stimuli, letter array position was counterbalanced across all possible array positions. Within the task, the overall appearance of a given letter was counterbalanced, as was the order of presentation of load conditions. Stimuli were generated using MacStim 3.0 psychological experimentation software (CogState, West Melbourne, Victoria, Australia) and were visually presented to subjects in the scanner using magnet‐compatible 3‐D goggles (Resonance Technology, Northridge, CA).
Subjects were instructed to remember the letters in each array. Letter arrays were presented for 1.5 seconds, followed by a 3‐second delay (Fig. 1). Following this delay, a lowercase letter probe stimulus was presented for 1.5 seconds. For all load conditions, the probe stimulus matched the previously presented letter(s) on half of the trials. Position of the probe stimulus within the array was counterbalanced. Subjects were instructed to respond by pushing a button with their index finger if the probe stimulus matched an array letter and to push a button with their middle finger when the probe stimulus did not match an array letter. The task consisted of four blocks of each load condition (12 WM blocks total), with four trials in each 24‐second block. Thirteen 12‐second rest blocks, in which subjects fixated on a cross hair, alternated with the WM blocks, for a total task time of 7 minutes, 24 seconds.
Figure 1.
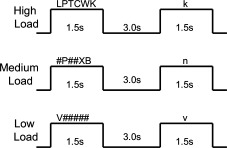
Verbal Sternberg working memory task.
Subjects were trained on the task before the start of the scanning session. Training included a verbal description of the task and then two practice runs, each containing five trials. All subjects were able to perform the task before the start of the scanning session. Once the subject was in the scanner, task instructions were reviewed again before the start of the task. Subjects also participated in a mock scanning session to familiarize them with the MRI environment and to put them at ease with the scanning procedures.
Data Acquisition
Functional imaging data were collected on the UCLA Division of Brain Mapping's research‐dedicated 3 Tesla Siemens Allegra head‐only magnet. Multislice echo‐planar imaging (EPI) was used with a gradient echo EPI sequence. We used a TR of 3 seconds, with a TE of 25. Slice thickness was 3 mm with a 1‐mm skip, 36 total slices, with 64 × 64 pixels yielding an in‐plane resolution of 3 mm with whole‐brain acquisition. A high‐resolution T2‐weighted EPI volume was collected in the anterior commissure‐posterior commissure plane (slice thickness = 3 mm, 36 total axial slices covering the entire brain with 1 mm gaps between slices, TR = 5,000 ms, TE = 33 ms, flip angle = 90 degrees, matrix size 128 × 128 with 1.5 × 1.5 mm in‐plane voxel dimensions), coplanar with the functional scan, to allow for spatial registration of each subject's data into a standard coordinate space.
Image and Statistical Analysis
Functional imaging data were analyzed using FSL [FMRIB's Software Library, http://www.fmrib.ox.ac.uk/fsl/index.html, (Smith et al.,2004)]. Data were corrected for possible motion artifacts by coregistering each BOLD image in the time series to the middle volume in the series using a six‐parameter rigid‐body transformation. Subjects were selected to ensure that head motion did not exceed 2 mm across the scanning session. Slice timing correction was applied to correct each voxel's time series given that slices were acquired in an interleaved fashion. Data were spatially smoothed using a 6‐mm (FWHM) Gaussian kernel and a high‐pass filter cutoff period of 50 seconds was imposed. Finally, all data were registered in a two‐step process. First, each subject's EPI data were registered to their own T2‐weighted structural image with a six‐parameter transformation for within subject analyses, and then to the MNI‐152 standard space template with a 12‐parameter transformation for group averaging (Jenkinson and Smith,2001; Jenkinson et al.,2002).
Single subject analyses were carried out using FMRIB's fMRI Expert Analysis Tool (FEAT, version 5.63). In these analyses, low, medium, and high WM loads were modeled separately. The hemodynamic response function (HRF) was specified as a gamma variate function (mean lag of 6 seconds) and convolved with the modeled components. Statistical analysis of the time series data was carried out using FMRIB's Improved Linear Model (FILM). A voxel‐wise general linear model was applied so that each voxel's time course was individually fit to the model with local autocorrelation correction (Woolrich et al.,2001). Overall WM responses were determined by comparing WM activity (collapsed across loads) with rest. Z‐statistic images were thresholded using clusters determined by Z > 1.7 and a (corrected) cluster significance threshold of P = 0.05.
Higher‐level group analysis was carried out using FLAME (FMRIB's Local Analysis of Mixed Effects). FLAME takes each subject's time series data and models all subjects as one group. Thus, group average responses for the WM contrast were derived. A two‐sample t‐test was used to evaluate group differences activation for the WM contrast.
RESULTS
Demographic and Behavioral Data
Accuracy (percent correct for each WM load) and response time (RT) data for all subjects are presented in Table I. t‐Tests were used to examine group differences for demographic and behavioral measures. Groups did not differ on age [t(38) = 0.185, P = 0.854], and a chi‐square analysis confirmed that sex distributions were not significantly different between groups [χ2 = 0.400, P = 0.527]. As expected, control and alcohol‐exposed subjects did differ on IQ [t(38) = 3.852, P < 0.0001], with control subjects having significantly higher mean IQ relative to subjects with FASDs. There were no group differences on the three measures used to assess socioeconomic status (SES): parent IQ [t(27) = −0.187, P = 0.853], parent education [t(38) = −1.273, P = 0.211], or family annual income [t(37) = −0.871, P = 0.389]. Groups were significantly different for total brain volume [t(38) = 3.249, P = 0.002]. In addition to task performance, we used the digit span forward and backward subtests of the Weschler Intelligence Scale for Children (WISC‐IV), to assess WM function independent of our fMRI analyses. Typically developing children performed significantly better on digits forward relative to alcohol‐exposed individuals [t(35) = 2.330, P = 0.026]. Group differences were at trend level significance for digits backward, with typically developing children performing better than alcohol‐exposed individuals [t(35) = 1.989, P = 0.055].
Control subjects were significantly more accurate on low load trials than subjects with FASDs [t(38) = 2.740, P = 0.009]. There were no significant differences between groups on accuracy for medium [t(38) = 1.797, P = 0.08] or high load trials [t(38) = 1.601, P = 0.118]. There were no group differences on RT for either the low [t(38) = 0.248, P = 0.806], medium [t(38) = 0.602, P = 0.551], or high load conditions [t(38) = 0.693, P = 0.493].
Functional Imaging Data
Given group differences on accuracy for low load trials, but not for medium or high load trials, low load trials were excluded from imaging data analysis. Thus, verbal WM‐related activity was derived by collapsing across medium and high load trials and comparing this activity with rest. This was done to improve our power to detect group differences within our imaging analyses. Talairach coordinates, local maximum Z‐statistic values, and Brodmann areas for all significant clusters of activation for all analyses are presented in Table II. Anatomical locations of neocortical activations were determined using Talairach and Tournoux's stereotaxic atlas (Talairach and Tournoux,1988). Cerebellar anatomical locations were determined using Schmahmann's atlas of the human cerebellum (Schmahmann et al.,2000). Note that space limitations led to rendering of only the most relevant slice views for all analyses described below, and some regions listed in the table of cluster maximums may not be shown in the figures.
Table 2.
Cluster level analyses (P < 0.05) for within group means and between group comparisons for the WM contrast
| Hem. | BA | x | y | z | Local max Z statistic | |
|---|---|---|---|---|---|---|
| Control group mean | ||||||
| Claustrum | R | N/A | 30 | 18 | 8 | 5.84 |
| Posterior cerebellum, IX | R | N/A | 46 | −60 | −32 | 5.91 |
| FASDs group mean | ||||||
| Superior frontal gyrus | L | 6 | 0 | 6 | 54 | 6.46 |
| Posterior cerebellum, VIII | R | N/A | 28 | −62 | −30 | 5.92 |
| Posterior cerebellum, VIIA/VIIB | L | N/A | −46 | −64 | −30 | 5.21 |
| FASDs > controla | ||||||
| Insula | R | 13 | 40 | −22 | 22 | 4.01 |
| Middle temporal gyrus | L | 39 | −42 | −64 | 28 | 4.11 |
Talairach coordinates for the maximum Z value within each significant cluster are presented.
With group IQ differences regressed out.
Alcohol‐Exposed Subjects Versus Control Subjects
Statistical maps showing control and alcohol‐exposed group average activation for combined medium and high WM conditions versus rest are presented in Figure 2. A number of regions commonly associated with verbal WM were active in both control and alcohol‐exposed subjects (Fig. 2A,B), including neocortical activation in diffuse portions of the dorsal lateral prefrontal cortex and superior parietal cortex. Bilateral superior cerebellar activation was also observed in both groups.
Figure 2.
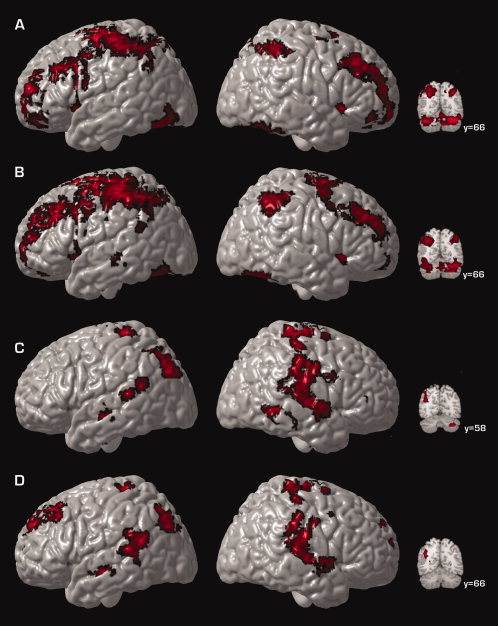
Surface renderings and coronal sections displaying group average activation for control participants (A), group average activation for alcohol‐exposed participants (B), group differences in activation (C), and the difference between these groups when IQ differences are statistically controlled (D) for WM‐related activation. Shown here are regions of significant [Z > 1.7 and a (corrected) cluster significance threshold of P = 0.05] activation collapsed across medium and high WM loads. Regions shown in panels C and D represent regions where alcohol‐exposed subjects display greater activation relative to TD subjects. Voxels are displayed on the brain surface only if they intersect with the surface. Y values correspond to MNI standard space coordinates.
Group differences in WM‐related activation are shown in Figure 2C. WM‐related activation was significantly increased in alcohol‐exposed subjects relative to control subjects in left inferior parietal cortex (BA39), bilateral posterior temporal regions (BA 42), and right inferior cerebellum (Fig. 2C). Given that previous neuropsychological studies have highlighted the importance of examining differences in WM function independent of the differences in global intellectual function that characterize individuals with FASDs (Burden et al.,2005), we next computed group differences in WM‐related activation while statistically controlling for IQ differences by modeling IQ as a covariate. When IQ differences were regressed out, WM‐related activation was significantly increased in alcohol‐exposed subjects relative to control subjects, in left dorsal lateral prefrontal cortex (BA 10), left inferior parietal cortex (BA 39), and bilateral posterior temporal regions (BA 42) (Fig. 2D), suggesting that IQ differences did not completely mediate the group effect. Because differences in brain size between groups can distort activation maps and create an impression of more activation among one group relative to the other, we also computed group differences in activation while statistically controlling for total brain volume. Because the results of this analysis were virtually identical to those where differences in brain size were not controlled, we present the analysis of group membership without the additional covariate of total brain volume.
DISCUSSION
The results of the present study demonstrate that both typically developing children and adolescents and those with histories of heavy prenatal alcohol exposure engage cerebrocerebellar networks in response to verbal WM challenge. However, the extent to which these two groups rely on this network of brain regions differs. Despite equivalent behavioral performance between groups, alcohol‐exposed individuals showed increased activation in bilateral dorsal frontal, left inferior parietal, and bilateral posterior temporal regions during verbal WM, relative to typically developing individuals. These effects remained even when group differences on IQ were statistically controlled. This pattern of increased activation coupled with equivalent behavioral performance between groups suggests that individuals with FASD recruit a more extensive network of brain regions during verbal WM relative to typically developing individuals. These observations may suggest that frontal‐parietal processing during verbal WM is less efficient in alcohol‐exposed individuals.
Previous quantitative neuroimaging studies have shown increases in grey matter thickness (Sowell et al.,2008) in inferior parietal and posterior temporal cortices, predominately in the left hemisphere. The results of the present investigation provide evidence of WM‐related functional activation abnormalities in the same posterior temporal and inferior parietal regions known to have increased grey matter. Findings presented here suggest that increased grey matter does not result in improved or spared function.
Increased left dorsal frontal activation in individuals with FASDs relative to typically developing individuals is consistent with previous reports of altered functioning in this region during verbal learning (Sowell et al.,2007) in some of the same subjects studied here, and response inhibition in an independent sample (Fryer et al.,2007). Although recent evidence suggests increased grey matter thickness in the right dorsal frontal lobe (Sowell et al.,2008) among individuals with FASDs, the results of the present study appear to suggest functional recruitment abnormalities in some brain regions that are structurally relatively unaffected by prenatal exposure to alcohol (Archibald et al.,2001; Sowell et al.,2002a), namely the left dorsal frontal lobe. Thus, despite seemingly structural “normality” in the left frontal lobe in FASDs, several reports have now implicated this region as being functionally abnormal in this population. Taken together, these neuroimaging studies suggest that prenatal alcohol exposure is characterized by functional activation recruitment abnormalities in regions known to be structurally abnormal (inferior parietal and posterior temporal), as well as functional activation recruitment abnormalities in regions thought to be relatively structurally normal (left dorsal frontal cortex).
Dissociating differences in brain activation that are specific to group effects from differences that may be due to general factors related to task performance or overall intellectual function is an important issue in fMRI research. In the present study, alcohol‐exposed and control participants did not display statistically significant differences in task performance for either medium or high WM load trials; however, the groups did differ on accuracy for low load trials. It may be that control participants were performing low load trials at ceiling levels, with 96% accuracy. In contrast, it may be that the amount of increase in task difficulty was not symmetrical between low and medium load and between medium and high loads. Nevertheless, the results presented here are only for trials on which alcohol‐exposed and control participants were matched for task performance. Thus, we can be confident that the group differences in brain activation observed here are not due to differences in task performance.
The FASD and typically developing groups also differed on IQ. While group differences in task performance were not statistically significant, there were still differences in WM between groups on both task performance and in our independent measure of WM function, raising the possibility that differences in brain activation were being driven by some factor other than WM function. Furthermore, previous neuropsychological investigations of WM function in individuals with prenatal alcohol exposure have highlighted the importance of examining differences in WM function that are independent of global differences in intellectual function that are characteristic of individuals with FASDs (Burden et al.,2005). Although IQ scores may be related to WM performance, increased frontal‐parietal activation during WM among FASD individuals relative to controls was observed even when IQ differences were controlled. Thus, we can be confident that group differences in brain activation observed here are not solely due to differences in the global intellectual functioning. This is particularly relevant for our observation of increased activation in dorsal frontal regions among FASD individuals relative to comparison participants during WM. We see this pattern of activation difference only when differences in global intellectual functioning are statistically controlled. Thus, in accordance with behavioral studies, the results of the present study support the notion that WM is a critical component of cognition that is affected by prenatal alcohol exposure, and that one possible neural correlate of impaired WM function is increased frontal‐parietal activation.
In summary, the observation of increased activation in left dorsal frontal, left inferior parietal, and bilateral temporal regions among individuals with FASDs relative to control participants, which is independent of differences in overall intellectual functioning and coupled with equivalent behavioral performance between groups, indicates that individuals with FASD recruit a more extensive network of brain regions during verbal WM. This may suggest that frontal‐parietal processing during verbal WM is inefficient among individuals with FASDs.
REFERENCES
- Archibald SL,Fennema‐Notestine C,Gamst A,Riley EP,Mattson SN,Jernigan TL ( 2001): Brain dysmorphology in individuals with severe prenatal alcohol exposure. Dev Med Child Neurol 43: 148–154. [PubMed] [Google Scholar]
- Astley S ( 2004): Diagnostic Guide for Fetal Alcohol Spectrum Disorders: The 4‐Digit Diagnostic Code. Seattle, WA: The University of Washington. [Google Scholar]
- Baddeley A ( 1986): Working Memory. New York: Oxford University Press. [Google Scholar]
- Baddeley A ( 1992): Working memory. Science 255: 556–559. [DOI] [PubMed] [Google Scholar]
- Baddeley A ( 2003): Working memory: Looking back and looking forward. Nat Rev Neurosci 4: 829–839. [DOI] [PubMed] [Google Scholar]
- Bookheimer SY,Sowell ER ( 2005): Brain imaging in FAS: Commentary on the article by Malisza et al. Pediatr Res 58: 1148–1149. [DOI] [PubMed] [Google Scholar]
- Bookstein FL,Sampson PD,Streissguth AP,Connor PD ( 2001): Geometric morphometrics of corpus callosum and subcortical structures in the fetal‐alcohol‐affected brain. Teratology 64: 4–32. [DOI] [PubMed] [Google Scholar]
- Braver TS,Cohen JD,Nystrom LE,Jonides J,Smith EE,Noll DC ( 1997): A parametric study of prefrontal cortex involvement in human working memory. Neuroimage 5: 49–62. [DOI] [PubMed] [Google Scholar]
- Burden MJ,Jacobson SW,Sokol RJ,Jacobson JL ( 2005): Effects of prenatal alcohol exposure on attention and working memory at 7.5 years of age. Alcohol Clin Exp Res 29: 443–452. [DOI] [PubMed] [Google Scholar]
- Callicott JH,Mattay VS,Bertolino A,Finn K,Coppola R,Frank JA,Goldberg TE,Weinberger DR ( 1999): Physiological characteristics of capacity constraints in working memory as revealed by functional MRI. Cereb Cortex 9: 20–26. [DOI] [PubMed] [Google Scholar]
- Chen SH,Desmond JE ( 2005): Temporal dynamics of cerebro‐cerebellar network recruitment during a cognitive task. Neuropsychologia 43: 1227–1237. [DOI] [PubMed] [Google Scholar]
- Desmond JE,Chen SH,DeRosa E,Pryor MR,Pfefferbaum A,Sullivan EV ( 2003): Increased frontocerebellar activation in alcoholics during verbal working memory: An fMRI study. Neuroimage 19: 1510–1520. [DOI] [PubMed] [Google Scholar]
- Desmond JE,Gabrieli JD,Wagner AD,Ginier BL,Glover GH ( 1997): Lobular patterns of cerebellar activation in verbal working‐memory and finger‐tapping tasks as revealed by functional MRI. J Neurosci 17: 9675–9685. [DOI] [PMC free article] [PubMed] [Google Scholar]
- Fryer SL,Tapert SF,Mattson SN,Paulus MP,Spadoni AD,Riley EP ( 2007): Prenatal alcohol exposure affects frontal‐striatal BOLD response during inhibitory control. Alcohol Clin Exp Res 31: 1415–1424. [DOI] [PubMed] [Google Scholar]
- Jenkinson M,Bannister P,Brady M,Smith S ( 2002): Improved optimization for the robust and accurate linear registration and motion correction of brain images. Neuroimage 17: 825–841. [DOI] [PubMed] [Google Scholar]
- Jenkinson M,Smith S ( 2001): A global optimisation method for robust affine registration of brain images. Med Image Anal 5: 143–156. [DOI] [PubMed] [Google Scholar]
- Jones KL,Smith DW ( 1975): The fetal alcohol syndrome. Teratology 12: 1–10. [DOI] [PubMed] [Google Scholar]
- Kirschen MP,Chen SH,Schraedley‐Desmond P,Desmond JE ( 2005): Load‐ and practice‐dependent increases in cerebro‐cerebellar activation in verbal working memory: An fMRI study. Neuroimage 24: 462–472. [DOI] [PubMed] [Google Scholar]
- Kodituwakku PW,Handmaker NS,Cutler SK,Weathersby EK,Handmaker SD ( 1995): Specific impairments in self‐regulation in children exposed to alcohol prenatally. Alcohol Clin Exp Res 19: 1558–1564. [DOI] [PubMed] [Google Scholar]
- Malisza KL,Allman AA,Shiloff D,Jakobson L,Longstaffe S,Chudley AE ( 2005): Evaluation of spatial working memory function in children and adults with fetal alcohol spectrum disorders: A functional magnetic resonance imaging study. Pediatr Res 58: 1150–1157. [DOI] [PubMed] [Google Scholar]
- Mattson SN,Riley EP ( 1998): A review of the neurobehavioral deficits in children with fetal alcohol syndrome or prenatal exposure to alcohol. Alcohol Clin Exp Res 22: 279–294. [DOI] [PubMed] [Google Scholar]
- Mattson SN,Riley EP,Sowell ER,Jernigan TL,Sobel DF,Jones KL ( 1996): A decrease in the size of the basal ganglia in children with fetal alcohol syndrome. Alcohol Clin Exp Res 20: 1088–1093. [DOI] [PubMed] [Google Scholar]
- O'Connor MJ,Frankel F,Paley B,Schonfeld AM,Carpenter E,Laugeson EA,Marquardt R ( 2006): A controlled social skills training for children with fetal alcohol spectrum disorders. JConsult Clin Psychol 74: 639–648. [DOI] [PMC free article] [PubMed] [Google Scholar]
- O'Hare ED,Kan E,Yoshii J,Mattson SN,Riley EP,Thompson PM,Toga AW,Sowell ER ( 2005): Mapping cerebellar vermal morphology and cognitive correlates in prenatal alcohol exposure. Neuroreport 16: 1285–1290. [DOI] [PubMed] [Google Scholar]
- Rasmussen C ( 2005): Executive functioning and working memory in fetal alcohol spectrum disorder. Alcohol Clin Exp Res 29: 1359–1367. [DOI] [PubMed] [Google Scholar]
- Rasmussen C,Horne K,Witol A ( 2006): Neurobehavioral functioning in children with fetal alcohol spectrum disorder. Child Neuropsychol 12: 453–468. [DOI] [PubMed] [Google Scholar]
- Riley EP,McGee CL ( 2005): Fetal alcohol spectrum disorders: An overview with emphasis on changes in brain and behavior. Exp Biol Med 230: 357–365. [DOI] [PubMed] [Google Scholar]
- Riley EP,McGee CL,Sowell ER ( 2004): Teratogenic effects of alcohol: A decade of brain imaging. Am J Med Genet 127C: 35–41. [DOI] [PubMed] [Google Scholar]
- Roebuck TM,Mattson SN,Riley EP ( 1999): Behavioral and psychosocial profiles of alcohol‐exposed children. Alcohol Clin Exp Res 23: 1070–1076. [PubMed] [Google Scholar]
- Rypma B,Prabhakaran V,Desmond JE,Glover GH,Gabrieli JD ( 1999): Load‐dependent roles of frontal brain regions in the maintenance of working memory. Neuroimage 9: 216–226. [DOI] [PubMed] [Google Scholar]
- Schmahmann JD,Doyon J,Toga AW,Petrides M,Evans AC ( 2000): MRI Atlas of the Human Cerebellum. San Diego, CA: Academic Press. [DOI] [PubMed] [Google Scholar]
- Smith EE,Jonides J ( 1998): Neuroimaging analyses of human working memory. Proc Natl Acad Sci USA 95: 12061–12068. [DOI] [PMC free article] [PubMed] [Google Scholar]
- Smith EE,Jonides J,Marshuetz C,Koeppe RA ( 1998): Components of verbal working memory: Evidence from neuroimaging. Proc Natl Acad Sci USA 95: 876–882. [DOI] [PMC free article] [PubMed] [Google Scholar]
- Smith SM,Jenkinson M,Woolrich MW,Beckmann CF,Behrens TE,Johansen‐Berg H,Bannister PR,De Luca M,Drobnjak I,Flitney DE,Niazy RK,Saunders J,Vickers J,Zhang Y,De Stefano N,Brady JM,Matthews PM ( 2004): Advances in functional and structural MR image analysis and implementation as FSL. Neuroimage 23( Suppl 1): S208–S219. [DOI] [PubMed] [Google Scholar]
- Sowell ER,Jernigan TL,Mattson SN,Riley EP,Sobel DF,Jones KL ( 1996): Abnormal development of the cerebellar vermis in children prenatally exposed to alcohol: Size reduction in lobules I‐V. Alcohol Clin Exp Res 20: 31–34. [DOI] [PubMed] [Google Scholar]
- Sowell ER,Lu LH,O'Hare ED,McCourt ST,Mattson SN,O'Connor MJ,Bookheimer SY ( 2007): Functional magnetic resonance imaging of verbal learning in children with heavy prenatal alcohol exposure. Neuroreport 18: 635–639. [DOI] [PubMed] [Google Scholar]
- Sowell ER,Mattson SN,Kan E,Thompson PM,Riley EP,Toga AW ( 2008): Abnormal cortical thickness and brain‐behavior correlation patterns in individuals with heavy prenatal alcohol exposure. Cereb Cortex 18: 136–144. [DOI] [PMC free article] [PubMed] [Google Scholar]
- Sowell ER,Mattson SN,Thompson PM,Jernigan TL,Riley EP,Toga AW ( 2001a): Mapping callosal morphology and cognitive correlates: Effects of heavy prenatal alcohol exposure. Neurology 57: 235–244. [DOI] [PubMed] [Google Scholar]
- Sowell ER,Mattson SN,Thompson PM,Tessner KD,Jernigan TL,Riley EP,Toga AW ( 2001b): Voxel‐based morphometric analyses of the brain in children and adolescents prenatally exposed to alcohol. Neuroreport 12: 515–523. [DOI] [PubMed] [Google Scholar]
- Sowell ER,Thompson PM,Mattson SN,Tessner KD,Jernigan TL,Riley EP,Toga AW ( 2002a): Regional brain shape abnormalities persist into adolescence after heavy prenatal alcohol exposure. Cereb Cortex 12: 856–865. [DOI] [PubMed] [Google Scholar]
- Sowell ER,Thompson PM,Peterson BS,Mattson SN,Welcome SE,Henkenius AL,Riley EP,Jernigan TL,Toga AW ( 2002b): Mapping cortical gray matter asymmetry patterns in adolescents with heavy prenatal alcohol exposure. Neuroimage 17: 1807–1819. [DOI] [PubMed] [Google Scholar]
- Streissguth AP,Bookstein FL,Barr HM,Sampson PD,O'Malley K,Young JK ( 2004): Risk factors for adverse life outcomes in fetal alcohol syndrome and fetal alcohol effects. J Dev Behav Pediatr 25: 228–238. [DOI] [PubMed] [Google Scholar]
- Talairach J,Tourneaux P ( 1988): Co‐planar stereotaxic atlas of the human brain. Stuttgart: Thieme. [Google Scholar]
- Woolrich MW,Ripley BD,Brady M,Smith SM ( 2001): Temporal autocorrelation in univariate linear modeling of FMRI data. Neuroimage 14: 1370–1386. [DOI] [PubMed] [Google Scholar]