

Abstract
Though fetal alcohol syndrome (FAS) and fetal alcohol spectrum disorders are among the most common developmental disorders, their understanding is incomplete. Diffusion tensor imaging (DTI), which is sensitive to microstructural organization in white matter, may provide a relevant measure in this population demonstrating incompletely characterized white matter pathology. In this study, tract‐based spatial statistics (TBSS) routine and a skeleton‐based region of interest analyses were employed to detect differences in DTI‐derived metrics between young adults who were alcohol exposed and an unexposed control group. Participants include 28 with dysmorphic features associated with FAS, 29 who were prenatally exposed but do not show physical effects, and 25 with the same low socioeconomic status but unexposed. The TBSS analysis revealed a statistically significant decrease in fractional anisotropy at the isthmus of the corpus callosum and its connected callosal fibers in dysmorphic individuals relative to controls (clusterwise P FWE < 0.05). This finding was consistent with that of the follow‐up skeleton‐based region of interest analysis (F(2,79) = 3.256, p = 0.044). In addition, the patterns in axial and radial diffusivity changes suggest that demyelination may be associated with the degraded white matter integrity observed in the dysmorphic group. Hum Brain Mapp, 2009. © 2009 Wiley‐Liss, Inc.
Keywords: fetal alcohol spectrum disorder, diffusion tensor imaging, corpus callosum, voxelwise, region of interest, demyelination
INTRODUCTION
Fetal alcohol syndrome (FAS) and the spectrum of its associated disorders are often associated with macrostructural brain abnormalities [Bookstein et al.,2001], neurocognitive deficits [Coles et al.,1997], and behavioral alterations in the affected individuals [Connor et al.,2000; Wass et al.,2002]. Those who do not meet the criterion for the full syndrome are described as having partial FAS or as falling on a continuum of effects called the fetal alcohol spectrum disorder (FASD) [Burden et al.,2005a, b; Schonfeld et al.,2001]. Although it is among the most common developmental disorders, the understanding of the brain‐behavior relationship in this disorder is incomplete. Currently, the majority of the published imaging studies of the effects of prenatal alcohol exposure focus on morphology evaluation [Bookstein et al.,2001, 2002; Sowell et al.,2001]. One consistent finding of these studies is a reduction of brain volume relative to control groups among those diagnosed with FAS. In addition, several studies reported relative reductions in the white matter of the corpus callosum and in the parietal lobe in FAS patients. These reductions are not statistically significant in prenatal alcohol‐exposed individuals who do not meet criteria for FAS, with a trend of volume reductions in certain cortical brain areas [Archibald et al.,2001; Sowell et al.,2001].
Diffusion tensor imaging (DTI) offers the opportunity to examine the effects on white matter. By measuring water diffusion in tissue along at least six noncollinear directions in space, DTI maps the directional dependence of water diffusion. It provides the ability to detect microstructural abnormalities of white matter [Basser and Pierpaoli,1996; Basser et al.,1994] and has been widely used in the study of various diseases [Le Bihan et al.,2001; Sundgren et al.,2004]. Two important measures derived from DTI data are fractional anisotropy (FA) and mean diffusivity (MD). FA quantifies the directional dependence of diffusion [Pierpaoli and Basser,1996] and MD reflects average diffusion. Conditions that affect axonal development or damage axons are usually reflected as reduced FA and elevated MD [Schmithorst et al.,2002; Sullivan and Pfefferbaum,2003; Wieshmann et al.,1999]. Recent work has demonstrated the possibility of more specific understanding of white matter pathologies based on DTI data [Pierpaoli et al.,2001; Song et al.,2002, 2003]. The three eigenvalues (λ1, λ2, λ3) of the diffusion tensor matrix can be further separated into components parallel (λ1) and perpendicular (λ2, λ3) to local axon tracts, with the former defined as axial diffusivity (AD, λ1) and the average of the latter two defined as radial diffusivity [RD, (λ2 + λ3)/2]. Studies have shown that AD and RD exhibit different patterns of change when the underlying pathological alterations are different, for example, lack of myelin integrity or axonal damage [Song et al.,2002, 2003] (see Discussion for details). Thus, the patterns of directional diffusivity alteration may be useful in inferring underlying pathological mechanisms in FAS.
To date, several studies have investigated how the integrity of white matter is affected by prenatal alcohol exposure using DTI [Lebel et al.,2008; Ma et al.,2005; Sowell et al.,2008a; Wozniak et al.,2006]. Ma et al. examined the corpus callosum in a relatively small sample of prenatally exposed young adults with physical dysmorphia using regions of interest (ROIs) manually drawn on T1‐weighted images and found that alcohol‐affected young adults exhibited decreased FA and increased MD in the genu and the splenium compared to unexposed controls [Ma et al.,2005]. Wozniak et al. studied 14 prenatally exposed children with FASDs using 6 circular ROIs with an area of 13 mm2 defined on the corpus callosum. They observed that relative to unexposed controls, those with a history of prenatal alcohol exposure but no physical dysmorphia (FASDs) showed only increased MD and unchanged FA in the isthmus of the corpus callosum, but no changes in the other regions. Sowell et al. used a voxel‐based morphometry (VBM)‐style approach to analyze both the T1‐weighted images and DTI data of 17 children and adolescents with FASDs [Sowell et al.,2008a]. They detected lower FA in individuals with FASDs in the right lateral temporal lobe and bilaterally in the lateral aspects of the splenium of the corpus callosum. A correlation between the FA in the splenium and the behavior measure was also observed in the study. A more recent study [Lebel et al.,2008] using deterministic tractography and ROI analysis on 24 children with FASDs partly supported the findings of previous studies, that is, white matter abnormalities in the splenium of the corpus callosum [Ma et al.,2005] and in the temporal lobe [Sowell et al.,2008a]. Moreover, by delineating the major white matter pathways and calculating the mean FA and MD within the tracts‐of‐interest, they identified white matter degradation associated with FASD in several additional areas that had not been implicated previously.
Recently, researchers have applied VBM‐style approach to ascertain differences in DTI‐derived scalar measures such as FA. Spatial registration is performed either using structural images or using FA images directly [Eriksson et al.,2001; Rugg‐Gunn et al.,2001; Simon et al.,2005]. However, there has been much debate about the strengths and limitations of VBM for characterizing group differences in DTI data. First, an accurate alignment of each subject's FA image to a common space or that of another subject cannot be guaranteed by using low‐dimensional nonlinear registration method, often leading to misinterpretation of residual misalignments in the subsequent statistical results [Simon et al.,2005]. Although it is possible for some nonlinear registration methods to allow for warping between images by breaking the topography of the images distorted, it still does not guarantee accurate registration. Second, statistical inferences based on voxelwise comparison of FA images among groups is dependent on the size of the smoothing kernel used [Jones et al.,2005]. To overcome these issues, a fully automated alternative, tract‐based spatial statistics (TBSS), was introduced [Smith et al.,2006, 2007]. TBSS addresses the issues that hinder DTI group comparison by high‐dimensional nonlinear registration, followed by projection onto an alignment‐invariant tract representation. Since high‐dimensional nonlinear registration is used, no smoothing is required to compensate for the imperfect registration that may arise in the low dimensional nonlinear registration. Thus, TBSS is potentially a more robust solution for multiple‐subject comparisons of DTI data and is used in this study.
ROI analysis involves defining ROIs in the brain within which to make measurements. In this study, a skeleton‐based ROI analysis, based on extracting ROIs from the skeletons of the corpus callosum derived using TBSS analysis, was employed. This skeleton‐based ROI approach not only offers a power advantage for detecting hypothesized effects, but also minimizes the partial volume effect due to thinning of the corpus callosum in many subjects with dysmorphia. The interpretation of these skeleton‐based ROI results, however, needs to be made with caution; it is more a region‐based follow‐up to the voxelwise TBSS method, considering that the resultant mean DTI measures in this ROI analysis are not completely independent from those in the TBSS voxelwise analysis.
This article is organized as follows. We first describe a voxelwise analysis using TBSS to investigate the differences in DTI‐derived measures among individuals who are exposed and physically affected, prenatally exposed but nondysmorphic, and unexposed controls. Then, we describe our skeleton‐based ROI analysis on the six corpus callosum ROIs to examine the differences in mean FA, MD, AD, and RD among the groups. Our hypotheses were: (1) that prenatal exposure to alcohol is associated with deficits in white matter integrity as measured by DTI and that it might be possible to relate these deficits to the extent of dysmorphia; (2) that TBSS and skeleton‐based ROI analysis have enough sensitivity to detect the deficits and provide results consistent with our previous study and those by the other researchers.
METHODS
Participants
The 82 participants in this study, ages from 19 to 27 years (see Table I for details), were recruited from a longitudinal cohort first identified prenatally. The mothers of participants were recruited when they applied for prenatal care at a large urban obstetrical service serving a primarily African‐American, low socioeconomic status population. At that time, women who reported taking at least two drinks per week as well as those who denied any alcohol use were eligible for participation. During a prenatal interview, women provided information about their alcohol and other drug use as well as demographic information. Infants born to these mothers were evaluated in the first few days postpartum and followed longitudinally. During these postnatal examinations, participants were evaluated using a dysmorphia scale [Coles et al.,1985] that identified the physical features associated with prenatal alcohol exposure [Jones and Smith,1973]. The sample was followed and re‐evaluated periodically using both the dysmorphia scale and standardized measures of ability (i.e., IQ; [Wechsler,1991, 1999]. For the current study, a subsample of this cohort was identified and invited to participate in the imaging study. Three groups were included in the current study: (1) Dysmorphic (DYSM) group (n = 28): prenatal alcohol exposure according to maternal report and having a dysmorphia score at least one standard deviation above the mean of all alcohol‐exposed members of the cohort at one of four points in time; (2) Exposed but not dysmorphic (ETOH) group (n = 29): prenatal alcohol exposure according to maternal report with a dysmorphia score less than 1 standard deviation from the mean and an IQ score equivalent to those of members of the dysmorphic group. IQ testing for this classification was performed during a previous assessment when participants were at a mean age of 14.9 years; (3) Control group (CONT) (n = 25). These participants were also identified prenatally as part of the cohort and followed longitudinally. Their mothers reported not using any alcohol during pregnancy. Participants (DYSM or ETOH) have never received a formal evaluation for FAS as part of this study and, therefore, are not diagnosed as having this disorder. Rather, they are categorized based on the degree to which they demonstrated physical and neurodevelopmental effects consistent with prenatal alcohol exposure. Characteristics of the three groups and their mothers' substance use during pregnancy are provided in Table I. IQ scores shown in this table were collected at the current adult assessment. During the time of the prenatal recruitment, cocaine was not yet widely used and, although more alcohol‐using women also used cocaine, the figures do not reflect frequent/heavy use in this cohort.
Table I.
Demographic, prenatal exposure, and growth characteristics by exposure group
| Variable | Group | Statistic | Significance | ||
|---|---|---|---|---|---|
| Control (n = 25)a | DYSM (n = 28)a | ETOH (n = 29)a | |||
| Gender—% male | 48 | 42.9 | 20.7 | X 2 (2) = 5.037 | p = 0.081 |
| Ethnicity—% African‐American | 100 | 100 | 96.6 | X 2 (2) = 1.850 | n.s. |
| Age at imaging, M (SD) | 22.8 (1.71) | 22.9 (2.0) | 23.0 (1.8) | F(2,79) = 0.153 | n.s. |
| Monthly income—$ in past 30 days, M (SD) n = 81 | 1243 (1805) | 1157 (1103) | 620 (444) | F(2,78) = 2.164 | n.s. |
| Education completed—years, M (SD) n = 81 | 12.3 (1.6) | 11.9 (1.6) | 11.6 (1.5) | F(2,78) = 1.424 | n.s. |
| Adult Full‐scale IQb, M (SD) n = 81 | 84 (9.1) | 78 (11.7) | 81 (11.3) | F(2,78) = 1.983 | n.s. |
| Dysmorphia rating at adult visit, M (SD) n = 81 | 3.2 (3.2) | 9.3 (7.3) | 4.0 (3.6) | F(2,78) = 11.259 | p < 0.001 |
| Birth weight—g, M (SD)c | F(2,76) = 9.904 | p < 0.001 | |||
| Male | 3352.5 (470.1) | 2807.1 (654.6) | 3155.0 (152.7) | ||
| Female | 2930.3 (375.6) | 2351.9 (629.1) | 3182.2 (542.5) | ||
| Adult weight—lbs., M (SD) n = 79c | F(2,73) = 8.432 | p = 0.001 | |||
| Male | 207.2 (57.6) | 171.1 (47.3) | 216.7 (57.4) | ||
| Female | 193.0 (49.1) | 132.8 (29.4) | 181.5 (48.7) | ||
| Adult height—in., M (SD) n = 80c | F(2,74) = 1.011 | n.s. | |||
| Male | 70.3 (2.6) | 68.6 (2.6) | 69.3 (2.6) | ||
| Female | 64.2 (1.6) | 63.8 (3.4) | 64.5 (2.5) | ||
| Adult head circumference —cm, M (SD) n = 80c | F(2,74) = 6.378 | p < 0.01 | |||
| Male | 59.7 (1.8) | 56.6 (2.7) | 59.0 (1.4) | ||
| Female | 58.1 (3.6) | 55.7 (3.3) | 57.4 (2.9) | ||
| Amount of alcohol exposure during pregnancy —Ounces of absolute alcohol per week, M (SD) | 0 (0) | 14.7 (14.1) | 8.7 (14.2) | F(2,79) = 10.236 | p < 0.001 |
| Cigarettes per day during pregnancy —M(SD), n = 81 | 3.8 (6.1) | 13.2 (11.1) | 7.2 (7.6) | F(2,73) = 7.743 | p = 0.001 |
| Marijuana joints per week pregnancy —M(SD) n = 67 | 0.26 (0.9) | 2.3 (9.0) | 0.88 (3.2) | F(2,64) = 0.814 | n.s. |
| Cocaine during pregnancy —% using, n = 79 | 0 | 4 | 20.7 | x 2 (2) = 8.187 | p = 0.017 |
If data for a variable are not available for some participants, the n used for the analysis is noted next to the variable name.
WASI IQ obtained at current testing.
Two‐way Group × Gender analyses of variance were completed for growth variables. In addition to group effects noted in table, gender was significant for birthweight, adult weight, and adult height and borderline (p < 0.057) for adult head circumference. No interaction effects were significant.
Procedure
Individuals who were eligible for the study were identified from the cohort database and were contacted by mail or phone. The nature of the research study was explained to them and their participation requested. Those who agreed completed an informed consent procedure approved by the University's Institutional Review Committee. The experiments were undertaken with the understanding and written consent of each subject, with the approval of the appropriate local ethics committee, and in compliance with national legislation and the Code of Ethical Principles for Medical Research Involving Human Subjects of the World Medical Association (Declaration of Helsinki). During this procedure, the information obtained previously from the participants' mothers regarding their alcohol and drug use was kept confidential. Participants were transported by study staff to the research laboratory for an evaluation and to the hospital where neuroimaging was carried out. Usually, these activities took place on separate days. On the first day, participants completed the consent procedures and ability testing with the Wechsler Abbreviated Scale of Intelligence [Wechsler,1999] and were screened to assure that they could be imaged. Conditions screened for included pregnancy, presence of metal in the body that might be affected by the magnet, obesity that would prevent imaging, and fear of being inside the magnet. At the second session, participants were trained on imaging protocols and completed the protocol. Participants received compensation for the time involved in their participation.
Data Acquisition
MRI was performed on a Siemens 3T Trio scanner (TIM, Siemens Medical System, Malvern, PA). DTI data were acquired with a diffusion‐weighted, single‐shot, spin‐echo echo planar imaging sequence. A dual spin‐echo technique combined with bipolar gradients was used to minimize eddy current effects [Alexander et al.,1997]. The parameters used for DTI data acquisition are as follows: diffusion weighting gradients applied in 12 directions with a b value of 1,000 s/mm2 and four averages in each direction; repetition time of 7,700 ms, echo time of 90 ms, field of view of 220 × 220 mm2, matrix size of 128 × 96 with partial Fourier reconstructed to 128 × 128, slice thickness of 2 mm with no gap, 34 slices. The data coverage in the inferior–superior direction of the brain is shown in Figure 1 (vertical arrow, totally 64 mm). A total of four images without diffusion weighting (b = 0 s/mm2) were acquired. The total scan time was ∼10 min.
Figure 1.
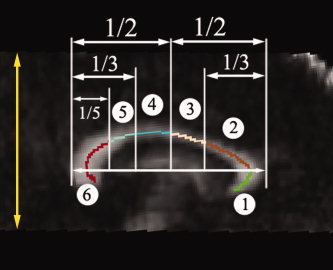
The mid‐sagittal plane of the corpus callosum with the thickness of 3 mm was chosen for ROI analysis. The corpus callosum is divided into six subregions: (1) Genu (CCg), (2) Rostral Body (CCr), (3) Anterior Midbody (CCa), (4) Posterior Midbody (CCp), (5) Isthmus (CCi), and (6) Splenium (CCs). The vertical arrow shows the approximate volume acquired for DTI scans in the inferior–superior direction. [Color figure can be viewed in the online issue, which is available at www.interscience.wiley.com.]
DTI Data Analysis
Voxelwise analysis using TBSS
Voxelwise statistical analysis of the FA data was carried out using TBSS implemented in FSL 4.0 (FMRIB, Oxford. http://www.fmrib.ox.ac.uk/fsl/). Eddy current distortion was corrected to compensate for the stretch and shear in the diffusion‐weighted images. As only the central portion of the brain was scanned for the DTI data, all FA images were aligned onto a population‐specific FA template derived from all of the subjects instead of the standard FMRIB58 FA template, using a nonlinear registration algorithm implemented in the TBSS package (see below). The mean FA image was then created and thinned to generate a mean FA skeleton that represents the centers of all tracts common to the group. This was thresholded with FA > 0.3 to include major white matter pathways, but exclude peripheral tracts where there was significant intersubject variability and/or partial volume effects with gray matter. Each subject's aligned FA map was then projected onto this skeleton by assigning each point on the skeleton with the maximum FA in a plane perpendicular to the local skeleton structure. The resulting skeletons were fed into voxelwise statistics. Using the same mean skeleton, a similar TBSS analysis was also applied to the MD, AD (λ1), and RD [(λ2 + λ3)/2] maps.
To create a population‐specific FA template, a two‐stage procedure was used. First, each subject's FA map was registered to FMRIB58 FA template (FMRIB, Oxford. http://www.fmrib.ox.ac.uk/fsl/) using rigid body transformation with six degree of freedom. Second, the registered FA images were averaged and each individual FA image was registered on the averaged FA image using an affine registration with 12 degree of freedom. The affine‐registered FA images were subsequently averaged to create the population‐specific FA template for this study.
Skeleton‐based ROI analysis
For ROI analysis, the focus in this study was on the differences in the corpus callosum among the three groups, as the corpus callosum is particularly vulnerable to degradation in white matter integrity [Bhatara et al.,2002; Swayze et al.,1997]. The skeletonized FA maps from all of the subjects were obtained using the nonlinear registration method described above, followed by projecting with FA values from the nearest local tract through searching a plane perpendicular to the local skeleton structure for the maximum value in the subject's FA map. A Matlab program was written (Matlab7, Mathworks) to automatically divide the skeleton of the corpus callosum on the midsagittal plane (3 mm thick) into six subregions: genu, rostral body, anterior midbody, posterior midbody, isthmus, and splenium (Fig. 1). The boundaries of these subregions shown in Figure 1 were defined according to a method documented elsewhere [Ota et al.,2006]. These subregions were projected onto each subject's space using the warping field derived from registering FA values (see above) and used to derive the average FA (MD, AD, or RD) values. These DTI metrics were then calculated and compared among the three groups.
Statistical Analysis
The thresholded skeletons of FA, MD, AD, and RD were fed into a permutation‐based statistical inference algorithm [Nichols and Holmes,2002], which does not require the assumption of Gaussian distribution of the data, to test for the significance of cluster size. The test proceeds by shuffling the subjects in each pair, computing the cluster sizes and recording the size of the largest cluster (thresholded at t > 2.5). In this way, the null distribution was generated via 10,000 random permutations. The family wise error (FWE) rate is exact for the test (set at P FWE < 0.05), which means that the probability of one or more Type I errors is the same as the significance level.
A univariate analysis of variance following multivariate analysis of variance using Statistical Package for the Social Sciences 15.0 (SPSS, Chicago, IL) was conducted to compare the mean differences of FA, MD, AD, and RD values in each subregion of the corpus callosum. Multiple comparison procedure with Tukey HSD test (α = 0.05) was then carried out to discriminate the groups with significantly different DTI‐derived measures. Pearson's correlations were used for detecting the relationships between the dysmorphia rating, WASI full scale IQ, and DTI measures.
RESULTS
TBSS Analysis of FA, MD, AD, and RD
The comparison between the DYSM group and unexposed controls revealed that there is a statistically significant decrease in FA (P FWE < 0.05) at the isthmus of the corpus callosum in the DYSM group (see Fig. 2). The area of significance extends to the lateral callosal fibers. Comparisons of FA images between the ETOH and control groups as well as between DYSM and ETOH groups showed no significant differences (P FWE < 0.05). No significant clusters were detected in the tests of group differences in MD, AD, and RD among the three groups (P FWE < 0.05).
Figure 2.
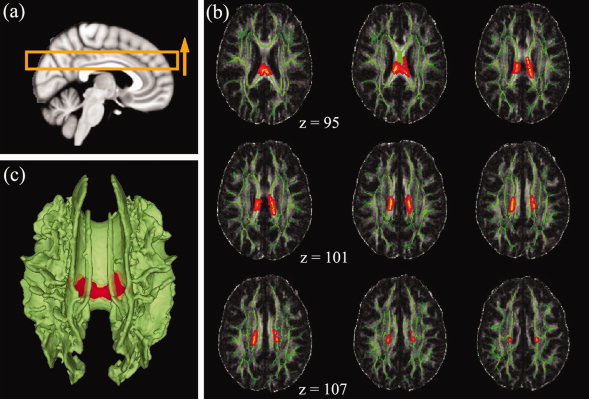
The results of TBSS analysis among the CONT, DYSM, and ETOH groups. (a) The schematic of the positions of the selected volume shown in (b); the yellow arrow shows the order of the axial slices starting from upper left corner of (b); (b) FA difference maps (red) superimposed on the mean FA skeletons (green, thresholded at FA > 0.3) of the 82 subjects between CONT and DYSM group pair. The isthmus and the lateral branches of the isthmus part of the corpus callosum in DYSM group showed significantly lower FA values than those of the control group (clusterwise, P FWE < 0.05); (c) 3D rendering of the FA difference maps (red) superimposed on the mean FA skeletons (green, thresholded at FA > 0.3) (clusterwise P FWE < 0.05).
Skeleton‐Based ROI Analysis
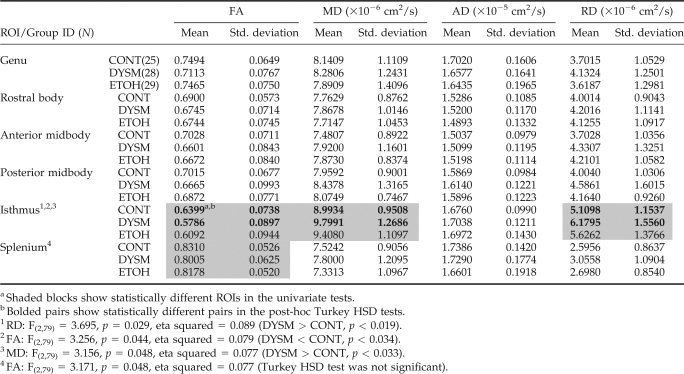
The detailed descriptive statistics of the skeleton‐based ROI data are shown in Table II. The four DTI measures from the six corpus callosum ROIs were compared among the three exposure groups using multivariate analysis of variance. To test whether gender affects these DTI metrics, our analysis included both gender and group as fixed factors in the multivariate analysis. This was a concern, because the gender of the subjects in the ETOH group was not evenly distributed. The overall effect (Wilks' λ) of gender was not significant for FA (F(6,71) = 1.383, p = 0.233), MD (F(6,71) = 1.405, p = 0.224), AD (F(6,71) = 2.170, p = 0.056), or RD (F(6,71) = 1.630, p = 0.151) and no interactions were seen between gender and group factors. The overall multivariate test (Wilks' λ) of exposure group effect was significant for RD (F(12,144) = 1.909, p = 0.038), approaching significance for FA (F(12,144) = 1.815, p = 0.051) and MD (F(12,144) = 1.634, p = 0.088), but not for AD (F(12,144) = 1.154, p = 0.322).
Table II.
Group means (standard deviations) and statistical analysis for skeleton‐based ROI outcomes
|
Univariate analysis of variance showed significant FA differences among the three groups at the isthmus (F(2,79) = 3.256, p = 0.044) and the splenium (F(2,79) = 3.171, p = 0.048). The differences at the isthmus among the three groups were also detected for MD (F(2,79) = 3.156, p = 0.048) and RD (F(2,79) = 3.695, p = 0.029). Posthoc pairwise comparisons between groups using Tukey HSD tests confirmed these differences between DYSM and controls. The univariate test result of the FA differences in the splenium was not confirmed by the posthoc tests using Tukey HSD method, probably due to the conservative nature of the test. Differences between ETOH and CONT as well as ETOH and DYSM were not significant (Tukey HSD method, p > 0.2) in the four DTI metrics, even though a continuum of the mean DTI measures was observed among the three groups (Table II). Correlations of dysmorphia ratings at adult visit and WASI full scale IQ were conducted with the four DTI measures in DYSM and ETOH groups, and no significant correlations (Pearson correlation coefficient < 0.3, p > 0.05) were observed between the scores and DTI measurements in the two prenatally exposed groups. The results of the univariate tests and the posthoc pairwise tests after multiple comparison corrections are also shown in Table II.
To compare our results in the ETOH group with that in Wozniak's study [Wozniak et al.,2006], we conducted a one‐way ANOVA in the six ROIs only between the CONT and ETOH groups on FA and MD without multiple comparison correction. In contrast to the results in their study, no significant differences on the FA and MD between the two groups were seen in our data.
DISCUSSION
The results of this study demonstrate that prenatal alcohol exposure affects white matter integrity in the corpus callosum, specifically in the isthmus and posterior regions and that these effects are most consistently found in individuals who also exhibit the physical characteristics of exposure. As a result of this and several previous studies, the usefulness of DTI as a method for identification of such neurological alterations is confirmed. In our previous study [Ma et al.,2005], we included only very affected, dysmorphic individuals and unexposed controls. In the present study, we increased the number of dysmorphic individuals studied and included some who were less severely affected. In addition, we included a group of young adults who were prenatally alcohol exposed and matched for cognitive level, but who showed no external physical effects (ETOH). In including this nondysmorphic group, we sought to re‐examine the conclusion of other investigators [Wozniak et al.,2006] that nondysmorphic but alcohol‐exposed individuals exhibit neurological alterations similar to those in dysmorphic individuals. We anticipated that by matching ability level, we would assure a similar level of structural and microstructural alterations in brain if these alterations were not related to external physical characteristics.
The present results confirmed alteration of white matter integrity in the DYSM group, including a significant FA decrease in the isthmus and a trend of FA decrease in the splenium and the genu (F(2,79) = 2.884, p = 0.062) (Table II). These results are consistent with our previous study, although in that smaller study only the FA in the genu and splenium were investigated with significant differences found between DYSM and control groups [Ma et al.,2005]. In contrast, no statistically significant differences (Tukey HSD method, p > 0.2) of white matter integrity were seen when comparing the nondysmorphic group with the other two groups, respectively. However, the results (see Table II) suggest that mean of the DTI measures of the nondysmorphic individuals fall between those of the dysmorphic and the unexposed groups. Further research is necessary to understand the pattern of results in relation to both extent of exposure and characteristics of the exposed.
Examination of patterns in the observed white matter abnormalities, particularly AD and RD, found in alcohol‐affected individuals may allow inferences about pathology [Basser,1995; Basser et al.,2000]. Both axonal loss and demyelination can cause DTI measures to vary, but different etiologies are associated with different patterns of directional diffusivity changes. These possibilities were explored by Song et al. in a shiverer mice model characterized by incomplete myelin formation but intact axons [Song et al.,2002]. In these mice, they observed significantly higher RD but unchanged AD in the shiverer mice versus age‐matched controls [Song et al.,2002]. To further test the hypothesis that AD and RD reflect axon and myelin pathologies, they examined a mouse model of retinal ischemia and observed a significant AD change 3 days after ischemia with no detectable demyelination. Increased RD was observed 5 days after ischemia, consistent with histological findings of myelin degeneration at that time [Song et al.,2003]. The potential of RD as a specific assessment of demyelination and remyelination was further supported in a mouse cuprizone model [Song et al.,2005]. These results indicate that AD and RD might be more sensitive markers than FA or RA (which are summary parameters) in differentiating myelin loss and axonal injury. In the present study, skeleton‐based ROI analysis found that, at the isthmus, AD did not differ between DYSM and control groups while RD was elevated in the DYSM group (Table II). Therefore, the pattern of changes in directional diffusivities (AD unchanged, RD increased) suggests demyelination as the main pathological mechanism for white matter abnormalities in DYSM participants. However, this conjecture is tentative and needs to be confirmed with histological studies. Postmortem studies of chronic alcoholics reported a degradation of brain white matter microstructure including demyelination [Alling and Bostrom,1980; Kril et al.,1997], but no such studies have been done to ascertain the effects of prenatal exposure.
In DTI studies that examine the corpus callosum, findings have been more frequent in the isthmus and posterior regions. It is of interest to speculate whether there is any indication that associated areas of the cerebral cortex support behavioral functions that are altered as a result of prenatal exposure. The relationship of callosal fibers to the division of the cerebral cortex has been studied in nonhuman primates [Cipolloni and Pandya,1985; Pandya et al.,1971; Seltzer and Pandya,1983] and in humans [Abe et al.,2004; Huang et al.,2005]. de Lacoste [de Lacoste et al.,1985] found that the isthmus contains fibers coursing from the peri‐Sylvian region. Recent diffusion MR studies have successfully parcellated corpus callosum based on its connections to the different cortical lobes [Abe et al.,2004; Alexander et al.,1997; Huang et al.,2005], and the results are similar to de Lacoste's. These MR tractography‐based parcellation studies show that, even with large individual differences, the major callosal fibers coursing through isthmus are connected with the sensory‐motor [Alexander et al.,1997] and parietal cortex [Abe et al.,2004; Huang et al.,2005; Mazerolle et al.,2008]. These cortices have been shown to play important roles in interhemispheric visuo‐motor integration [Iacoboni and Zaidel,2004] and transfer of tactile information [Fabri et al.,2001]. Archibald et al. employed a volumetric approach to study regional pattern of brain hypoplasia resulting from prenatal exposure to alcohol and concluded that the parietal cortices are particularly vulnerable to the teratogenic effects of prenatal alcohol exposure [Archibald et al.,2001]. Sowell's group have made similar observations [Sowell et al.,2008b]. In neuropsychological studies of behavior in affected individuals, visual/spatial deficits have been documented frequently, although not exclusively [Conry,1990; Mattson et al.,1998]. Of note is the study by Sowell et al., in which a correlation between decreased FA in the splenium and compromised visuo‐motor ability in the alcohol‐exposed individuals was observed [Sowell et al.,2008a], suggesting an avenue for further investigation.
A review of the very limited literature on DTI in alcohol‐exposed individuals suggests substantial similarities in outcomes. The differences that are observed may result from the research designs [Lebel et al.,2008; Ma et al.,2005; Sowell et al.,2008a]. In our earlier study [Ma et al.,2005], those in the DYSM group had higher dysmorphia scores and lower IQs and, if physical dysmorphia is a predictor of DTI results, difference in outcome can be expected and can be useful in informing our understanding of these phenomena. In addition, ours are the only studies of young adults. Other published studies were of children and adolescents [Lebel et al.,2008; Sowell et al.,2008a; Wozniak et al.,2006], and there may be different developmental trajectories of brain structures as a function of prenatal exposure. Another methodological difference results from the assumptions associated with the use of TBSS. Although it is designed to resolve the alignment inaccuracies in VBM‐style approach and aims for higher sensitivity, objectivity, and interpretability, TBSS is applied under a general assumption that alterations in the white matter skeleton are representative of the changes in all white matter tracts [Smith et al.,2006]. This assumption is acceptable, but could be invalid under certain circumstances, causing false‐negatives in the statistical inferences. For example, TBSS used in this study may not be able to detect the differences at “the lateral aspects of the splenium of the corpus callosum” reported by Sowell et al. [2008a], as only the maximal local FA values at the splenium would be projected onto the representative skeleton and fed into the following statistics. Last, limited DTI data coverage and ROI sampling regions as well as the relatively stringent statistics (cluster‐size multiple comparison correction P FWE < 0.05, t > 2.5) could reduce the number of significant findings in this study. Further investigations with whole‐brain diffusion data are needed to elucidate the differences in the results reported here and those by the other researchers.
Another potential limitation should be considered. The most significant differences in white matter integrity between the DYSM and control groups were found in the isthmus of the corpus callosum, which is the narrowest part of the corpus callosum in the midsagittal plane. Looking closely at the isthmus in the T1 structural and DTI images revealed that even though only the skeletons of the corpus callosum of the midsagittal plane were investigated in the current ROI analysis, partial volume effects might still play a role at our DTI resolution (1.7 × 1.7 × 2 mm3). Because of the thinning of corpus callosum suffered by many DYSM participants, the detected difference at this subregion might be a result of both the pathological alteration of tissue integrity and partial voluming. However, in the genu and splenium, partial volume effects are negligible and the trends of reduced FA observed in the DYSM compared with the control group should be mostly due to underlying changes in tissue microstructure. Finally, while the prenatal identification of this sample and the inclusion of a socioeconomic status‐matched control group answers many of the objections that are usually raised regarding potential confounds in clinically identified samples, in human studies it is impossible to control all of the factors that may impact neurodevelopment and some differences among these groups remain including both prenatal exposure to drugs other than alcohol and a variety of postnatal environmental factors.
CONCLUSIONS
This study examined DTI outcomes among two groups of prenatally exposed young adults, those showing significant physical effects (DYSM) and those without such effects, but matched for level of cognitive functioning (ETOH) and compared them to unexposed controls using TBSS as well as a follow‐up ROI analysis of DTI data. In comparison to unexposed controls, in the ETOH group, differences in DTI‐derived measures did not reach significance, while in the DYSM group, decreases in FA in the isthmus of the corpus callosum were revealed by both voxelwise and skeleton‐based ROI analysis. These findings indicate that prenatal alcohol exposure affects white matter integrity in the corpus callosum particularly in dysmorphic individuals although there is a suggestion that a continuum of effects exists. In addition, given the patterns of changes observed in radial and axial diffusivities, demyelination emerges as a possible mechanism for the alterations of white matter in the exposed group. Overall, our findings support the view that significant changes of the corpus callosum are associated with prenatal alcohol exposure. The compromised white matter integrity at the callosum and its connected areas may account for some of the functional and behavioral deficits observed in affected individuals.
REFERENCES
- Abe O,Masutani Y,Aoki S,Yamasue H,Yamada H,Kasai K,Mori H,Hayashi N,Masumoto T,Ohtomo K( 2004): Topography of the human corpus callosum using diffusion tensor tractography. J Comput Assist Tomogr 28: 533–539. [DOI] [PubMed] [Google Scholar]
- Alexander AL,Tsuruda JS,Parker DL( 1997): Elimination of eddy current artifacts in diffusion‐weighted echo‐planar images: The use of bipolar gradients. Magn Reson Med 38: 1016–1021. [DOI] [PubMed] [Google Scholar]
- Alling C,Bostrom K ( 1980): Demyelination of the mamillary bodies in alcoholism. A combined morphological and biochemical study. Acta Neuropathol 50: 77–80. [DOI] [PubMed] [Google Scholar]
- Archibald SL,Fennema‐Notestine C,Gamst A,Riley EP,Mattson SN,Jernigan TL ( 2001): Brain dysmorphology in individuals with severe prenatal alcohol exposure. Dev Med Child Neurol 43: 148–154. [PubMed] [Google Scholar]
- Basser PJ ( 1995): Inferring microstructural features and the physiological state of tissues from diffusion‐weighted images. NMR Biomed 8: 333–344. [DOI] [PubMed] [Google Scholar]
- Basser PJ,Pierpaoli C ( 1996): Microstructural and physiological features of tissues elucidated by quantitative‐diffusion‐tensor MRI. J Magn Reson B 111: 209–219. [DOI] [PubMed] [Google Scholar]
- Basser PJ,Mattiello J,LeBihan D ( 1994): Estimation of the effective self‐diffusion tensor from the NMR spin echo. J Magn Reson B 103: 247–254. [DOI] [PubMed] [Google Scholar]
- Basser PJ,Pajevic S,Pierpaoli C,Duda J,Aldroubi A ( 2000): In vivo fiber tractography using DT‐MRI data. Magn Reson Med 44: 625–632. [DOI] [PubMed] [Google Scholar]
- Bhatara VS,Lovrein F,Kirkeby J,Swayze V II,Unruh E,Johnson V ( 2002): Brain function in fetal alcohol syndrome assessed by single photon emission computed tomography. S D J Med 55: 59–62. [PubMed] [Google Scholar]
- Bookstein FL,Sampson PD,Streissguth AP,Connor PD ( 2001): Geometric morphometrics of corpus callosum and subcortical structures in the fetal‐alcohol‐affected brain. Teratology 64: 4–32. [DOI] [PubMed] [Google Scholar]
- Bookstein FL,Sampson PD,Connor PD,Streissguth AP ( 2002): Midline corpus callosum is a neuroanatomical focus of fetal alcohol damage. Anat Rec 269: 162–174. [DOI] [PubMed] [Google Scholar]
- Burden MJ,Jacobson SW,Jacobson JL ( 2005a) Relation of prenatal alcohol exposure to cognitive processing speed and efficiency in childhood. Alcohol Clin Exp Res 29: 1473–1483. [DOI] [PubMed] [Google Scholar]
- Burden MJ,Jacobson SW,Sokol RJ,Jacobson JL ( 2005b) Effects of prenatal alcohol exposure on attention and working memory at 7.5 years of age. Alcohol Clin Exp Res 29: 443–452. [DOI] [PubMed] [Google Scholar]
- Cipolloni PB,Pandya DN ( 1985): Topography and trajectories of commissural fibers of the superior temporal region in the rhesus monkey. Exp Brain Res 57: 381–389. [DOI] [PubMed] [Google Scholar]
- Coles CD,Smith I,Fernhoff PM,Falek A ( 1985): Neonatal neurobehavioral characteristics as correlates of maternal alcohol use during gestation. Alcohol Clin Exp Res 9: 454–460. [DOI] [PubMed] [Google Scholar]
- Coles CD,Platzman KA,Raskind‐Hood CL,Brown RT,Falek A,Smith IE ( 1997): A comparison of children affected by prenatal alcohol exposure and attention deficit, hyperactivity disorder. Alcohol Clin Exp Res 21: 150–161. [PubMed] [Google Scholar]
- Connor PD,Sampson PD,Bookstein FL,Barr HM,Streissguth AP ( 2000): Direct and indirect effects of prenatal alcohol damage on executive function. Dev Neuropsychol 18: 331–354. [DOI] [PubMed] [Google Scholar]
- Conry J ( 1990): Neuropsychological deficits in fetal alcohol syndrome and fetal alcohol effects. Alcohol Clin Exp Res 14: 650–655. [DOI] [PubMed] [Google Scholar]
- de Lacoste MC,Kirkpatrick JB,Ross ED ( 1985): Topography of the human corpus callosum. J Neuropathol Exp Neurol 44: 578–591. [DOI] [PubMed] [Google Scholar]
- Eriksson SH,Rugg‐Gunn FJ,Symms MR,Barker GJ,Duncan JS ( 2001): Diffusion tensor imaging in patients with epilepsy and malformations of cortical development. Brain 124 (Part 3): 617–626. [DOI] [PubMed] [Google Scholar]
- Fabri M,Polonara G,Del Pesce M,Quattrini A,Salvolini U,Manzoni T ( 2001): Posterior corpus callosum and interhemispheric transfer of somatosensory information: An fMRI and neuropsychological study of a partially callosotomized patient. J Cogn Neurosci 13: 1071–1079. [DOI] [PubMed] [Google Scholar]
- Huang H,Zhang J,Jiang H,Wakana S,Poetscher L,Miller MI,van Zijl PC,Hillis AE,Wytik R,Mori S ( 2005): DTI tractography based parcellation of white matter: Application to the mid‐sagittal morphology of corpus callosum. Neuroimage 26: 195–205. [DOI] [PubMed] [Google Scholar]
- Iacoboni M,Zaidel E ( 2004): Interhemispheric visuo‐motor integration in humans: The role of the superior parietal cortex. Neuropsychologia 42: 419–425. [DOI] [PubMed] [Google Scholar]
- Jones DK,Symms MR,Cercignani M,Howard RJ ( 2005): The effect of filter size on VBM analyses of DT‐MRI data. Neuroimage 26: 546–554. [DOI] [PubMed] [Google Scholar]
- Jones KL,Smith DW ( 1973): Recognition of the fetal alcohol syndrome in early infancy. Lancet 2: 999–1001. [DOI] [PubMed] [Google Scholar]
- Kril JJ,Halliday GM,Svoboda MD,Cartwright H ( 1997): The cerebral cortex is damaged in chronic alcoholics. Neuroscience 79: 983–998. [DOI] [PubMed] [Google Scholar]
- Le Bihan D,Mangin JF,Poupon C,Clark CA,Pappata S,Molko N,Chabriat H ( 2001): Diffusion tensor imaging: Concepts and applications. J Magn Reson Imaging 13: 534–546. [DOI] [PubMed] [Google Scholar]
- Lebel C,Rasmussen C,Wyper K,Walker L,Andrew G,Yager J,Beaulieu C ( 2008): Brain diffusion abnormalities in children with fetal alcohol spectrum disorder. Alcohol Clin Exp Res 32: 1732–1740. [DOI] [PubMed] [Google Scholar]
- Ma X,Coles CD,Lynch ME,Laconte SM,Zurkiya O,Wang D,Hu X ( 2005): Evaluation of corpus callosum anisotropy in young adults with fetal alcohol syndrome according to diffusion tensor imaging. Alcohol Clin Exp Res 29: 1214–1222. [DOI] [PubMed] [Google Scholar]
- Mattson SN,Riley EP,Gramling L,Delis DC,Jones KL ( 1998): Neuropsychological comparison of alcohol‐exposed children with or without physical features of fetal alcohol syndrome. Neuropsychology 12: 146–153. [DOI] [PubMed] [Google Scholar]
- Mazerolle EL,D'Arcy RC,Beyea SD ( 2008): Detecting functional magnetic resonance imaging activation in white matter: Interhemispheric transfer across the corpus callosum. BMC Neurosci 9: 84. [DOI] [PMC free article] [PubMed] [Google Scholar]
- Nichols TE,Holmes AP ( 2002): Nonparametric permutation tests for functional neuroimaging: A primer with examples. Hum Brain Mapp 15: 1–25. [DOI] [PMC free article] [PubMed] [Google Scholar]
- Ota M,Obata T,Akine Y,Ito H,Ikehira H,Asada T,Suhara T ( 2006): Age‐related degeneration of corpus callosum measured with diffusion tensor imaging. Neuroimage 31: 1445–1452. [DOI] [PubMed] [Google Scholar]
- Pandya DN,Karol EA,Heilbronn D ( 1971): The topographical distribution of interhemispheric projections in the corpus callosum of the rhesus monkey. Brain Res 32: 31–43. [DOI] [PubMed] [Google Scholar]
- Pierpaoli C,Basser PJ ( 1996): Toward a quantitative assessment of diffusion anisotropy. Magn Reson Med 36: 893–906. [DOI] [PubMed] [Google Scholar]
- Pierpaoli C,Barnett A,Pajevic S,Chen R,Penix LR,Virta A,Basser P ( 2001): Water diffusion changes in Wallerian degeneration and their dependence on white matter architecture. Neuroimage 13 (6 Part 1): 1174–1185. [DOI] [PubMed] [Google Scholar]
- Rugg‐Gunn FJ,Eriksson SH,Symms MR,Barker GJ,Duncan JS ( 2001): Diffusion tensor imaging of cryptogenic and acquired partial epilepsies. Brain 124 (Part 3): 627–636. [DOI] [PubMed] [Google Scholar]
- Schmithorst VJ,Wilke M,Dardzinski BJ,Holland SK ( 2002): Correlation of white matter diffusivity and anisotropy with age during childhood and adolescence: A cross‐sectional diffusion‐tensor MR imaging study. Radiology 222: 212–218. [DOI] [PMC free article] [PubMed] [Google Scholar]
- Schonfeld AM,Mattson SN,Lang AR,Delis DC,Riley EP ( 2001): Verbal and nonverbal fluency in children with heavy prenatal alcohol exposure. J Stud Alcohol 62: 239–246. [DOI] [PubMed] [Google Scholar]
- Seltzer B,Pandya DN ( 1983): The distribution of posterior parietal fibers in the corpus callosum of the rhesus monkey. Exp Brain Res 49: 147–150. [DOI] [PubMed] [Google Scholar]
- Simon TJ,Ding L,Bish JP,McDonald‐McGinn DM,Zackai EH,Gee J ( 2005): Volumetric, connective, and morphologic changes in the brains of children with chromosome 22q11.2 deletion syndrome: An integrative study. Neuroimage 25: 169–180. [DOI] [PubMed] [Google Scholar]
- Smith SM,Jenkinson M,Johansen‐Berg H,Rueckert D,Nichols TE,Mackay CD,Watkins KE,Ciccarelli O,Cader MZ,Matthews PM,Behrens TE ( 2006): Tract‐based spatial statistics: Voxelwise analysis of multi‐subject diffusion data. Neuroimage 31: 1487–1505. [DOI] [PubMed] [Google Scholar]
- Smith SM,Johansen‐Berg H,Jenkinson M,Rueckert D,Nichols TE,Miller KL,Robson MD,Jones DK,Klein JC,Bartsch AJ,Behrens TE ( 2007): Acquisition and voxelwise analysis of multi‐subject diffusion data with tract‐based spatial statistics. Nat Protoc 2: 499–503. [DOI] [PubMed] [Google Scholar]
- Song SK,Sun SW,Ramsbottom MJ,Chang C,Russell J,Cross AH ( 2002): Dysmyelination revealed through MRI as increased radial (but unchanged axial) diffusion of water. Neuroimage 17: 1429–1436. [DOI] [PubMed] [Google Scholar]
- Song SK,Sun SW,Ju WK,Lin SJ,Cross AH,Neufeld AH ( 2003): Diffusion tensor imaging detects and differentiates axon and myelin degeneration in mouse optic nerve after retinal ischemia. Neuroimage 20: 1714–1722. [DOI] [PubMed] [Google Scholar]
- Song SK,Yoshino J,Le TQ,Lin SJ,Sun SW,Cross AH,Armstrong RC ( 2005): Demyelination increases radial diffusivity in corpus callosum of mouse brain. Neuroimage 26: 132–140. [DOI] [PubMed] [Google Scholar]
- Sowell ER,Thompson PM,Mattson SN,Tessner KD,Jernigan TL,Riley EP,Toga AW ( 2001): Voxel‐based morphometric analyses of the brain in children and adolescents prenatally exposed to alcohol. Neuroreport 12: 515–523. [DOI] [PubMed] [Google Scholar]
- Sowell ER,Johnson A,Kan E,Lu LH,Van Horn JD,Toga AW,O'Connor MJ,Bookheimer SY ( 2008a) Mapping white matter integrity and neurobehavioral correlates in children with fetal alcohol spectrum disorders. J Neurosci 28: 1313–1319. [DOI] [PMC free article] [PubMed] [Google Scholar]
- Sowell ER,Mattson SN,Kan E,Thompson PM,Riley EP,Toga AW ( 2008b) Abnormal cortical thickness and brain‐behavior correlation patterns in individuals with heavy prenatal alcohol exposure. Cereb Cortex 18: 136–144. [DOI] [PMC free article] [PubMed] [Google Scholar]
- Sullivan EV,Pfefferbaum A ( 2003): Diffusion tensor imaging in normal aging and neuropsychiatric disorders. Eur J Radiol 45: 244–255. [DOI] [PubMed] [Google Scholar]
- Sundgren PC,Dong Q,Gomez‐Hassan D,Mukherji SK,Maly P,Welsh R ( 2004): Diffusion tensor imaging of the brain: Review of clinical applications. Neuroradiology 46: 339–350. [DOI] [PubMed] [Google Scholar]
- Swayze VW II,Johnson VP,Hanson JW,Piven J,Sato Y,Giedd JN,Mosnik D,Andreasen NC ( 1997): Magnetic resonance imaging of brain anomalies in fetal alcohol syndrome. Pediatrics 99: 232–240. [DOI] [PubMed] [Google Scholar]
- Wass TS,Simmons RW,Thomas JD,Riley EP ( 2002): Timing accuracy and variability in children with prenatal exposure to alcohol. Alcohol Clin Exp Res 26: 1887–1896. [DOI] [PubMed] [Google Scholar]
- Wechsler D ( 1991): Wechsler Intelligence Scale for Children: Manual. New York: Harcourt Brace. [Google Scholar]
- Wechsler D ( 1999): Wechsler Abbreviated Scale of Intelligence (WASI). San Antonio, TX: Harcourt Assessment. [Google Scholar]
- Wieshmann UC,Clark CA,Symms MR,Franconi F,Barker GJ,Shorvon SD ( 1999): Reduced anisotropy of water diffusion in structural cerebral abnormalities demonstrated with diffusion tensor imaging. Magn Reson Imaging 17: 1269–1274. [DOI] [PubMed] [Google Scholar]
- Wozniak JR,Mueller BA,Chang PN,Muetzel RL,Caros L,Lim KO ( 2006): Diffusion tensor imaging in children with fetal alcohol spectrum disorders. Alcohol Clin Exp Res 30: 1799–1806. [DOI] [PMC free article] [PubMed] [Google Scholar]