Abstract
The increasing frequency of Enterococcus faecium isolates with multidrug resistance is a serious clinical problem given the severely limited number of therapeutic options available to treat these infections. Oritavancin is a promising new alternative in clinical development that has potent antimicrobial activity against both staphylococcal and enterococcal vancomycin-resistant pathogens. Using solid-state NMR to detect changes in the cell-wall structure and peptidoglycan precursors of whole cells after antibiotic-induced stress, we report that vancomycin and oritavancin have different modes of action in E. faecium. Our results show the accumulation of peptidoglycan precursors after vancomycin treatment, consistent with transglycosylase inhibition, but no measurable difference in cross-linking. In contrast, after oritavancin exposure, we do not observe the accumulation of peptidoglycan precursors. Instead, the number of cross-links is significantly reduced, showing that oritavancin primarily inhibits transpeptidation. We propose that the activity of oritavancin is the result of a secondary-binding interaction with the E. faecium peptidoglycan. The hypothesis is supported by results from 13C{19F} REDOR experiments on whole cells enriched with L-[1-13C]lysine and complexed with desleucyl [19F]oritavancin. These experiments establish that an oritavancin derivative with a damaged D-Ala-D-Ala binding pocket still binds to E. faecium peptidoglycan. The 13C{19F} REDOR dephasing maximum indicates that the secondary-binding site of oritavancin is specific to nascent and template peptidoglycan. We conclude that the inhibition of transpeptidation by oritavancin in E. faecium is the result of the large number of secondary-binding sites relative to the number of primary-binding sites.
Keywords: bacterial cell wall, glycopeptide antibiotics, peptidoglycan, REDOR, solid-state NMR
Introduction
Vancomycin-resistant Enterococcus faecium infections have increased dramatically since first reported in 1986.1 Multidrug resistance is now common in the majority of clinical E. faecium isolates.2 These pathogens present a serious risk to hospitalized patients suffering from comorbid conditions and declined immune function.3 Despite the recent emergence of novel clinically available antibiotics, treatment options for multidrug-resistant E. faecium infections remain severely limited, underscoring the urgency to find new therapeutic alternatives.
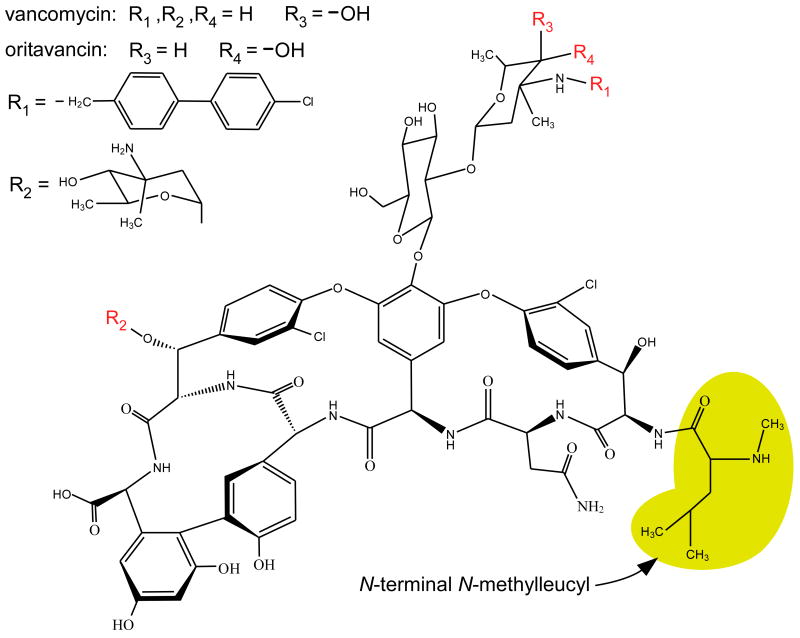
Oritavancin, a promising antibiotic currently in clinical development, shows potent bactericidal activity against both staphylococcal and enterococcal vancomycin-resistant organisms.4-6 Oritavancin is a semisynthetic derivative of a vancomycin analogue (Scheme 1) characterized by p-chlorophenylbenzyl and epi-vancosamine substituents. It is generally accepted that vancomycin and oritavancin inhibit bacterial cell-wall biosynthesis by binding to the D-Ala-D-Ala of peptidoglycan precursors (Scheme 2).7 Vancomycin resistance is usually thought to involve the modification of D-Ala-D-Ala to D-Ala-D-Lac.8 Although oritavancin is active against vancomycin-resistant E. faecium, the two drugs have equivalent D-Ala-D-Ala binding clefts. However, the minimum inhibitory concentration (MIC) of oritavancin is 500 times less than that of vancomycin for resistant E. faecium, and 8 times less for susceptible isolates.6,9,10 The molecular mechanism involved with the improved activity of oritavancin in E. faecium is unknown and is a main focus of the work presented here.
Scheme 1.
Chemical structure of vancomycin and oritavancin. [19F]oritavancin has fluorine instead of chlorine at R1. The N-terminal N-methylleucyl residue, which is removed in desleucyl vancomycin and desleucyl oritavancin, is highlighted in yellow.
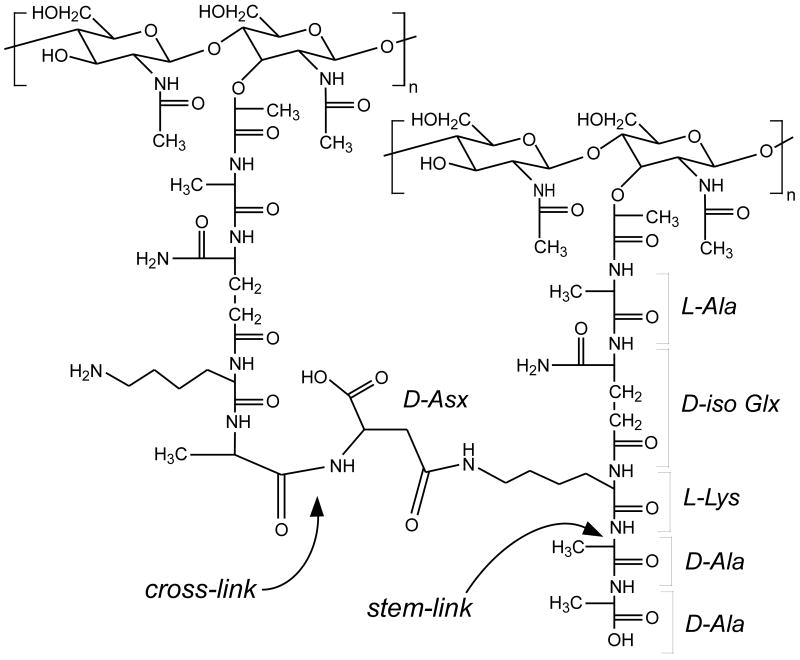
Scheme 2.
Chemical structure of E. faecium peptidoglycan. The repeat unit on the right is stem-linked but has an uncross-linked pentapeptide stem; that is, the stem is a cross-link donor but is not a cross-link acceptor. The repeat unit on the left is stem-linked and cross-linked; that is, this stem is a cross-link acceptor but not a cross-link donor. The D-Asp bridge may be amidated.
Only a limited number of studies have investigated the mode of action of vancomycin and its analogs in E. faecium specifically, despite the clinical relevance. The pioneering work on the vancomycin activity by Strominger and coworkers11,12 preceded the emergence of high-level vancomycin-resistant enterococci. Experimental insights from analyses of a variety of bacterial organisms, often extended to E. faecium, may not be applicable considering the organization of the enterococcal cell wall and the potentially unique tertiary structure. Moreover, many of the experiments examining the effects of vancomycin have led to inconsistent conclusions with respect to peptidoglycan cross-linking, sugar-chain extension, and drug dimerization.13-16
In this report, we unambiguously establish the modes of action of vancomycin and oritavancin in E. faecium using solid-state NMR to detect structural changes in the cell wall after a generation time of sublethal exposure to the antibiotics. Additionally, we use rotational-echo double-resonance (REDOR) NMR to characterize the peptidoglycan-binding sites of [19F]oritavancin and des-N-methylleucyl-[19F]oritavancin in E. faecium whole cells. Des-N-methylleucyl-oritavancin (desleucyl oritavancin) is the Edman degradation product of oritavancin in which the N-terminal N-methylleucyl residue is removed from the aglycon core (see Scheme 1), thereby destroying the drug's capacity to bind to D-Ala-D-Ala of the bacterial cell wall. But desleucyl oritavancin retains antimicrobial activity against E. faecium.17 By comparing REDOR results from [19F]oritavancin and desleucyl [19F]oritavancin, we distinguish between two unique peptidoglycan binding motifs and assign a mode of action to each.
Results and Discussion
Cell-wall characterization to determine glycopeptide activity
The final steps of peptidoglycan biosynthesis involve incorporation of membrane-bound peptidoglycan precursors into existing cell wall by glycan-chain extension (transglycosylation) and cross-linking (transpeptidation).18 Both polymerization reactions are essential for cell-wall integrity and perturbation of either process seriously threatens bacterial survival. To determine the effects of vancomycin and oritavancin on transglycosylation and transpeptidation, we investigated the cell-wall structure of E. faecium after sublethal exposure to the antibiotics. Each drug was added at either 15 or 25 μg/ml to cultures in mid-exponential growth phase (OD660≈ 0.4), and the cells were harvested for analysis approximately 45 min later. It is important to emphasize that all comparative analyses are from cultures grown in parallel. That is, control and antibiotic-treated samples were always prepared simultaneously under identical conditions and harvested together. Thus, all the peptidoglycan structural changes we report are the result of antibiotic-induced stress. In general, the effects we observe for 15 and 25 μg/ml concentrations of vancomycin and oritavancin are not significantly different. Given the complexity of the analysis, we only discuss results obtained after drug treatments at 25 μg/ml. The results for both concentrations are summarized in Tables 1 and 2.
Table 1.
Distribution of D-Ala in peptidoglycan of the drug-treated whole cells of E. faecium (mid-exponential growth) of Figures 3 and 7.
| D-Ala-D-Asp [%] | D-Ala-D-Ala [%] | D-Ala [%] | |
|---|---|---|---|
| No vancomycin* | 76 | 24 | 0 |
| 15 μg/ml vancomycin | 48 | 47 | 5 |
| 25 μg/ml vancomycin | 45 | 48 | 7 |
| No oritavancin | 76 | 24 | 0 |
| 15 μg/ml oritavancin | 83 | 17 | 0 |
| 25 μg/ml oritavancin | 89 | 11 | 0 |
On the basis of three different growths, the relative concentrations are ±1 of those shown (e.g., 76 ±1%).
Table 2.
Distribution of tripeptides in peptidoglycan of the drug-treated whole cells of E. faecium (mid-exponential growth) of Figures 4 and 8.
| Stem-linked [%] | Tripeptides [%] | |
|---|---|---|
| No vancomycin | 60 | 40 |
| 15 μg/ml vancomycin | 65 | 35 |
| 25 μg/ml vancomycin | 65 | 35 |
| No oritavancin | 63 | 37 |
| 15 μg/ml oritavancin | 37 | 63 |
| 25 μg/ml oritavancin | 31 | 69 |
On the basis of three different growths, the relative concentrations are ±2 of those shown (e.g., 60 ±2%).
Vancomycin inhibits transglycosylation
Cells treated with and without vancomycin were grown in D-[1-13C]alanine and D-[15N]aspartic acid enriched media in the presence of alaphosphin. Isomerization of D- and L-alanine is prevented by alaphosphin, an alanine racemase inhibitor, as was confirmed in E. faecium previously.19 D-alanine is exclusively incorporated into E. faecium peptidoglycan and alanyl ester teichoic and lipoteichoic acids.20 The various D-Ala contributions can be experimentally distinguished in 13C solid-state NMR measurements of whole cells,19 allowing our investigation of glycopeptide activity without any of the digestions or extractions that are typically required with other techniques.
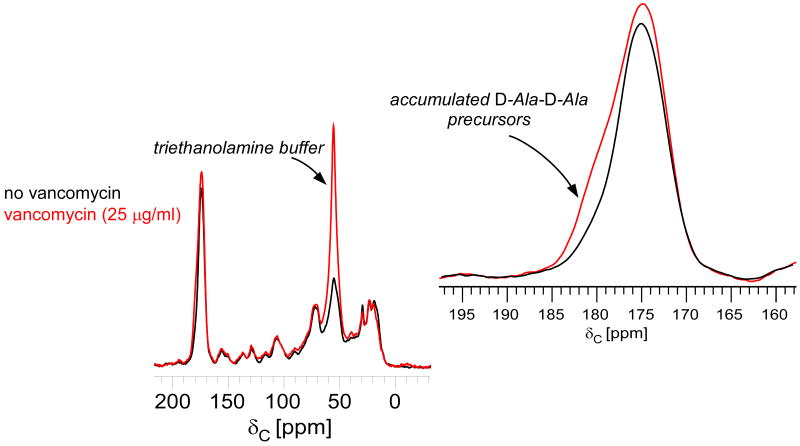
The 13C CPMAS echo spectrum of whole cells treated with vancomycin shows a significant change in the line shape of the carbonyl peak centered around 175 ppm relative to control samples grown without the drug (Figure 1). Qualitatively, the D-Ala contribution at 178 ppm increases in the presence of vancomycin, consistent with increased concentrations of terminal carboxyl D-Ala. Peptidoglycan repeat units containing terminal carboxyl D-Ala are not fully cross-linked (Scheme 2). When a cross-link is created between two adjacent peptidoglycan subunits, a D,D-transpeptidase removes the terminal D-Ala5 of the acceptor pentapeptide as the remaining penultimate D-Ala4 forms a peptide bond to the amino group of a D-Asx (D-Asn or D-Asp) of the donor bridge.21 The 13C CPMAS spectra of D-Ala enriched whole cells are normalized with respect to the natural-abundance, aliphatic-carbon signal intensities between 0 and 35 ppm to show relative changes in the concentration of cell wall, peptidoglycan precursors, and teichoic acid after drug treatment. The normalization does not affect the analysis and the conclusions related to transglycosylation.
Figure 1.
13C CPMAS echo spectra of E. faecium whole cells enriched with D-[1-13C]alanine, grown in the presence of alaphosphin and no vancomycin (black) or 25 μg/ml vancomycin (red). The spectra are normalized with respect to the natural-abundance, aliphatic-carbon signal intensities between 0 and 35 ppm. The line shape of the peak centered around 175 ppm changes with the addition of vancomycin (inset). The D-Ala contribution at 178 ppm, whose signal results from a terminal carboxyl D-Ala, increases with vancomycin exposure as transglycosylase is inhibited and Park's nucleotide accumulates in the cytoplasm.
It was established previously for E. faecium that uncross-linked peptidoglycan stems in mature cell wall do not contain D-Ala.19,22 In mature E. faecium peptidoglycan, the D-Ala-D-Ala of uncross-linked stems is cleaved by an active carboxypeptidase. Hence, the change in lineshape at 178 ppm in the presence of vancomycin is specific to an increased concentration of labeled cytoplasmic peptidoglycan precursors containing terminal carboxyl D-Ala, the signature of transglycosylase inhibition.23,24
Inhibition of transglycosylase in E. faecium is detected by 13C{15N} REDOR experiments performed on whole cells enriched with D-[1-13C]alanine and D-[15N]aspartic acid, grown in the presence of alaphosphin. While inhibition of transglycosylase and inhibition of transpeptidase both lead to uncross-linked pentapeptides, only the former affects the one-bond maximum 13C{15N} REDOR dephasing in E. faecium. Uncross-linked pentapeptides resulting from transpeptidase inhibition are cleaved by L,D-carboxypeptidase in mature cell wall and therefore do not show up in the 13C CPMAS spectra of cells enriched with D-[1-13C]Ala. In contrast, the accumulated peptidoglycan precursors resulting from transglycosylase inhibition occur in the cytoplasm and are not affected by L,D-carboxypeptidase activity. The D-Ala-D-Ala containing precursors are not cross-linked and therefore lower the one-bond maximum 13C{15N} REDOR dephasing.
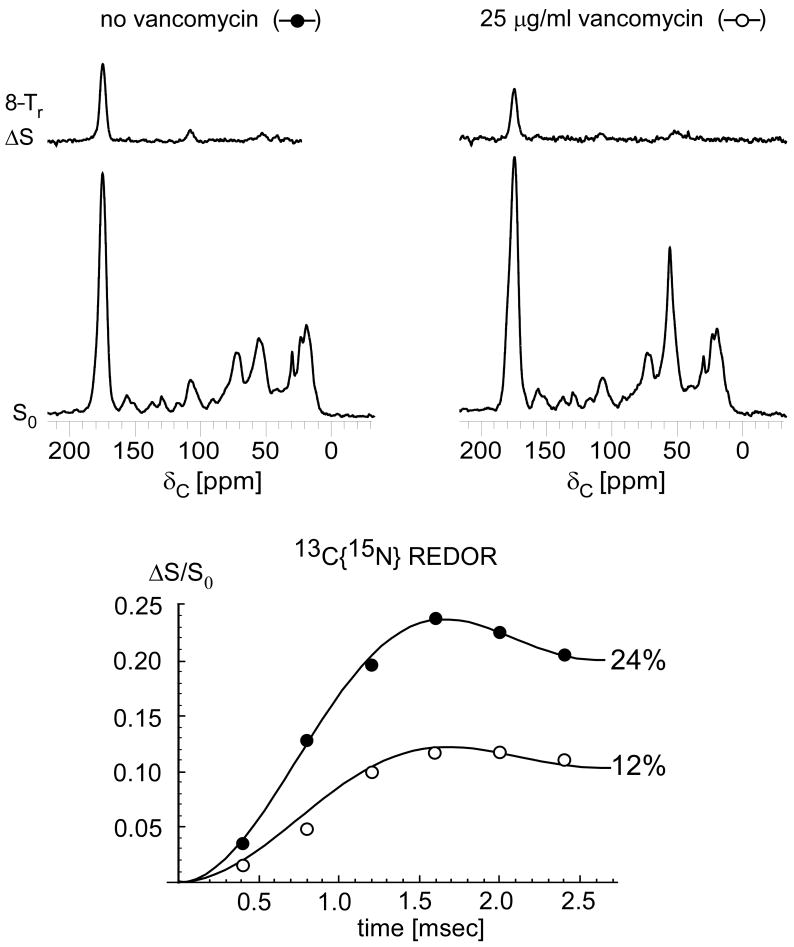
The one-bond maximum dephasing (ΔS/S0) for the 175-ppm carbonyl carbon peak decreases from 24% to 12% in E. faecium whole cells treated with 25 μg/ml of vancomycin (Figure 2). This decrease in dephasing results from the dilution of cell-wall D-Ala by uncross-linked D-Ala-D-Ala containing cytoplasmic precursors, and is not related to any significant change in cross-linking. The decrease in ΔS intensity results from a cell-wall thinning upon vancomycin treatment (vide infra).
Figure 2.
(Top) 13C{15N} REDOR spectra after 8-Tr evolution for whole cells enriched with D-[1-13C]alanine and D-[15N]aspartic acid, grown in the presence of alaphosphin and no vancomycin (left) or 25 μg/ml vancomycin (right). The REDOR difference spectra (ΔS) represent only D-Ala cross-linked to D-Asp. (Bottom) 13C{15N} REDOR dephasing (ΔS/S0) of the 175 ppm-peak as a function of dipolar evolution time. The maximum one-bond dephasing decreases from 24% to 12% after treatment with vancomycin as a result of the accumulation of uncross-linked peptidoglycan precursors in the cytoplasm. Uncross-linked peptidoglycan subunits in mature cell wall are cleaved into tripeptides by a carboxypeptidase in E. faecium and therefore are not detected in the 13C{15N} REDOR experiment.
To improve the quantitation, the carbonyl peak centered around 175 ppm was deconvoluted experimentally using ΔS from 13C{15N} REDOR experiments. The deconvolution strategy was used previously to characterize the peptidoglycan of E. faecium whole cells,19 and the results were consistent with those obtained from mass spectrometry determinations made from cell-wall isolates of the same sample.22 In brief, for a culture enriched with the isotopes described above, only cross-linked D-[1-13C]Ala labels dephase after 8 Tr in a 13C{15N} REDOR experiment. The REDOR ΔS at 175 ppm is specific to D-Ala peptide carbonyl carbons in cross-linked stems. The peptide carbonyl of the D-Ala in uncross-linked D-Ala-D-Ala stems does not dephase. The remaining D-Ala contributions are determined by their unique chemical shifts (see Supplemental Data).
Before deconvoluting the 13C spectra, ΔS was scaled by the isotopic enrichment of D-[15N]Asp as determined experimentally from a separate 15N{13C} REDOR experiment performed on cell-wall isolates enriched with D-[4-13C]aspartic acid and L-[6-15N]lysine. The one-bond maximum dephasing, 8 Tr at 5 kHz, of the amide peak corresponds to the isotopic enrichment of D-[4-13C]Asp, which was shown to be the same as that of D-[15N]Asp in E. faecium.19 The isotopic enrichment of D-[15N]Asp was determined to be 56 ± 1 % for all the control and drug-treated samples described here, and so we multiplied ΔS by 1.8 (1/0.56) for each analysis.
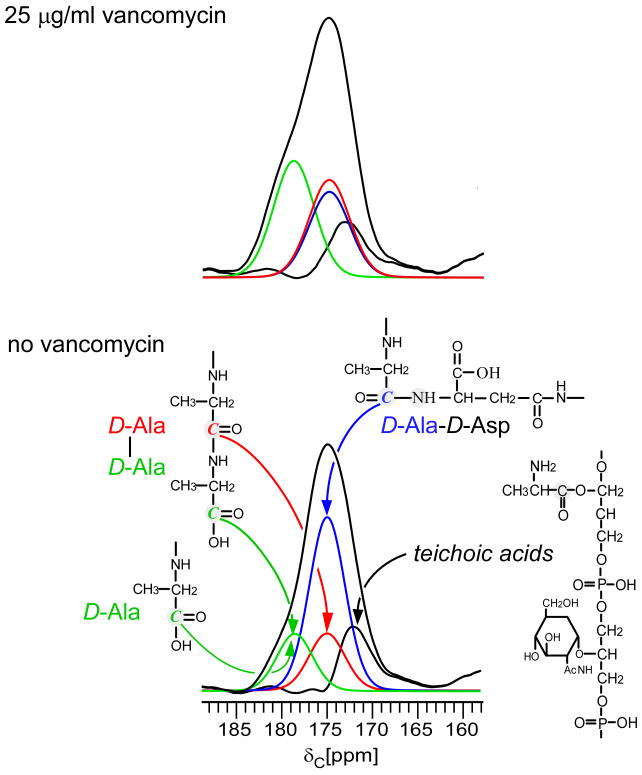
When the 175-ppm carbonyl carbon peak of whole cells enriched with D-[1-13C]Ala and D-[15N]Asp is experimentally deconvoluted, we determined that the number of D-Ala-D-Ala stems increased by a factor of two in cultures treated with 25 μg/ml of vancomycin (Figure 3). Among D-Ala-containing peptidoglycan, the concentration of D-Ala-D-Asp and D-Ala-D-Ala stems is respectively 76 and 24% without vancomycin, and 45 and 48% with 25 μg/ml vancomycin (Table 1). The results from cultures treated with 15 μg/ml of vancomycin were not significantly different (Table 1). As described above, D-Ala-D-Ala stems do not occur in mature E. faecium peptidoglycan because they are cleaved into tripeptides by L,D-carboxypeptidase. Thus, the increased concentration of D-Ala-D-Ala in vancomycin treated cells is specific to the accumulation of peptidoglycan precursors in the cytoplasm, primarily Park's nucleotide, which is the signature of transglycosylase inhibition.23, 24
Figure 3.
Complete experimental deconvolution of the carbonyl-carbon 13C CPMAS echo spectra of E. faecium whole cells enriched with D-[1-13C]alanine and D-[15N]aspartic acid grown in the presence of alaphosphin and no vancomycin (bottom) or 25 μg/ml vancomycin (top). The REDOR difference from Figure 2 (blue) was scaled by the isotopic enrichment of D-[15N]Asp. The distribution percentages are listed in Table 1. The concentration of D-Ala-D-Ala stems increases in cells treated with 25 μg/ml of vancomycin as a result of the accumulation of cytoplasmic pentapeptide precursors, a signature of transglycosylase inhibition.
Vancomycin does not significantly affect transpeptidation
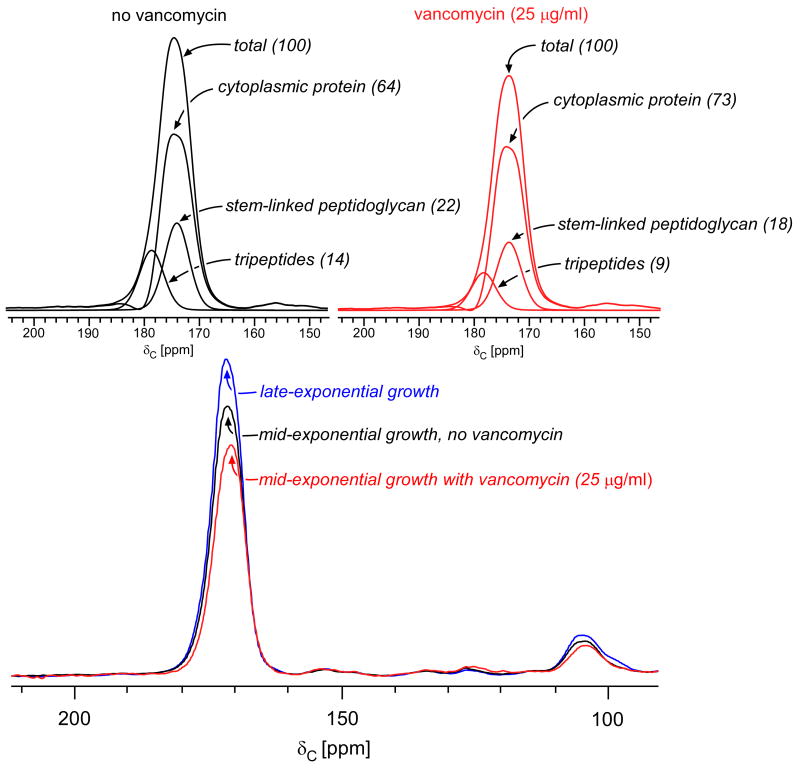
As mentioned above, the D-Ala-D-Ala termini of uncross-linked peptidoglycan repeat units in mature cell wall are cleaved by L,D-carboxypeptidase forming tripeptides. Tripeptides do not contain D-Ala and are therefore invisible in 13C CPMAS spectra of cells enriched with D-[1-13C]alanine. Consequently, investigating the possible effects of vancomycin on cross-linking requires a second experiment in which cultures are enriched with L-[1-13C]lysine. The 13C CPMAS echo spectra of whole cells harvested at late-exponential and mid-exponential growth (with and without vancomycin) are normalized with respect to the natural abundance aliphatic carbon signal intensities between 0 and 35 ppm (Figure 4, bottom), a reliable normalization for solid-state NMR spectra.25,26 The normalization is consistent with the scaling of the spectra by whole-cell mass (excluding buffer) and number of scans.
Figure 4.
(Bottom) 13C CPMAS echo spectra of E. faecium whole cells enriched with L-[1-13C]lysine harvested at late-exponential growth (blue), mid-exponential growth (black), or mid-exponential growth in the presence of 25 μg/ml vancomycin (red). The spectra are normalized with respect to the natural-abundance, aliphatic-carbon signal intensities between 0 and 35 ppm. (Top) Deconvolution of the carbonyl-carbon peak for cells in mid-exponential growth, with and without vancomycin. The terminal carboxyl L-Lys in tripeptide peptidoglycan stems has a unique chemical shift of 178 ppm. The remaining peptidoglycan contribution to the peak centered at 175 ppm results from L-Lys stem-linked to D-Ala and was determined by subtracting contributions from cytoplasmic proteins and tripeptides from the total. The cytoplasmic protein concentration is relatively unchanged by drug administration (reference 26). Tripeptides constitute 40% of the peptidoglycan in the untreated control culture (left) and 35% of the peptidoglycan in cells treated with 25 μg/ml of vancomycin (right).
The differences in signal intensities of the carbonyl carbon peak centered about 175 ppm correspond directly to decreases in the amount of cell wall per cell, as the cytoplasmic protein contribution remains relatively unchanged.27 We confirmed this by performing cell-wall isolations on each sample and comparing the relative masses isolated from each. For E. faecium whole cells enriched with L-[1-13C]lysine and harvested at late-exponential growth, the cell wall constitutes 48% of the peak centered around 175 ppm.19 This peak decreases 12% in control cells cultured in mid-exponential growth relative to those cultured in late-exponential growth. The peptidoglycan contribution to the control culture harvested in mid-exponential growth is therefore 36% (48%-12%), a value in good agreement with that reported before.28 The peptidoglycan contribution to the 175-ppm peak was similarly determined for cultures treated with 25 μg/ml of vancomycin as 27%.
We showed previously that cell-wall tripeptides, peptidoglycan stems in which the D-Ala-D-Ala has been cleaved, account for all of the 13C CPMAS signal intensity at 178 ppm in whole cells of E. faecium enriched with L-[1-13C]Lys.19 The concentration of tripeptides in E. faecium whole cells can therefore be determined by centering the carboxyl-carbon lineshape, obtained from cell-wall isolates (see Supplemental Data and Figure S1), at 178 ppm and scaling it such that no residual intensity remains at 178 ppm after subtraction, as was verified for cultures in late-exponential growth by solid-state NMR and mass spectrometry.19,22 The tripeptide contribution was determined to be 14% and 9% of the total peak intensity centered around 175 ppm in control cells and in 25 μg/ml vancomycin treated cells, respectively (Figure 4). The remainder of the cell-wall contribution represents stem-linked peptidoglycan containing L-Lys covalently bound to D-Ala. The percentage of tripeptides constituting the peptidoglycan is determined by scaling the contribution of tripeptides to that of the total peptidoglycan determined earlier. Tripeptides therefore represent 40% (14/36) of the peptidoglycan in mid-exponential control cells and 35% (9/27) of the peptidoglycan in mid-exponential cells treated with 25 μg/ml vancomycin (Table 2). We attribute the relative decrease in tripeptides upon addition of vancomycin to the accumulation of Park's nucleotide in the cytoplasm (peptidoglycan precursors with L-Lys-D-Ala stem-linkages), and not to any significant change in cross-linking. We conclude that vancomycin inhibits transglycosylation, but has no significant effect on transpeptidation.
Oritavancin does not significantly affect transglycosylation
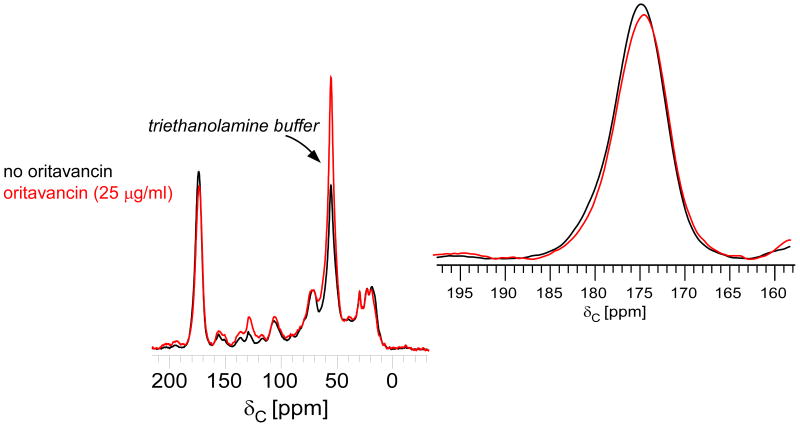
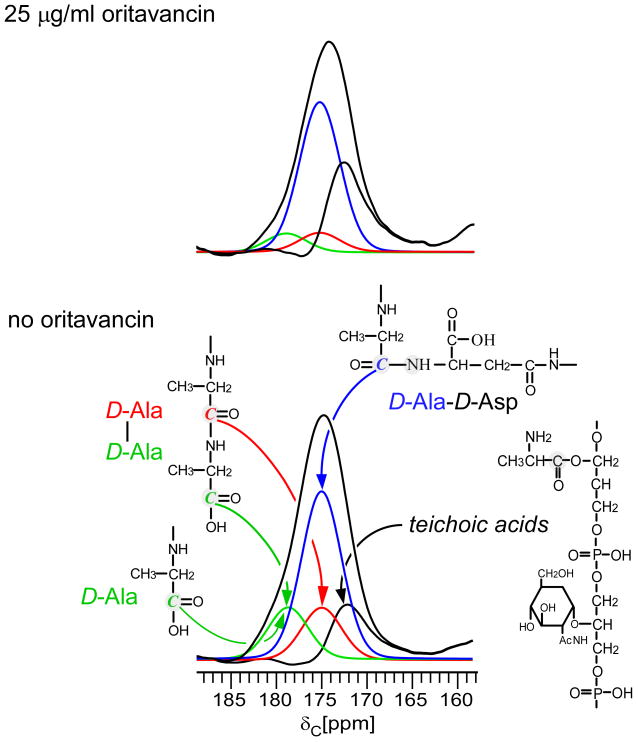
The 13C CPMAS spectra of E. faecium whole cells enriched with D-[1-13C]alanine and D-[15N]aspartic acid in the presence of alaphosphin, harvested in mid-exponential growth, do not show a change in lineshape with respect to the peak centered at 175 ppm when treated with 15 or 25 μg/ml of oritavancin (Figure 5). Thus, there is no substantial increase in peptidoglycan species terminating in D-Ala for cells treated with oritavancin relative to those without, contrasting with the results from vancomycin. Although the 13C CPMAS spectra have been scaled with respect to the natural abundance aliphatic carbon peaks between 0 and 35 ppm, the normalization does not affect the conclusion that D-Ala-D-Ala containing species do not accumulate in the cytoplasm.
Figure 5.
13C CPMAS echo spectra of E. faecium whole cells enriched with D-[1-13C]alanine, grown in the presence of alaphosphin and no oritavancin (black) or 25 μg/ml oritavancin (red). The spectra are normalized with respect to the natural-abundance, aliphatic-carbon signal intensities between 0 and 35 ppm. The line shape of the peak centered around 175 ppm does not change significantly with the addition of oritavancin (inset). The absence of increased signal at 178 ppm corresponding to cytoplasmic cell-wall precursors, as observed for cells treated with vancomycin (see Figure 1), shows that oritavancin does not significantly affect transglycosylase.
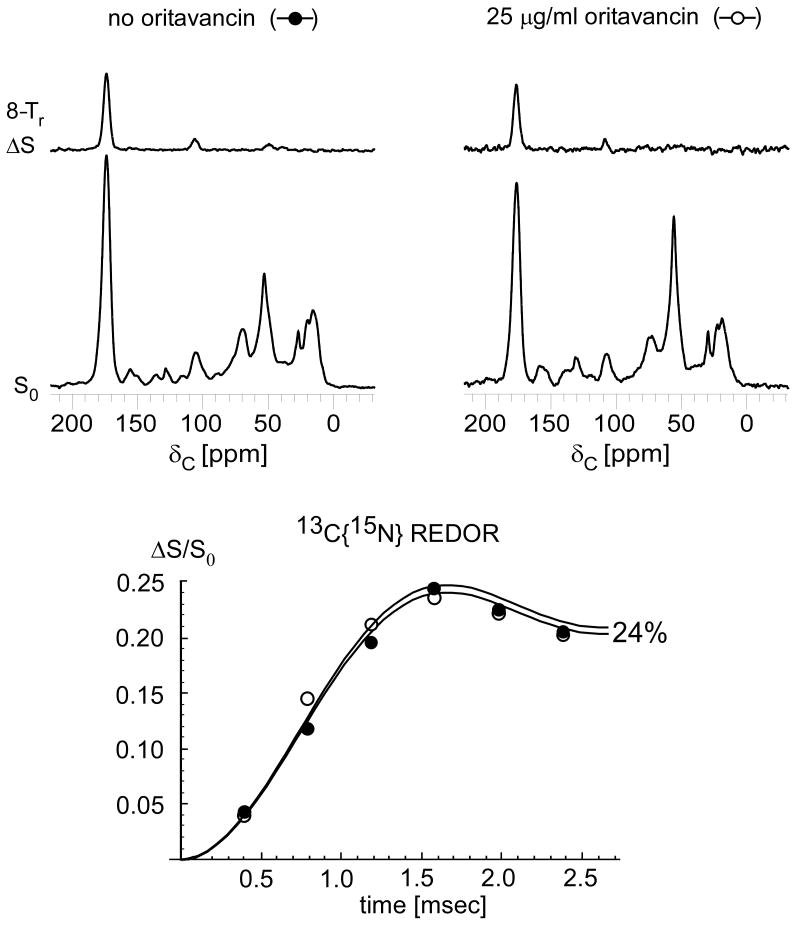
The maximum one-bond distance dephasing of the 175 ppm peak in 13C{15N} REDOR experiments remains the same at 24% (Figure 6). Deconvolution of the 13C CPMAS spectra with ΔS, scaled by the isotopic enrichment of D-[15N]Asp, shows that the proportion of D-Ala containing peptidoglycan with D-Ala-D-Ala stems slightly decreases after treatment with oritavancin (Figure 7). Among D-Ala containing peptidoglycan, the concentration of D-Ala-D-Asp and D-Ala-D-Ala stems is respectively 76 and 24% without oritavancin, and 89 and 11% with 25 μg/ml oritavancin (Table 1). While the concentration of D-Ala-D-Ala containing peptidoglycan species doubled under the pressure of vancomycin, here, with oritavancin treatment, the pentapeptide concentration decreases. A decrease in pentapeptides is inconsistent with the accumulation of peptidoglycan precursors. We conclude that oritavancin does not inhibit transglycosylase in E. faecium.
Figure 6.
(Top) 13C{15N} REDOR spectra after 8-Tr evolution for whole cells enriched with D-[1-13C]alanine and D-[15N]aspartic acid, grown in the presence of alaphosphin and no oritavancin (left) or 25 μg/ml oritavancin (right). The REDOR difference spectra (ΔS), representing only D-Ala cross-linked to D-Asp, are proportional to the cell-wall content of cells with and without oritavancin treatment. (Bottom) 13C{15N} REDOR dephasing (ΔS/S0) of the 175 ppm-peak as a function of dipolar evolution time. The maximum one-bond dephasing does not significantly change in cells treated with oritavancin.
Figure 7.
Complete experimental deconvolution of the carbonyl-carbon 13C spectra of E. faecium whole cells enriched with D-[1-13C]alanine and D-[15N]aspartic acid grown in the presence of alaphosphin and no oritavancin (bottom) or 25 μg/ml oritavancin (top). The REDOR difference from Figure 6 was scaled by the isotopic enrichment of D-[15N]Asp. The distribution percentages are listed in Table 1. The concentration of stems terminating in D-Ala-D-Ala does not increase in cells treated with oritavancin. In contrast to vancomycin treatment, oritavancin treatment does not result in the accumulation of pentapeptide cytoplasmic precursors characteristic of transglycosylase inhibition.
Oritavancin inhibits transpeptidation
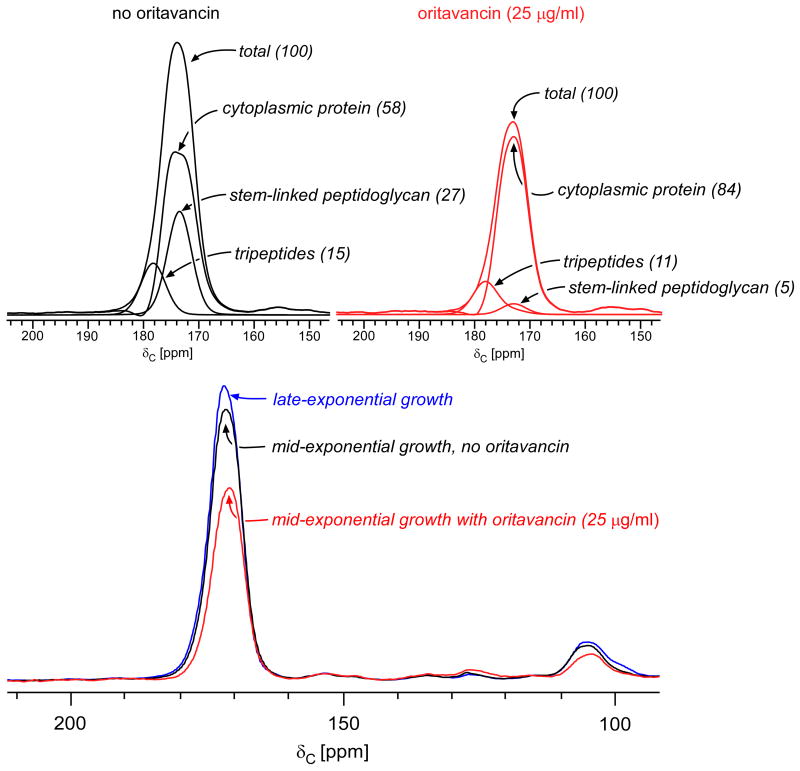
To assess the effects of oritavancin on transpeptidase, the tripeptide contribution to the E. faecium peptidoglycan has to be taken into account. Whole cells enriched with L-[1-13C]lysine were compared with and without sublethal concentrations of oritavancin (Figure 8, bottom). The 13C CPMAS echo spectra were normalized with respect to the natural-abundance, aliphatic-carbon signal intensities between 0 and 35 ppm, and the cell-wall contribution to the carbonyl peak at 175 ppm was determined by relative comparison to that of late-exponential growth, as described in the vancomycin data analysis. In the control cells, the cell wall represents 42% of the 175-ppm peak, compared to the significantly reduced 16% observed for cells treated with 25 μg/ml of oritavancin (Figure 8, top).
Figure 8.
(Bottom) 13C CPMAS echo spectra for E. faecium whole cells enriched with L-[1-13C]lysine harvested at late-exponential growth (blue), mid-exponential growth (black), and mid-exponential growth in the presence of 25 μg/ml oritavancin (red). The spectra are normalized with respect to the natural-abundance, aliphatic-carbon signal intensities between 0 and 35 ppm. The cytoplasmic protein contribution to the peak centered about 175 ppm remains essentially unchanged. (Top) Deconvolution of the carbonyl-carbon peak for cells in mid-exponential growth, with and without oritavancin. The terminal carboxyl L-Lys in tripeptide peptidoglycan stems has a unique chemical shift of 178 ppm. The remaining peptidoglycan contribution to the peak centered at 175 ppm results from L-Lys stem-linked to D-Ala and was determined by subtracting the contribution of the cytoplasmic proteins and tripeptides from the total. Tripeptides constitute 37% of the peptidoglycan in the untreated control culture (left) and 69% of the peptidoglycan in cells treated with 25 μg/ml of oritavancin (right). The tripeptide concentration increases in cells treated with oritavancin as a consequence of transpeptidase inhibition, resulting in uncross-linked pentapeptides in the cell wall that are cleaved into tripeptides by L,D-carboxypeptidase.
The terminal carboxyl carbon of L-Lys in tripeptides has a unique chemical shift of 178 ppm. We took advantage of this observation to determine the concentration of cell-wall tripeptides in L-[1-13C]Lys enriched whole cells treated with vancomycin, and we apply the same analysis here to assess oritavancin activity. When the tripeptide line shape obtained from cell-wall isolates (see Figure S1) is scaled such that no intensity at 178 ppm remains in the whole cell 13C CPMAS spectra after subtraction, the tripeptide contribution represents 15% and 11% of the total peak intensity centered around 175 ppm in control cells and oritavancin treated cells, respectively (Figure 8, top). As in the vancomycin analysis, the concentration of tripeptides in the peptidoglycan is determined by the ratio of tripeptides to total peptidoglycan. For E. faecium, the concentration of tripeptides significantly increases from 37% (15/42) of the peptidoglycan observed in the untreated control, to 69% (11/16) for cells treated with 25 μg/ml oritavancin (Table 2). The results are consistent with decreased cross-linking in oritavancin treated cells, which ultimately leads to increased tripeptides as a result of L,D-carboxypeptidase activity. We conclude that oritavancin primarily inhibits transpeptidase in E. faecium, while having no detectable effect on transglycosylation.
Our conclusion that in E. faecium vancomycin inhibits glycan-chain extension (not cross-linking) and oritavancin inhibits cross-linking (not glycan chain extension) is exactly opposite to a conclusion based entirely on a simplistic interpretation of D-Ala-D-Asx cross-linking, as revealed by the ΔS/S0's of Figures 2 and 6. An accurate interpretation of these REDOR results required including two additional key factors: first, the concentration of cell walls in the whole-cell samples and second, the concentration of cell-wall precursors in the cytoplasm. The first factor influences ΔS and the second, S0. Both factors must be included in the analysis of cross-linking in E. faecium because of carboxypeptidase activity, which removes the uncross-linked D-Ala-D-Ala termini in mature cell walls thereby altering the observed ΔS/S0.
D,D-carboxypeptidase activity
We suggested before that the presence of uncross-linked tetrapeptides (peptidoglycan stems with a single D-Ala) in whole-cell NMR experiments indicates D,D-carboxypeptidase activity is independent of transpeptidation.19 The experiments performed on E. faecium whole cells treated with vancomycin here indicate that D,D-carboxypeptidase activity occurs in the cytoplasm. Park's nucleotide, a non-membrane bound D-Ala-D-Ala containing peptidoglycan precursor, accumulates as transglycosylation is inhibited by vancomycin (Figure 3, top, green). Although untreated control cultures harvested at mid-exponential growth show no uncross-linked tetrapeptides, these species increase to 5% of the total D-Ala containing peptidoglycan subunits after 1 hr exposure to 25 μg/ml of vancomycin (see Table 1). The increase suggests that the accumulated pentapeptide cell-wall precursors are cleaved by D,D-carboxypeptidase in the cytoplasm. Additionally, in cells treated with oritavancin, uncross-linked tetrapeptides are not detected, consistent with oritavancin having no significant effect on transglycosylase.
Secondary-binding site of oritavancin
Recently it was suggested that in S. aureus, oritavancin has a secondary-binding interaction with cell-wall pentaglycyl bridges,29,30 in addition to the well-known primary D-Ala-D-Ala binding interaction. The resistance mechanisms that have evolved in E. faecium involve modification and/or elimination of D-Ala-D-Ala glycopeptide-binding sites.8,31,32 Novel antibiotics with secondary-binding sites are of great clinical interest because such drugs offer new possibilities for treatment of resistant pathogens. Thus far, secondary-binding studies have been limited to S. aureus and implicated the pentaglycyl bridge, a peptidoglycan characteristic that is not conserved in E. faecium. The significantly shorter peptidoglycan bridge in E. faecium consists of a single D-Asx residue and is likely part of a three-dimensional cell-wall organization differing from that of S. aureus. Until now, the effect of a potentially unique tertiary peptidoglycan structure on secondary binding in E. faecium has not been explored.
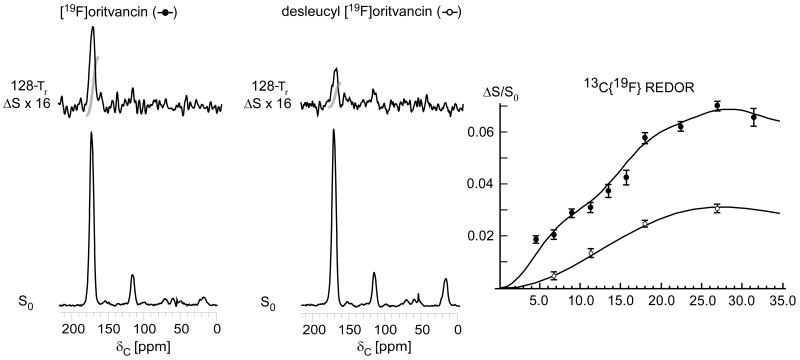
To characterize the binding sites of oritavancin we performed 13C{19F} REDOR on E. faecium whole cells enriched with L-[1-13C]lysine complexed with [19F]oritavancin (Figure 9, left). Replacing the chlorine atom of glycopeptides with fluorine does not significantly affect the pharmacological properties of the drugs33 and allows for structural NMR binding studies.20 The 13C{19F} REDOR dephasing is consistent with two 13C-19F distances, 5.1 and 7.8 Å (Figure 9, right). The experimentally determined REDOR differences arise exclusively from lysine-enriched peptidoglycan, and, therefore, S0 was scaled so that the dephasing values are with respect to the total number of peptidoglycan stems (See Figure 8 and Supplemental Data). This scaling does not affect the distance fits.34 The whole cells were complexed with [19F]oritavancin at late-exponential growth and, as discussed above, the contribution of the peptidoglycan to the peak centered at 175 ppm for these growth conditions is 48% based on previous studies.19 Therefore, when plotting ΔS/S0 as a function of dipolar evolution time, ΔS was multiplied by a factor of 2.10 (1/0.48) to adjust the REDOR difference specifically to the cell-wall concentration.
Figure 9.
125-MHz 13C{19F} REDOR spectra after 128-Tr evolution for E. faecium whole cells enriched with L-[1-13C]lysine and complexed with either [19F]oritavancin (left) or desleucyl [19F]oritavancin (middle). The REDOR difference for desleucyl [19F]oritavancin shows binding to E. faecium peptidoglycan despite the drug's damaged D-Ala-D-Ala binding pocket. (Right) 13C{19F} REDOR dephasing (ΔS/S0) of the 175-ppm peak as a function of dipolar evolution time. The data were normalized to the concentration of peptidoglycan stems. The [19F]oritavancin dephasing data (solid circles) were fit to 5.1 and 7.8-Å distances with 2 and 5% dephasing maxima, respectively. The desleucyl [19F]oritavancin data (open circles) were fit to one distance of 7.8 Å with a 3% dephasing maximum. The spectra on the left resulted from the accumulation of 16,000 scans, and those in the middle from 106,000 scans. Error bars based on integrals were determined by uncertainties in ΔS.
The concentration of [19F]oritavancin complexed with the cells was sufficient to saturate all of the D-Ala-D-Ala binding sites.20,25 The dephasing plateau observed for E. faecium whole cells complexed with [19F]oritavancin is 7%, consistent with saturation of the 7% of D-Ala-D-Ala peptidoglycan stems quantified at late-exponential growth.19 The individual 5.1 and 7.8-Å distances are fit with 2 and 5% dephasing maxima, respectively. Furthermore, the dephasing is specific to L-lysine that is stem-linked to D-Ala as indicated by the chemical shift of ΔS at 174 ppm. The two-distance fit suggests that there are two unique binding conformations of oritavancin in E. faecium, presumably mediated by different structural motifs.
Desleucyl [19F]oritavancin with damaged D-Ala-D-Ala cleft binds to E. faecium peptidoglycan
The Edman degradation product of vancomycin removes the N-terminal N-methylleucyl residue from the aglycon core, thereby destroying the D-Ala-D-Ala binding cleft and rendering the drug incapable of binding to peptidoglycan as evidenced by a loss of antimicrobial activity.17 Interestingly, the Edman degradation product of oritavancin (desleucyl oritavancin, see Scheme 1) retains antimicrobial activity, suggesting that the activity of oritavancin is at least in part independent of the D-Ala-D-Ala binding motif. To characterize the binding site of desleucyl oritavancin, we performed 13C{19F} REDOR on E. faecium whole cells in late-exponential growth complexed with desleucyl [19F]oritavancin. The REDOR results (Figure 9, middle) show that desleucyl [19F]oritavancin still binds to E. faecium peptidoglycan despite its damaged D-Ala-D-Ala binding cleft.
When ΔS/S0 is scaled so that the dephasing values are normalized to the total concentration of peptidoglycan stems (that is, ΔS/S0 is multiplied by 2.10), the dephasing maximum is determined as 3% and is consistent with a single distance of 7.8 Å (Figure 9, right, open circles). The single-distance fit is comparable to the longer of the two 13C-19F distances observed for [19F]oritavancin, suggesting that secondary binding corresponds to this [19F]oritavancin conformation.
Proposed secondary-binding site and associated mode of action for oritavancin
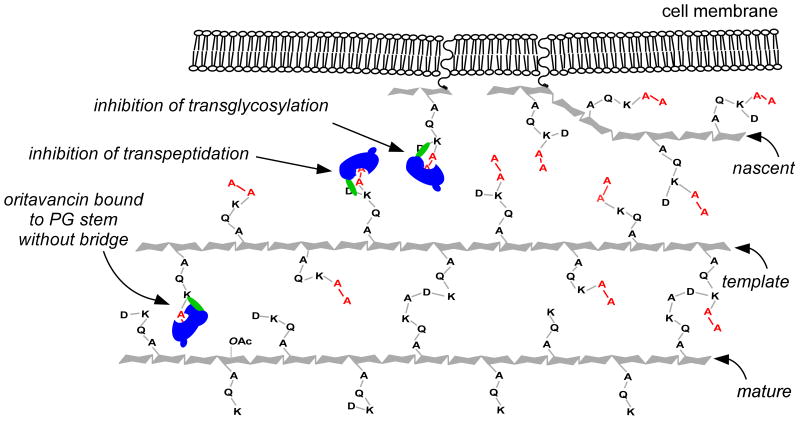
We propose that the secondary-binding site for oritavancin is formed by the triangulation of a D-Asx bridge, an L-Lys, and a penultimate D-Ala5 on a pentapeptide stem (Figure 10). Because the motif is independent of the terminal residue of the pentapeptide, modifying D-Ala-D-Ala to D-Ala-D-Lac does not affect secondary binding, making oritavancin and desleucyl oritavancin active against vancomycin-resistant E. faecium. We determined previously that only 61% of the E. faecium peptidoglycan has D-Asx bridges.19 Sixty-one percent of the total number of pentapeptides in E. faecium peptidoglycan (7%) yields a theoretical concentration of secondary-binding sites (4.3%) that is consistent with the experimental 7.8-Å dephasing maxima of 3-5% that we observe for [19F]oritavancin and desleucyl [19F]oritavancin. We speculate that the remaining 5.1-Å contribution to the [19F]oritavancin dephasing plateau is the result of [19F]oritavancin complexed to primary D-Ala-D-Ala binding sites on stems without D-Asx bridges. Apparently, [19F]oritavancin bound to peptidoglycan stems without secondary-binding sites has a conformation in which the 19F is closer to L-[1-13C]Lys (see Figure 10).
Figure 10.
Two-dimensional schematic representation of the E. faecium template model for peptidoglycan assembly and oritavancin mode of action. Three molecules of bound oritavancin are shown as blue and green icons. D-Ala-D-Ala termini of pentapeptide stems are highlighted in red. The phenylbenzyl moiety of oritavancin is highlighted in green. The middle and right drug icons are bound to both primary- and secondary-binding sites, whereas the left drug icon is only bound to the primary-binding site (D-Ala-D-Ala). Oritavancin has a unique conformation when bound to peptidoglycan stems with both a primary- and secondary-binding site. The secondary-binding site is formed by the triangulation of a D-Asx bridge, an L-Lys residue, and a penultimate D-Ala residue of a pentapeptide stem (middle and right drug icons). Oritavancin primarily inhibits transpeptidase by binding to template and nascent peptidoglycan and sterically interfering with the ability of the D-Asp of one stem to form a cross-link with the penultimate D-Ala of an adjacent stem. Oritavancin assumes a different conformation when bound to a pentapeptide stem without a bridge (these pentapeptide stems have a primary-binding site but do not have a secondary-binding site, see left drug icon). The different confirmation causes the phenylbenzyl moiety of oritavancin to be close to L-Lys, as indicated by the superimposition of the left drug icon over the L-Lys residue. In mature peptidoglycan, there is a high concentration of tripeptides resulting from uncross-linked stems whose D-Ala-D-Ala termini have been cleaved by carboxypeptidase (mature strand). These stems have neither primary- nor secondary-binding sites. While oritavancin can probably inhibit transglycosylation by binding to lipid II (right icon), the drug primarily inhibits transpeptidase because of the larger number of secondary-binding sites associated with the long glycan chains of E. faecium (template strand).
Although the concentration of both primary and secondary-binding sites in E. faecium is relatively low, we believe that the peptidoglycan characterized by these structural motifs is necessary to cell-wall biosynthesis and therefore representative of a powerful antimicrobial drug target. In our template model of cell-wall assembly,35 pentapeptides of glycan chains in nascent and template peptidoglycan19,29 occurring near the cytoplasmic membrane are essential (see Figure 10). Nascent peptidoglycan is incorporated into the cell wall by the addition of single-glycan chains of the appropriate orientation as signaled by the conformation of the nearest neighbor, specifically the last completed chain which serves as the template. Template peptidoglycan must contain pentapeptides to serve as donors in forming cross-links with the extending nascent chain. While vancomycin is only active when it binds to lipid II, thereby inhibiting transglycosylation, we argue that oritavancin has activity when it binds to template peptidoglycan as well as when it binds to lipid II. When oritavancin and desleucyl oritavancin bind to template peptidoglycan, their bulky hydrophobic tails sterically perturb template recognition and disrupt the orientation of the extending nascent peptidoglycan.35 Consequently, the misaligned nascent peptidoglycan is unable to form cross-links with the template strand. Moreover, the irregularity is perpetuated as the misaligned nascent strand develops into an unsynchronized template.36 The resulting increased number of uncross-linked stems is subsequently cleaved into tripeptides in mature peptidoglycan, and the structural integrity of the cell wall is compromised.
In S. aureus, oritavancin was observed to inhibit both transglycosylase and transpeptidase.29 In contrast, the results described here show that oritavancin primarily inhibits transpeptidase in E. faecium. We believe that the dual mode of action of oritavancin is masked in E. faecium by long glycan chains. The length of glycan chains in E. faecium has not been reported, but we speculate that it is much longer than the average observed in S. aureus37 to compensate for the lack of structural integrity resulting from the short cross-linked peptidoglycan fragments observed in mass spectrometry experiments.15,22,38 Lengths of glycan chains for bacterial organisms with similar distributions of cross-linked fragments have recently been reported to be nearly 1000 times that observed in S. aureus.39 While oritavancin could potentially bind to lipid II and inhibit transglycosylase, we believe that long glycan chains make E. faecium particularly susceptible to inhibition of transpeptidation by template interference, as a longer template strand provides more oritavancin and desleucyl oritavancin binding sites.
Materials and Methods
Preparation of E. faecium samples
Starting cultures of E. faecium (ATTC 49624) were prepared by inoculating brain heart infusion media with a single colony. Cultures were incubated overnight at 37° C, but not aerated. NMR samples were prepared by inoculating enterococcal standard media (ESM) with the overnight starter cultures (1% final volume). ESM was prepared as described before with the pH adjusted to 7.0 prior to sterile filtration.19
Natural abundance amino acids in ESM were replaced by stable 13C and 15N isotope-enriched amino acids to incorporate specific labels into the samples. When samples were enriched with aspartic acid, asparagine was omitted from the media. Samples enriched with D-[1-13C]alanine were treated with 5 μg/ml of alaphosphin every 1.5 hours of growth to prevent scrambling of the label to L-alanine.19
For the mode of action studies, experiments were performed in triplicate so that control cultures and those treated with drugs at concentrations of 15 and 25 μg/ml were all grown under identical conditions. The parallel cultures were grown in 1 L volumes until the absorbance at 660 nm was approximately 0.4, at which point the drugs were added to the antibiotic-treated samples. The cultures were then incubated for 45 min, before harvesting the cells for NMR analysis. Cell-wall isolations were performed on lyophilized whole cells after NMR analysis as described previously.19 For the drug-binding studies, cultures were grown in 500 ml volumes of ESM enriched with L-[1-13C]lysine to an estimated optical density at 660 nm of 1.0. The cells were harvested by centrifugation at 10,000g for 25 min at 4° C. Pellets were rinsed, resuspended in a minimal amount of 40 mM triethanolamine hydrochloride (pH 7.0), and complexed with 5 mg of [19F]oritavancin or desleucyl [19F]oritavancin. The syntheses of [19F]oritavancin and desleucyl [19F]oritavancin were as described before.29
Solid-State NMR measurements
The mode of action experiments were performed using a four-frequency transmission-line probe40 with a 14-mm long, 9-mm inside-diameter analytical coil, and a Chemagnetics/Varian magic-angle spinning ceramic stator. Lyophilized samples were spun in Chemagnetics/Varian 7.5-mm outside-diameter zirconia rotors at 5.0 kHz. The speed was under active control and maintained to within ±2 Hz. Experiments were done at room temperature using a Chemagnetics CMX-300 spectrometer operating at 75.453 MHz for carbon. Radio frequency pulses were produced by 1-kW Kalmus, ENI, and American Microwave Technology power amplifiers, each under active control;41 π pulse lengths were 10 μs for 13C and 15N. Proton-carbon and proton-nitrogen cross-polarization transfers were at 50 kHz for 2 msec. Proton dipolar decoupling was 110 kHz during data acquisition. Sample masses were on the order of 200 mg.
REDOR experiments were performed in two parts: once with dephasing pulses (S) and once without (S0).34 In the first part of the experiment, the dephasing pulses were off and magic-angle spinning spatially averaged chemical-shift and dipolar anisotropic interactions to produce a signal of full intensity. In the second part of the experiment, π-pulses were applied on the dephasing channel in the middle of the rotor period (Tr) to reintroduce the dipolar coupling between spins and produce a reduction in echo-signal intensity. The difference in signal intensity (ΔS = S0 – S) is directly related to the internuclear distance between the observed and dephasing spins. For one-bond 13C-15N dipolar coupling, total dephasing is observed after 8-Tr with 5-kHz magic-angle spinning. Each 75-MHz 13C{15N} REDOR spectrum typically consisted of 30,000 acquisition scans. Uncertainties in REDOR dephasing measurements were estimated using integrals of ΔS. For all one-bond distance dephasing, the error was less than 3%.
The drug-binding characterization experiments were performed using a six-frequency transmission-line probe having a 12-mm long, 6-mm inside-diameter analytical coil and a Chemagnetics/Varian magic-angle spinning ceramic stator. Lyophilized samples were spun in 5-mm outside-diameter zirconia rotors at 7143 Hz with the speed under active control to within ±2 Hz. A static 12-T magnetic field was provided by an 89-mm-bore Magnex superconducting solenoid. The spectrometer was controlled by a Tecmag pulse programmer. Proton (500 MHz) radiofrequency pulses were generated by a 50-W American Microwave Technology power amplifier. Radiofrequency pulses for 13C were produced by 2-kW American Microwave Technology power amplifiers. All amplifiers were under active control. The 13C{19F} REDOR π-pulse lengths were 8 μs for 13C and 5 μs for 19F. Proton dipolar decoupling was 100 kHz during dipolar evolution and data acquisition.
Supplementary Material
Acknowledgments
This article is based on work supported, in part, by the National Institutes of Health under grant number EB002058.
Abbreviations
- CPMAS
cross-polarization magic-angle spinning
- desleucyl oritavancin
des-N-methylleucyl-oritavancin
- ESM
enterococcal standard media
- Lipid II
N-acetylglucosamine-N-acetyl-muramyl-pentapeptide-pyrophosphoryl-undecaprenol
- MIC
minimum inhibitory concentration
- NMR
nuclear magnetic resonance
- REDOR
rotational-echo double-resonance
- Tr
magic-angle spinning rotor period
- VRE
vancomycin-resistant enterococci
Footnotes
Publisher's Disclaimer: This is a PDF file of an unedited manuscript that has been accepted for publication. As a service to our customers we are providing this early version of the manuscript. The manuscript will undergo copyediting, typesetting, and review of the resulting proof before it is published in its final citable form. Please note that during the production process errors may be discovered which could affect the content, and all legal disclaimers that apply to the journal pertain.
References
- 1.Levine DP. Vancomycin: a history. Clin Infect Dis. 2006;42 1:S5–S12. doi: 10.1086/491709. [DOI] [PubMed] [Google Scholar]
- 2.Arias CA, Murray BE. Emergence and management of drug-resistant enterococcal infections. Expert Rev Anti Infect Ther. 2008;6:637–655. doi: 10.1586/14787210.6.5.637. [DOI] [PubMed] [Google Scholar]
- 3.McGregor JC, Kim PW, Perencevich EN, Bradham DD, Furuno JP, Kaye KS, Fink JC, Langenberg P, Roghmann MC, Harris AD. Utility of the Chronic Disease Score and Charlson Comorbidity Index as comorbidity measures for use in epidemiologic studies of antibiotic-resistant organisms. Am J Epidemiol. 2005;161:483–493. doi: 10.1093/aje/kwi068. [DOI] [PubMed] [Google Scholar]
- 4.Allen NE, Nicas TI. Mechanism of action of oritavancin and related glycopeptide antibiotics. FEMS Microbiol Rev. 2003;26:511–532. doi: 10.1111/j.1574-6976.2003.tb00628.x. [DOI] [PubMed] [Google Scholar]
- 5.Mercier RC, Hrebickova L. Oritavancin: a new avenue for resistant Gram-positive bacteria. Expert Rev Anti Infect Ther. 2005;3:325–332. doi: 10.1586/14787210.3.3.325. [DOI] [PubMed] [Google Scholar]
- 6.Barrett JF. Recent developments in glycopeptide antibacterials. Curr Opin Investig Drugs. 2005;6:781–790. [PubMed] [Google Scholar]
- 7.Beauregard DA, Williams DH, Gwynn MN, Knowles DJ. Dimerization and membrane anchors in extracellular targeting of vancomycin group antibiotics. Antimicrob Agents Chemother. 1995;39:781–785. doi: 10.1128/AAC.39.3.781. [DOI] [PMC free article] [PubMed] [Google Scholar]
- 8.Courvalin P. Vancomycin resistance in gram-positive cocci. Clin Infect Dis. 2006;42 1:S25–S34. doi: 10.1086/491711. [DOI] [PubMed] [Google Scholar]
- 9.Mercier RC, Stumpo C, Rybak MJ. Effect of growth phase and pH on the in vitro activity of a new glycopeptide, oritavancin ( LY333328), against Staphylococcus aureus and Enterococcus faecium. J Antimicrob Chemother. 2002;50:19–24. doi: 10.1093/jac/dkf058. [DOI] [PubMed] [Google Scholar]
- 10.Arthur M, Depardieu F, Reynolds P, Courvalin P. Moderate-level resistance to glycopeptide LY333328 mediated by genes of the vanA and vanB clusters in enterococci. Antimicrob Agents Chemother. 1999;43:1875–1880. doi: 10.1128/aac.43.8.1875. [DOI] [PMC free article] [PubMed] [Google Scholar]
- 11.Anderson JS, Matsuhashi M, Haskin MA, Strominger JL. Biosythesis of the peptidoglycan of bacterial cell walls. II. Phospholipid carriers in the reaction sequence. J Biol Chem. 1967;242:3180–3190. [PubMed] [Google Scholar]
- 12.Matsuhashi M, Dietrich CP, Strominger JL. Incorporation of glycine into the cell wall glycopeptide in Staphylococcus aureus: role of sRNA and lipid intermediates. Proc Natl Acad Sci U S A. 1965;54:587–594. doi: 10.1073/pnas.54.2.587. [DOI] [PMC free article] [PubMed] [Google Scholar]
- 13.Shiozawa H, Chia BC, Davies NL, Zerella R, Williams DH. Cooperative binding interactions of glycopeptide antibiotics. J Am Chem Soc. 2002;124:3914–3919. doi: 10.1021/ja012273f. [DOI] [PubMed] [Google Scholar]
- 14.Ge M, Chen Z, Onishi HR, Kohler J, Silver LL, Kerns R, Fukuzawa S, Thompson C, Kahne D. Vancomycin derivatives that inhibit peptidoglycan biosynthesis without binding D-Ala-D-Ala. Science. 1999;284:507–511. doi: 10.1126/science.284.5413.507. [DOI] [PubMed] [Google Scholar]
- 15.Billot-Klein D, Shlaes D, Bryant D, Bell D, van Heijenoort J, Gutmann L. Peptidoglycan structure of Enterococcus faecium expressing vancomycin resistance of the VanB type. Biochem J. 1996;313(Pt 3):711–715. doi: 10.1042/bj3130711. [DOI] [PMC free article] [PubMed] [Google Scholar]
- 16.Brotz H, Bierbaum G, Reynolds PE, Sahl HG. The lantibiotic mersacidin inhibits peptidoglycan biosynthesis at the level of transglycosylation. Eur J Biochem. 1997;246:193–199. doi: 10.1111/j.1432-1033.1997.t01-1-00193.x. [DOI] [PubMed] [Google Scholar]
- 17.Goldman RC, Baizman ER, Longley CB, Branstrom AA. Chlorobiphenyl-desleucyl-vancomycin inhibits the transglycosylation process required for peptidoglycan synthesis in bacteria in the absence of dipeptide binding. FEMS Microbiol Lett. 2000;183:209–214. doi: 10.1111/j.1574-6968.2000.tb08959.x. [DOI] [PubMed] [Google Scholar]
- 18.Vollmer W, Blanot D, de Pedro MA. Peptidoglycan structure and architecture. FEMS Microbiol Rev. 2008;32:149–167. doi: 10.1111/j.1574-6976.2007.00094.x. [DOI] [PubMed] [Google Scholar]
- 19.Patti GJ, Kim SJ, Schaefer J. Characterization of the peptidoglycan of vancomycin-susceptible Enterococcus faecium. Biochemistry. 2008;47:8378–8385. doi: 10.1021/bi8008032. [DOI] [PMC free article] [PubMed] [Google Scholar]
- 20.Cegelski L, Steuber D, Mehta AK, Kulp DW, Axelsen PH, Schaefer J. Conformational and quantitative characterization of oritavancin-peptidoglycan complexes in whole cells of Staphylococcus aureus by in vivo 13C and 15N labeling. J Mol Biol. 2006;357:1253–1262. doi: 10.1016/j.jmb.2006.01.040. [DOI] [PubMed] [Google Scholar]
- 21.Schleifer KH, Kandler O. Peptidoglycan types of bacterial cell walls and their taxonomic implications. Bacteriol Rev. 1972;36:407–477. doi: 10.1128/br.36.4.407-477.1972. [DOI] [PMC free article] [PubMed] [Google Scholar]
- 22.Patti GJ, Chen J, Schaefer J, Gross ML. Characterization of Structural Variations in the Peptidoglycan of Vancomycin-Susceptible Enterococcus faecium: Understanding Glycopeptide-Antibiotic Binding Sites Using Mass Spectrometry. J Am Soc Mass Spectrom. 2008;19:1467–1475. doi: 10.1016/j.jasms.2008.06.020. [DOI] [PMC free article] [PubMed] [Google Scholar]
- 23.Hasper HE, Kramer NE, Smith JL, Hillman JD, Zachariah C, Kuipers OP, de Kruijff B, Breukink E. An alternative bactericidal mechanism of action for lantibiotic peptides that target lipid II. Science. 2006;313:1636–1637. doi: 10.1126/science.1129818. [DOI] [PubMed] [Google Scholar]
- 24.Breukink E, de Kruijff B. Lipid II as a target for antibiotics. Nat Rev Drug Discov. 2006;5:321–332. doi: 10.1038/nrd2004. [DOI] [PubMed] [Google Scholar]
- 25.Cegelski L, Schaefer J. Glycine metabolism in intact leaves by in vivo 13C and 15N labeling. J Biol Chem. 2005;280:39238–39245. doi: 10.1074/jbc.M507053200. [DOI] [PubMed] [Google Scholar]
- 26.Cegelski L, Schaefer J. NMR determination of photorespiration in intact leaves using in vivo 13CO2 labeling. J Magn Res. 2006;178:1–10. doi: 10.1016/j.jmr.2005.10.010. [DOI] [PubMed] [Google Scholar]
- 27.Molitor E, Kluczny C, Brotz H, Bierbaum G, Jack R, Sahl HG. Effects of the lantibiotic mersacidin on the morphology of staphylococci. Zentralbl Bakteriol. 1996;284:318–328. doi: 10.1016/s0934-8840(96)80108-3. [DOI] [PubMed] [Google Scholar]
- 28.Salton MRJ. The Bacterial Cell Wall. Elsevier; Amsterdam: 1964. [Google Scholar]
- 29.Kim SJ, Cegelski L, Stueber D, Singh M, Dietrich E, Tanaka KS, Parr TR, Jr, Far AR, Schaefer J. Oritavancin exhibits dual mode of action to inhibit cell-wall biosynthesis in Staphylococcus aureus. J Mol Biol. 2008;377:281–293. doi: 10.1016/j.jmb.2008.01.031. [DOI] [PMC free article] [PubMed] [Google Scholar]
- 30.Kim SJ, Cegelski L, Preobrazhenskaya M, Schaefer J. Structures of Staphylococcus aureus cell-wall complexes with vancomycin, eremomycin, and chloroeremomycin derivatives by 13C{19F} and 15N{19F} rotational-echo double resonance. Biochemistry. 2006;45:5235–5250. doi: 10.1021/bi052660s. [DOI] [PMC free article] [PubMed] [Google Scholar]
- 31.al-Obeid S, Collatz E, Gutmann L. Mechanism of resistance to vancomycin in Enterococcus faecium D366 and Enterococcus faecalis A256. Antimicrob Agents Chemother. 1990;34:252–256. doi: 10.1128/aac.34.2.252. [DOI] [PMC free article] [PubMed] [Google Scholar]
- 32.Gutmann L, Billot-Klein D, al-Obeid S, Klare I, Francoual S, Collatz E, van Heijenoort J. Inducible carboxypeptidase activity in vancomycin-resistant enterococci. Antimicrob Agents Chemother. 1992;36:77–80. doi: 10.1128/aac.36.1.77. [DOI] [PMC free article] [PubMed] [Google Scholar]
- 33.Allen NE, LeTourneau DL, Hobbs JN., Jr The role of hydrophobic side chains as determinants of antibacterial activity of semisynthetic glycopeptide antibiotics. J Antibiot (Tokyo) 1997;50:677–684. doi: 10.7164/antibiotics.50.677. [DOI] [PubMed] [Google Scholar]
- 34.Guillion T, S J. Detection of Weak Heteronuclear Dipolar Coupling by Rotational-Echo Double-Resonance Nuclear Magnetic Resonance. Adv Magn Reson. 1989;13:57–83. [Google Scholar]
- 35.Kim SJ, Matsuoka S, Patti GJ, Schaefer J. Vancomycin derivative with damaged D-Ala-D-Ala binding cleft binds to cross-linked peptidoglycan in the cell wall of Staphylococcus aureus. Biochemistry. 2008;47:3822–3831. doi: 10.1021/bi702232a. [DOI] [PMC free article] [PubMed] [Google Scholar]
- 36.Kim SJ, Schaefer J. Hydrophobic side-chain length determines activity and conformational heterogeneity of a vancomycin derivative bound to the cell wall of Staphylococcus aureus. Biochemistry. 2008;47:10155–10161. doi: 10.1021/bi800838c. [DOI] [PMC free article] [PubMed] [Google Scholar]
- 37.Boneca IG, Huang ZH, Gage DA, Tomasz A. Characterization of Staphylococcus aureus cell wall glycan strands, evidence for a new beta-N-acetylglucosaminidase activity. J Biol Chem. 2000;275:9910–9918. doi: 10.1074/jbc.275.14.9910. [DOI] [PubMed] [Google Scholar]
- 38.de Jonge BL, Gage D, Handwerger S. Peptidoglycan composition of vancomycin-resistant Enterococcus faecium. Microb Drug Resist. 1996;2:225–229. doi: 10.1089/mdr.1996.2.225. [DOI] [PubMed] [Google Scholar]
- 39.Hayhurst EJ, Kailas L, Hobbs JK, Foster SJ. Cell wall peptidoglycan architecture in Bacillus subtilis. Proc Natl Acad Sci U S A. 2008;105:14603–14608. doi: 10.1073/pnas.0804138105. [DOI] [PMC free article] [PubMed] [Google Scholar]
- 40.Schaefer J, McKay RA. Multi-tuned single coil transmission line probe for nuclear magnetic resonance spectrometer. Patent, U. S. 5,861,748 1999
- 41.Steuber D, Mehta AK, Chen Z, Wooley KL, Schaefer J. Local order in polycarbonate glasses by 13C{19F} rotational-echo double-resonance NMR. J Polym Sci Part B: Polym Phys. 2006:2760–2775. [Google Scholar]
Associated Data
This section collects any data citations, data availability statements, or supplementary materials included in this article.


