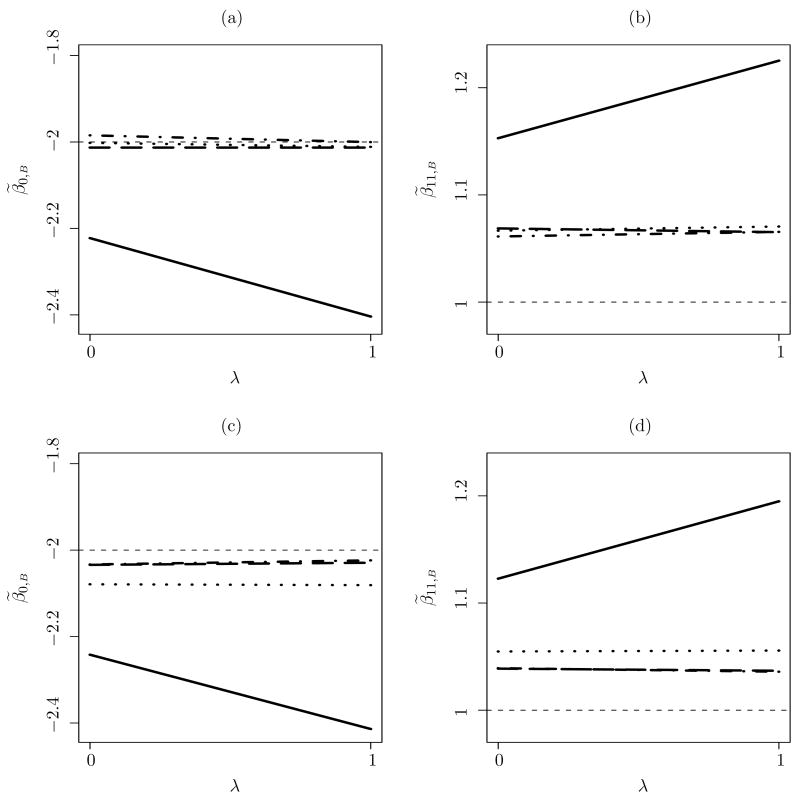
Figure 1.
Plots (a) and (b) are SIMEX plots for the MLEs of the first two elements in each of , and , computed from one simulated data set. Plots (c) and (d) are the average SIMEX plots from 30 Monte Carlo replicates. The line types are, : long dashed; : dash-dotted; : solid; and : dotted. The short dashed lines are the reference lines at the true values, β0 = −2 and β11 = 1. The ranges of the vertical axes in (a) and (b) are set to be one estimated standard deviation of θ̃(n) (0) below and above the average of the four types of estimates at λ = 0.

