

Abstract
Using 27 body measurements, we have identified 13 breed-defining metrics for 109 of 159 domestic dog breeds, most of which are recognized by the American Kennel Club (AKC). The data set included 1,155 dogs at least 1 year old (average 5.4 years), and for 53 breed populations, complete measurement data were collected from at least three males and three females. We demonstrate, first, that AKC breed standards are rigorously adhered to for most domestic breeds with little variation observed within breeds. Second, Rensch’s rule, which describes a scaling among taxa such that sexual dimorphism is greater among larger species if males are the larger sex, with less pronounced differences in male versus female body size in smaller species, is not maintained in domestic dog breeds because the proportional size difference between males and females of small and large breeds is essentially the same. Finally, principal components (PCs) analysis describes both the overall body size (PC1) and the shape (length versus width) of the skeleton (PC2). That the integrity of the data set is sufficiently rich to discern PCs has strong implications for mapping studies, suggesting that individual measurements may not be needed for genetic studies of morphologic traits, particularly in the case of breed-defining traits that are typically under strong selection. Rather, phenotypes derived from data sets such as these, collected at a fraction of the effort and cost, may be used to direct whole-genome association studies aimed at understanding the genetic basis of fixed morphologic phenotypes defining distinct dog breeds.
Introduction
The domestic dog (Canis familiaris) exhibits the greatest morphologic diversity of any mammal (Moody et al. 2006). Variation in size between breeds spans two orders of magnitude with the 1-kg Chihuahua and 100-kg mastiff representing extremes of the continuum. An equally impressive level of variation is apparent when considering conformation. Variation in skeletal and cranial proportions is greater in the single domestic dog species than in all of the other Canidae species combined (Wayne 1986a, b).
Strong selection for specific morphologic features, recent and rapid formation of many breeds coupled with limited numbers of founders, and the presence of so-called “popular sires” whose gene alleles are overrepresented in the modern population support the notion that mutations in a small number of genes of large effect are likely responsible for many breed-defining characteristics (Ostrander and Kruglyak 2000). The fact that many now distinct breeds differing only in minor physical attributes such as the texture or color of the coat share obvious common founders (Parker et al. 2004, 2007) argues further that while each breed is a distinct combination of genotypes, some genotypic combinations will be shared among breeds with similar morphologic features. We can therefore expect to find regions of reduced variability, or “selective sweeps,” and extensive linkage disequilibrium (LD) in the proximity of genes that have been under selection for breed formation (Ostrander and Kruglyak 2000; Pollinger et al. 2005; Sutter et al. 2007). If the same mutation has been fixed independently in breeds sharing a common founder, there will be excess allele or haplotype sharing around genes controlling common features. Indeed, it has been shown that even in a whole-genome association study, a strong statistical signal will emerge at genomic locations harboring causative variant(s) for many breed-defining characteristics (Chase et al. 2002; Karlsson et al. 2007). By extension, if breeds are genetically fixed for genes controlling critical aspects of conformation, individuals who are members of the same breed should exhibit minimum variation in size and shape. This suggests that extensive measurements of individual dogs may not be needed for genetic studies of breed-defining morphologic traits and informs how one can best design such whole-genome association studies in the dog. In testing the idea that skeletal variation within breeds is small, we also obtained an estimate of the degree to which we can measure and classify breeds based solely on a critical set of morphologic measurements defining a so-called “breed stereotype” (Jones et al. 2008).
Materials and methods
Solicitation and collection of body measurements
We used the AKC nomenclature for purebred dogs except that standard, miniature, and toy poodle varieties were treated as separate populations. Following protocols approved by the animal care and use committees of both NHGRI/NIH and Cornell University, purebred dog owners were approached by email, mail, telephone, and in person at dog shows to solicit body measurement of their dogs. Dogs were measured under our supervision at dog shows or directly by owners at home. No requirement was made that the dogs be conformation champions or have champions within their pedigrees, although a majority of the measured dogs have competed in conformation events. There is thus the possibility of some ascertainment bias toward members of the breed population that fulfill the written standard’s requirements for height. To reduce between-owner variation, owners received an illustrated measurement protocol and tape measure. Although we collected measurements of outside ear length and tail length we did not use them in any of the analyses since many owners did not answer whether their dog’s ears were cropped or the tail was docked. To ensure maximum familiarity on the part of participating owners, the vast majority of whom live in the United States, all measurements were collected in inches.
All 27 traits were visually inspected by creating boxplots in R for each of the 53 breeds, with at least three males and three females measured. Approximately 40 of the 31,185 measurements were judged very likely to be measurement errors and, when possible, owners were asked to repeat these measurements.
Analysis
Principal components analysis, boxplotting, and the calculation of most statistical tests were performed in R ver. 2.6.0. Reduced major axis regression was performed with rma.v1.20.jar (Bohonak and van der Linde 2004). To determine which variables provide the most discrimination between breeds, stepwise discriminant function analysis (DFA) was performed in SPSS. Raw traits paired with a left and right side measured were trimmed to a single measure, leaving a set of 19 nonredundant traits. Leave-one-out cross-validation was then performed to determine the success rate of classifying individuals within the a priori defined groups (breeds).
Results
To provide quantitative measures of the skeletal morphologic diversity between and within dog breeds, we have collected a set of 27 body measurements from 1,155 purebred dogs. Height at the withers (shoulder), body length, chest and neck girth, snout length, head width, and the other measurements collected are summarized in Table 1. A dog’s overall size is most commonly assessed by measuring mass and the height at the withers for a standing dog. In fact, for many breeds the written standards that define an ideal specimen include allowable ranges for mass and withers height. Thus, we first asked how well the dogs we have measured conform to the written breed standards.
Table 1.
Morphologic descriptions of 19 discrete body measurements collected from each dog
| Measurement | Description |
|---|---|
| Height at the withers | The linear distance from the ground to the cranial angle of the scapula (withers). Measured when the dog is in an upright, stacked position. |
| Height at base of tail | The linear distance from the ground to the dorsal-most point where the tail meets the body. Measured when the dog is in an upright, stacked position. |
| Head width | The linear distance along the dorsal plane from the left angular process of the mandible to the right angular process of the mandible. |
| Eye width | The linear distance between the punctae lacrimale of the left eye and the punctae lacrimale of the right eye. |
| Snout length | The distance along the skull from the rostral end of the planum nasale to dorsal plane between the punctae lacrimale of the left eye and the punctae lacrimale of the right eye (stop). |
| Head length | The distance along the skull from the stop to the external occipital protuberance. |
| Neck length | The distance along the body from the external occipital protuberance to the dorsal plane of the withers. This is measured along the median plane of the dog. |
| Body length | The distance along the body from the dorsal plane of the withers to the cranial-most point where the tail meets the body. This is measured along the median plane of the dog. |
| Neck girth | The circumference of the neck at the median distance between the external occipital protuberance and the withers. |
| Chest girth | The circumference of the deepest part of the thoracic cavity in a plane with both the sternum and withers. |
| Chest width | The linear distance along the dorsal plane from the greater tubercle of the left humerus to the greater tubercle of the right humerus. |
| Hind foot length (left and right tarsus and pes) | The distance along the ventral side of the hind foot from the distal end of the fourth digit, not including the claw, along the digital and metatarsal pads up to the calcaneal tuberosity (hock). |
| Hind foot circumference (right and left) | The circumference of the hind foot at the median distance between the hock and the metatarsal pad. |
| Lower hind leg length (right and left) | The linear distance from the hock to the patella. This is measured along the lateral aspect of the dog. |
| Upper hind leg length (right and left) | The linear distance from the patella to the dorsal-most point where the tail meets the body. |
| Fore foot length (left and right manus) | The distance along the ventral side of the fore foot from the distal end of the fourth digit, not including the claw, along the digital and metacarpal pads up to the free epiphysis of the accessory carpal bone. |
| Fore foot circumference (right and left) | The circumference of the fore foot at the median distance between the free epiphysis of the accessory carpal bone to the metacarpal pad. |
| Lower fore leg length (right and left) | The linear distance from the free epiphysis of the accessory carpal bone to the olecranon process of the ulna. This is measured along the lateral aspect of the dog. |
| Upper fore leg length (right and left) | The linear distance from the olecranon process of the ulna to the greater tubercle of the humerus. |
Individual values for withers height range from 6.75 in. in a 12-year-old female dachshund to 38.5 in. reported for a 4-year-old male great Dane. Among measured breeds, the Chihuahua has the smallest median value at eight inches (n = 5 dogs), while the great Dane and Irish Wolfhound tie for tallest median withers height at 33 in. (n = 21 and 23, respectively). Thus, we observed a greater than fourfold range in the median withers height among breeds (Fig. 1).
Fig. 1.
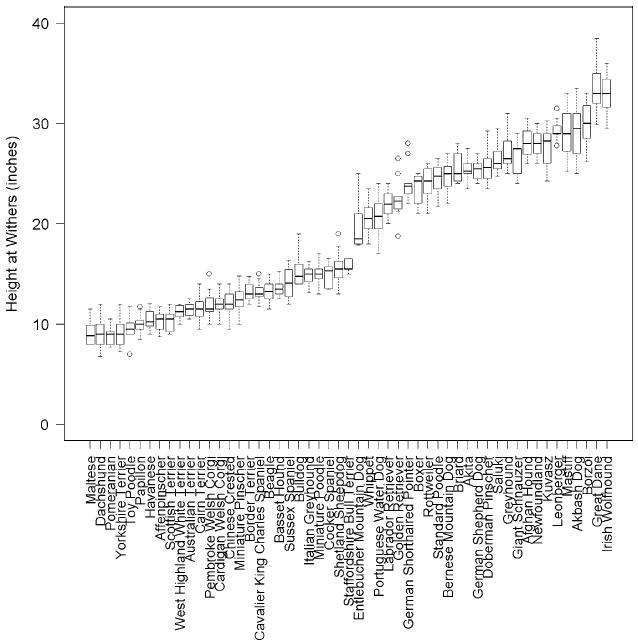
Median withers height for breed populations in which a minimum of three male and three female dogs were measured. The box central bar indicates the median, the box ends delimit the 25th and 75th percentile, and the whiskers delimit the most extreme data point within 1.5 times the interquartile range. Outliers are shown as unfilled circles
To assess conformity to written breed standards, we tabulated the percentage of dogs with measured withers heights that fall within breed guidelines. This was done for the 42 breeds for which the AKC standard specifies guidelines for withers height and for which we had measured at least three males and three females (Table 2). In 24 of the 42 breeds, at least 70% of dogs conform to their respective height standards, and in 38 of the 42 breeds, at least 50% of dogs conform. For the borzoi, great Dane, beagle, and standard poodle, 100% of measured dogs conform to the standard. Thus, the AKC standard is a good proxy for the actual heights of dogs in a population. Some breed standards allow for more height variation than others. For example, in the two breeds with the smallest percentage of conforming dogs, golden retriever and Australian terrier (33 and 44%, respectively), there is only a 1-in. variation in height allowed in the written standard. The proportion of conforming dogs in a breed is significantly positively correlated to the size of the breed’s allowable height range, given as the fraction of total dog height variation (spanning from 6.75 to 38.5 in.) that is allowable in the breed’s written standard (adjusted r2 = 0.27, β = 0.75, p = 0.0002).
Table 2.
AKC breed standards for male and female height at the withers (inches), mean height ± 1 SD for measured dogs, and the proportion of measured dogs that conform to the desired range
| Breed | Male |
Female |
Conf/Meas | Fraction conforming | ||
|---|---|---|---|---|---|---|
| Min–Max | Mean | Min–Max | Mean | |||
| Borzoi | at least 28 | 31.33 ± 1.2 | at least 26 | 28.28 ± 1.6 | 17/17 | 1.00 |
| Great Dane | at least 30 | 34.97 ± 2.4 | at least 28 | 32.32 ± 1.3 | 21/21 | 1.00 |
| Standard Poodle | at least 15 | 25.09 ± 1.2 | at least 15 | 23.64 ± 1.1 | 37/37 | 1.00 |
| Beagle | at most 15 | 13.75 ± 0.4 | at most 15 | 13.02 ± 1.1 | 17/17 | 1.00 |
| Irish Wolfhound | at least 32 | 34.58 ± 0.9 | at least 30 | 31.96 ± 1.4 | 22/23 | 0.96 |
| Basset Hound | 12–15 | 14.04 ± 0.8 | 11–14 | 13.17 ± 0.4 | 11/12 | 0.92 |
| Papillon | 8–11 | 10.22 ± 0.7 | 8–11 | 9.82 ± 0.8 | 39/43 | 0.91 |
| Rottweiler | 24–27 | 25.33 ± 0.5 | 22–25 | 22.85 ± 1.1 | 9/10 | 0.90 |
| Portuguese Water Dog | 20–23 | 21.75 ± 0.4 | 17–21 | 20.02 ± 1.9 | 16/18 | 0.89 |
| Akita | 26–28 | 26.42 ± 0.8 | 24–26 | 24.85 ± 0.7 | 26/30 | 0.87 |
| Leonberger | 28–31.5 | 30.19 ± 1 | 25.5–29.5 | 28.98 ± 0.8 | 13/15 | 0.87 |
| Cardigan Welsh Corgi | 10.5–12.5 | 12.36 ± 0.8 | 10.5–12.5 | 11.34 ± 0.7 | 15/18 | 0.83 |
| Entlebucher Mountain Doga | 17–21 | 21.67 ± 3.1 | 16–20 | 17.96 ± 0.1 | 5/6 | 0.83 |
| Saluki | 23–28 | 27.02 ± 1.3 | N.S. | 25.67 ± 0.8 | 10/12 | 0.83 |
| Chinese Crested | 11–13 | 11.65 ± 1 | 11–13 | 12.29 ± 1 | 28/36 | 0.78 |
| Whippet | 19–22 | 21.36 ± 1.3 | 18–21 | 19.89 ± 1 | 55/72 | 0.76 |
| Havanese | 8.5–11.5 | 11.28 ± 0.9 | 8.5–11.5 | 10.06 ± 0.8 | 12/16 | 0.75 |
| Toy Poodle | at most 10 | 9.92 ± 0.6 | at most 10 | 9.25 ± 1.7 | 6/8 | 0.75 |
| Bernese Mountain Dog | 25–27.5 | 25.36 ± 1.6 | 23–26 | 23.99 ± 1.2 | 14/19 | 0.74 |
| Shetland Sheepdog | 13–16 | 16.31 ± 1 | 13–16 | 15.18 ± 2.1 | 8/11 | 0.73 |
| Pembroke Welsh Corgi | 10–12 | 12.44 ± 1.5 | 10–12 | 11.55 ± 0.9 | 10/14 | 0.71 |
| Sussex Spaniel | 13–15 | 14.92 ± 1.2 | 13–15 | 13.73 ± 1.5 | 6/14 | 0.43 |
| Doberman Pinscher | 26–28 | 27.69 ± 1.4 | 24–26 | 24.79 ± 0.8 | 7/10 | 0.70 |
| Staffordshire Bull Terrier | 14–16 | 15.95 ± 0.5 | 14–16 | 15.6 ± 0.5 | 7/10 | 0.70 |
| Affenpinscher | 9.5–11.5 | 11.19 ± 0.7 | 9.5–11.5 | 10 ± 0.8 | 9/13 | 0.69 |
| Kuvasz | 28–30 | 29.09 ± 0.7 | 26–28 | 25.79 ± 1.5 | 9/13 | 0.69 |
| Mastiff | at least 30 | 31.6 ± 1.1 | at least 27.5 | 27.47 ± 1.3 | 9/13 | 0.69 |
| Cavalier King Charles Spaniel | 12–13 | 13.5 ± 1.1 | 12–13 | 12.9 ± 0.7 | 13/19 | 0.68 |
| Miniature Pinscher | 10–12.5 | 12.72 ± 1 | 10–12.5 | 12.2 ± 1.1 | 27/40 | 0.68 |
| Briard | 23–27 | 26.83 ± 1.2 | 22–25.5 | 25.06 ± 1.3 | 8/12 | 0.67 |
| Giant Schnauzer | 25.5–27.5 | 27.88 ± 0.8 | 23.5–25.5 | 25.58 ± 1.7 | 6/9 | 0.67 |
| Miniature Poodle | 10–15 | 15.56 ± 0.9 | 10–15 | 14.25 ± 0.9 | 8/13 | 0.62 |
| Italian Greyhound | 13–15 | 15.03 ± 0.7 | 13–15 | 14.55 ± 0.8 | 23/38 | 0.61 |
| Akbash Dogb | 30–34 | 31.07 ± 1.5 | 28–32 | 27.36 ± 1.9 | 8/14 | 0.57 |
| German Shepherd Dog | 24–26 | 25.97 ± 0.7 | 22–24 | 24.58 ± 0.8 | 8/14 | 0.57 |
| Labrador Retriever | 22.5–24.5 | 22.94 ± 1 | 21.5–23.5 | 21.56 ± 1.2 | 8/14 | 0.57 |
| Boxer | 23–25 | 23.88 ± 1.9 | 21.5–23.5 | 23.13 ± 1.5 | 4/8 | 0.50 |
| Cocker Spaniel | 14.5–15.5 | 15.73 ± 0.5 | 13.5–14.5 | 13.54 ± 0.1 | 4/8 | 0.50 |
| Afghan Hound | 26–28 | 28.63 ± 1.4 | 24–26 | 26.67 ± 1.2 | 5/11 | 0.45 |
| German Shorthaired Pointer | 23–25 | 26.33 ± 2.1 | 21–23 | 23.17 ± 0.7 | 4/9 | 0.44 |
| Australian Terrier | 10–11 | 11.84 ± 0.6 | 10–11 | 11.06 ± 0.4 | 7/16 | 0.44 |
| Golden Retriever | 23–24 | 24.06 ± 2.1 | 21.5–22.5 | 21.25 ± 1.5 | 3/9 | 0.33 |
Height at the withers taken from the Federation Cynologique Internationale standard
Height at the withers taken from the United Kennel Club standard
N.S. not specified
To assess the other 26 measurements we calculated the coefficient of variation for each measurement for each breed (Supplementary Fig. 1). The median coefficient of variation is smallest for the height at the withers, a measure that all dog breeders are familiar with, and largest for head width. Variation in a measure like head width could indicate a higher than normal error rate or may indicate that high within-breed variation for this trait is well tolerated in breed conformation events.
Sexual size dimorphism is present within the domestic dog species. Males are generally larger than females, as is evident in some of the breed height measurements. For example, male whippets (W = 1048.5, p = 3.0 × 10⁻⁶; Wilcoxon rank sum test), Irish wolfhounds (W = 118, p = 0.0003), and standard poodles (W = 282, p = 0.00024) are all significantly taller than their female counterparts. However, we observed no statistically significant difference in height between male and female miniature pinschers (W = 250.5, p = 0.067) or Yorkshire terriers (W = 56, p = 0.091). We initially hypothesized that Rensch’s rule may account for these results. This allometry rule states that within a clade in which males are the larger sex, the greatest degree of sex size dimorphism is observed in those species with the greatest overall size (Fairbairn 1997). If this rule held for breeds of variable size within the single dog species, there would be an observable size difference between males and females of giant breeds but the size difference between the sexes in toy breeds would be smaller and perhaps negligible. Indeed, the AKC standard for many giant breeds contains language explicitly noting a size difference between males and females (American Kennel Club 1998).
We therefore undertook an examination of size differences between males and females of each breed/population. We expected, based on Rensch’s rule, that size differences would be greatest among the largest breeds (great Dane, Irish wolfhound, mastiff, etc.) and nonexistent among small breeds (Maltese, Yorkshire terrier, papillon). We found, however, that the proportional size difference between males and females was constant across all 53 breeds for which at least three males and three females were measured (Fig. 2). From papillons to great Danes, males are, on average, 109% the height of females. The allometric relationship is quantified with the power function y = αxβ, where x is body size (Fairbairn 1997). Taking the logarithm of both sides makes the β coefficient the slope of a linear regression, with β = 1 indicative of an isometric relationship between y and x (Fairbairn 1997). Using reduced major axis regression, we estimate β = 1.003 (95% CI = 0.976–1.03). Therefore, these data do not support an allometric relationship consistent with Rensch’s rule within dog breeds using withers height as a surrogate for overall body size.
Fig. 2.
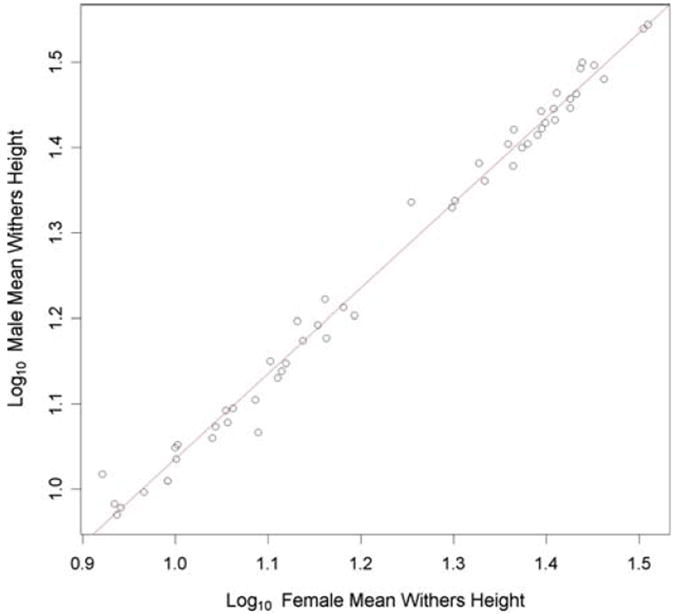
The size proportionality between males and females remains constant across all breed sizes measured. The mean height at the withers was measured for at least three males and three females in each of 53 breeds and a regression slope estimated
We also tested the common folklore that female dogs in many breeds are longer from the dorsal plane of the withers to base of the tail than males of comparable height. Indeed, the AKC standard states that for many breeds, females have longer torsos “in order to make room for puppies” (American Kennel Club 1998). For each dog we calculated the “relative height” = withers height/body length and plotted averages by breed for females versus males (Fig. 3). We observed that for 43 of 53 breeds, females displayed the smaller average value, indicating they indeed often have longer bodies for a given withers height than do males. The data are well fit by a linear relationship, suggesting that the same relative height relationship applies to males and females from breeds that differ in their overall relative height. The least-squares linear regression estimate for the slope is β = 0.897 (95% CI = 0.789–1.05). While the estimate for β is well below 1, the 95% confidence interval (CI) includes β = 1, consistent with the idea that males and females have the same average relative height.
Fig. 3.
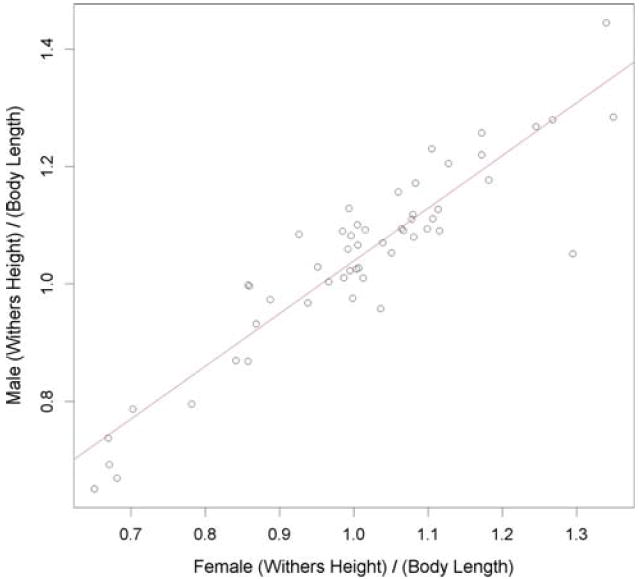
The average ratio of withers height to body length is plotted for each of 53 breeds. A least-squares linear regression line is shown
The measure “relative height” can also be used to identify limb dwarfism by breed. In Fig. 4 the familiar asymmetric dwarfism breeds, including the dachshund, cardigan Welsh corgi, and basset hound, are clearly identified at the far left in the series of boxplots sorted by ascending median value. More importantly, this simple ratio of height to length can quantify the degree of limb dwarfism and show, for example, that West Highland white terriers and Havanese, while shorter than most breeds, do not exhibit the same degree of nonproportional dwarfism that characterizes the corgis and dachshund. Indeed, when considering this measure of relative height, most breeds occupy a well-defined and narrow band of values around unity; 82% of all 1,155 dogs measured have a ratio of withers height to body length between 0.8 and 1.3. Interestingly, at the other end of the spectrum are a small number of proportionately tall breeds of variable size including the Afghan hound, saluki, and miniature pinscher. One might envision a mapping effort to identify loci for extreme limb length by performing a whole-genome association study using this ratio as the phenotype.
Fig. 4.
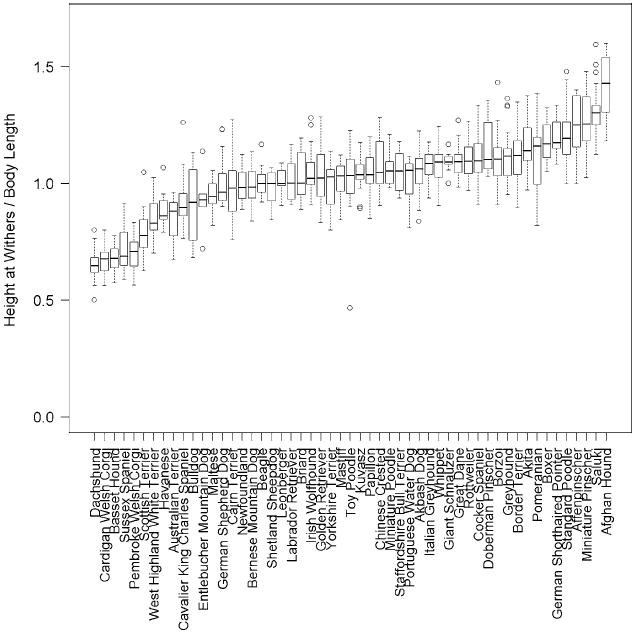
Breed relative height, defined as withers height/body length. The 53 breeds with a minimum of three male and three female samples are plotted. The box central bar indicates the median, the box ends delimit the 25th and 75th percentile, and the whiskers delimit the most extreme data point within 1.5 times the interquartile range. Outliers are shown as unfilled circles
The size and shape of skulls of purebred dogs vary tremendously. Measuring a few distances between bone landmarks cannot capture the rich complexity of skull morphology. However, quantitative measurements like ours can provide starting points for more extensive investigations. We calculated the “relative snout length” = snout length/body length to control for differences in overall size. The brachycephalic bulldog and boxer have the smallest median values, while the Scottish terrier and Afghan hound have the largest values (Supplementary Fig. 2). This ratio can identify similarities that would otherwise be difficult or impossible to quantify if one were limited to simply placing breeds into categories via visual inspection or written descriptions. For example, the diminutive Maltese and the giant mastiff have identical median values for relatively short snouts while the miniature pinscher and giant borzoi have identical values at the high end of observed ratios.
To evaluate potential underlying patterns in the data, we utilized the entire set of 27 trait values at once by performing a principal components analysis (PCA). While the number of principal components (PCs) to retain in a given analysis is not a resolved issue (Peres-Neto et al. 2004), we used the criterion that relevant PCs should explain greater than 1/n proportion of the variance (where n is the number of raw traits). Often, measured morphologic traits are correlated with one another (Chase et al. 2002). PCA utilizes matrix algebra on the raw traits to reparameterize the data and provide a set of new trait values, the PCs. Each PC is independent of (i.e., orthogonal to) the others. The vector of the first principal component (PC1) is chosen such that it explains the maximum variance possible. The second component is chosen orthogonal to the first, and again along a vector such that variance is maximized. Each successive component of n total explains a smaller proportion of the variance. Here, PC1 explains 87.2% of the variance and the second PC explains 4.0%. Components 3 through 27 each explain less than 1.4% of the variance and were not considered further (see scree plot; Supplementary Fig. 3).
Factor loadings from each of the measurements indicate the magnitude and direction that each contributes to the overall value of a PC. The PC1 factor loadings for every measurement have the same sign. As height at the withers, body length, snout length, chest girth, and foot circumference increase, for example, PC1 increases as well (Fig. 5a). Thus, we interpret PC1 as a measure of the overall body size, or scaling, of the dog. Because we chose measurements that primarily would capture variation in the skeleton, the PC is primarily quantifying skeletal size. Some measures such as chest girth, body length, height at the base of the tail, and withers height have large-magnitude loadings compared to others such as head and eye width. Nevertheless, PC1 provides a quantitative measure of skeletal size that incorporates “size” information available from all 27 measurements (Fig. 6). For all breeds, the interquartile range for PC1 variation within the breed is a small fraction of the total variation across all dogs.
Fig. 5.
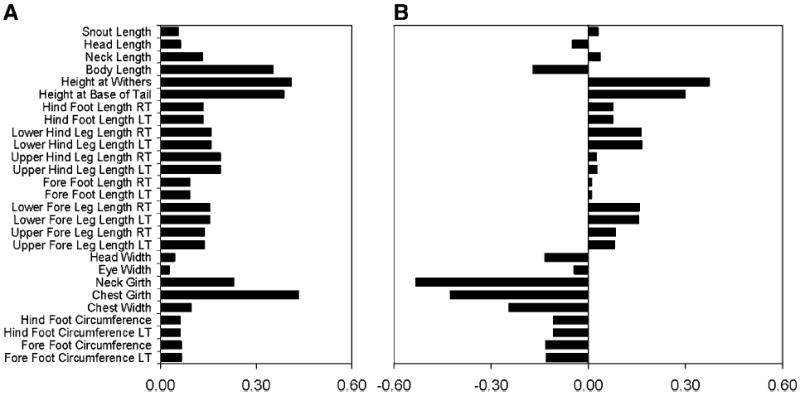
Factor loadings for principal component analysis on the full set of 1,155 measured dogs. a PC1 (first principal component) factor loadings all have the same sign. b PC2 factor loadings for limb lengths load oppositely (have different signs) from loadings for measured traits relating to body width and girth
Fig. 6.
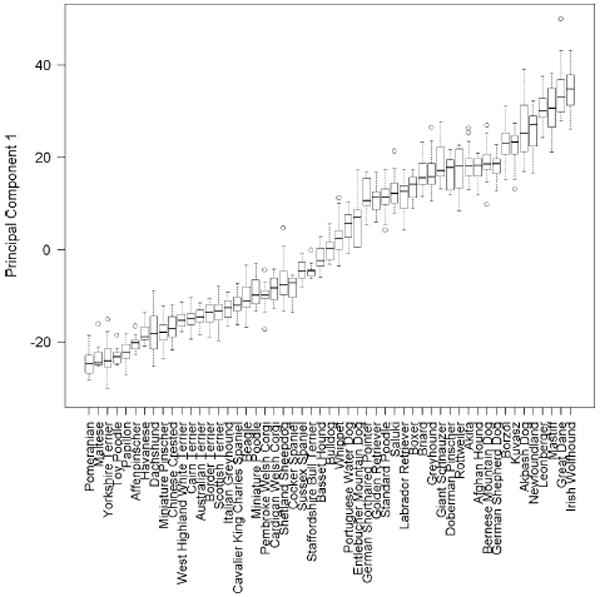
Boxplots of each breed’s distribution for the first principal component obtained from PCA. The 53 breeds with a minimum three male and three female samples are plotted. The box central bar indicates the median, the box ends delimit the 25th and 75th percentile, and the whiskers delimit the most extreme data point within 1.5 times the interquartile range. Outliers are shown as unfilled circles
One practical value of PCA is that it is based on measures of numerous traits and thus may be less sensitive to errors in measurement of individual traits. In addition, PCs may be better able to quantify complex traits like body size than single measurements can. For example, the most commonly used measure for body size in the dog is withers height, which is very sensitive to limb dwarfism. This is illustrated in our data set. The dachshund is the eighth smallest of 53 breeds according to rankings of median PC1 values by breed (Fig. 6) but is ranked second shortest for withers height, between Maltese and Pomeranian (Fig. 1).
While PC2 explains only 4.3% of the variance, far less than PC1, it nevertheless has a clearly interpretable biological meaning based on inspection of the trait factor loading pattern. While PC1 captures overall skeletal size, PC2 quantifies variation in the thickness of bones and the relative width across the body (Fig. 5b). Factor loadings for limb lengths are oppositely signed to those for foot circumference, chest and head width, and chest and neck girth. Thus, dogs with high PC2 values have long thin limb bones and a narrow chest, neck, and head. This description fits the sighthound body type and, in fact, six of the seven breeds with highest median PC2 values are sighthounds: the saluki, Afghan hound, borzoi, greyhound, Italian greyhound, and whippet (Fig. 7). Furthermore, the fact that both the giant borzoi and tiny papillon breeds share this high-PC2 morphology (ranked third and ninth highest PC2, respectively) illustrates the degree to which PC2 is independent of variation in skeletal size captured by PC1. Moreover, although the toy, miniature, and standard poodles vary considerably in size (PC1), body measurements demonstrate that they share a conserved body shape quantified by relatively high values of PC2 (Fig. 7).
Fig. 7.
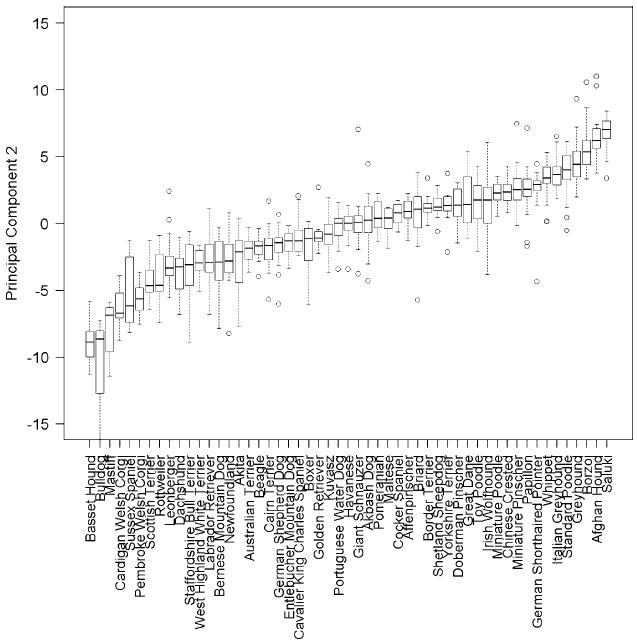
Boxplots of each breed’s distribution of the second principal component obtained from PCA. The 53 breeds with a minimum three male and three female measured dogs are shown. The box central bar indicates the median, the box ends delimit the 25th and 75th percentile, and the whiskers delimit the most extreme data point within 1.5 times the interquartile range. Outliers are shown as unfilled circles
At the other end of the PC2 spectrum are body shapes with short thick limb bones and broad chests, heads, and necks. Breeds at this end of the spectrum such as the bulldog, mastiff, Rottweiler, Leonberger, and Staffordshire bull terrier typify the heavy “molosser” body type. However, the boxer and great Dane, sometimes also considered to be molosser-type breeds, have midrange and high PC2 values, respectively.
Interestingly, all the achondroplastic breeds in the data set have low PC2 values; the basset hound, Cardigan and Pembroke Welsh corgis, Sussex spaniel, and dachshund are all in the lowest 10 of 53 ranked breeds for median PC2. We therefore assessed whether the gross morphologic changes coincident with limb dwarfism might impact the factor loading patterns associated with PC2 generally. To test whether PC2 was independently robust or instead dependent on the presence of these breeds in the data set, we repeated the PCA in a data set that omitted the five aforementioned breeds as well as the Dandie Dinmont terrier. This breed is not shown in the figures because measurements from only two females and one male were collected, but its median ratio of withers height to body length is the smallest in the data set. In the repeated PCA, the ranks for the nonachondroplastic breeds with low PC2 values are essentially unchanged: the bulldog, mastiff, Scottish terrier, and Rottweiler still have the lowest median PC2 values (Supplementary Fig. 4). In fact, between the two analyses there is a very high correlation for each individual dog’s scores for both PC1 (r2 = 0.99) and PC2 (r2 = 0.98). Furthermore, the factor loading patterns between the two analyses are nearly identical for both PC1 (r2 = 0.99) and PC2 (r2 = 0.96). Thus, the skeletal shape quantified by our PC2 is not driven merely by the gross morphologic change of limb dwarfism.
The data examined thus far define a set of body measurements that quantitatively describe dog skeletal or overall body size and at the same time provide a measure of skeletal thickness. We next asked whether all raw traits were necessary to obtain an accurate assessment of size and thickness, given that many of the 27 measurements simply discriminate between the left and right body axis and many are focused on the limb bones. The potential redundancy of the measurements was assessed by performing PCA on a reduced set of trait data and with a discriminant function analysis (DFA).
To create a subset of the trait data we reduced the nine measurements of forelimbs to just two measurements, the height at the withers and the circumference of the right fore foot. We similarly reduced the hindlimb traits to height at the base of the tail and the right foot circumference. Together with the measurements of body length and the head and neck, a set of 13 measurements were defined. We ran PCA and obtained individual dog PC scores highly correlated to those from the full-trait PCA (PC1, r2 = 0.99; PC2, r2 = 0.97). We also performed DFA to test the power of reduced data sets to provide quantitative measures of skeletal size and thickness. To determine which measurements provide the most discrimination between breeds, stepwise discriminant function analysis was performed. Eight pairs of traits measure the left vs. right side of the body. These were trimmed to single traits to form a reduced set of 19 variables. Leave-one-out cross-validation was then performed to determine the success rate of classifying individuals within the a priori defined breeds.
We first ran the DFA with all 1,155 dogs from 109 breeds. The first 14 functions were found to be significant, explaining 99% of the variance. The rate of successfully classifying an individual dog to its breed or population was 62.5%. However, we observed a significant correlation between classification rate and breed sample size (p < 0.001, Pearson’s correlation). Therefore, we ran DFA again and included only dogs from breeds in which at least three males and three females had been measured. In this latter case, 72.4% of dogs were classified to the correct breed (Supplementary Fig. 5).
The stepwise introduction of variables into a DFA is done by initially selecting the variable most correlated with the variation between the groups; then after removing the variance from the model, the second-most correlated variable is then selected, and so on. To determine the reduced number of variables with which we could still classify groups, we plotted classification rate against the stepwise introduction of traits to determine the number of traits at which the classification rate levels off. The stepwise introduction of seven variables reaches a classification rate of 68.2%, with a minor increase explained by the introduction of additional variables Supplementary Fig. 6). In order of introduction to the test, these variables are height at withers, neck girth, snout length, fore foot circumference, body length, height at base of the tail, and chest girth.
In the initial DFA, in which 19 variables were analyzed, height at the withers was found to be the trait with the largest contribution to function 1 in both the full and reduced data set [0.62 and 0.73 standardized discriminant function coefficient (SDFC), respectively]. Neck girth was the top trait that contributed to function 2 (0.53 and 0.49 SDFC), with fore foot circumference having a slightly smaller but still positive contribution (0.40 and 0.39 SDFC). Interestingly, height at the withers had a negative contribution to function 2 (-0.57 and -0.59 SDFC). Snout length was the primary contributor to function 3 (0.98 and 1.00 SDFC). Neck girth (0.45 and 0.60) and body length (0.59 and 0.55) had the largest positive contributions to function 4.
Discussion
AKC-sanctioned conformation events, which take place frequently throughout the country, are used to constantly monitor the breeding stock of each of the AKC’s 157 recognized breeds. Each dog is judged by how well it conforms to the published breed standards of body size and shape. Individuals who fall too far outside the standard are disqualified and conformation winners are rewarded and highly sought after for subsequent breeding, thereby propagating the standard for each breed. Some breed standards allow for a large range of variation in certain features such as skeletal size while others maintain a narrow range. The question then arises: how much variation is present within breeds, specifically in those that have less strict requirements compared to those with more strict requirements? We observe both that dogs fulfill their breed standard requirements for height at a high rate and that dogs within a pure breed occupy just a narrow portion of the total range of sizes seen in the domestic dog species in total. Furthermore, what body measurements reproducibly define the skeletal size and shape of each breed? Finally, how much variation is present between males and females of a given breed? In this article we sought to answer these questions, thus setting the stage for how researchers with an interest in identifying genes that contribute to morphologic traits, such as those controlling leg growth, body size, and skull shape, should design the underlying whole-genome association studies.
We compared measured heights at the withers for 771 of the 1,155 dogs for which their breed AKC standard includes a requirement for height. In these 42 breeds we found a generally high rate of conformity. Thus, it appears that the established AKC standards represent accurate approximations to the actual values observed in each breed population. When body measures are not available for individual dogs of a known breed, as is often the case, investigators can now assign a breed average body size or skeletal thickness value as a proxy. We utilized such an approach with breed average mass when fine-mapping the first body-size gene identified in the dog, insulin-like growth factor 1 (Sutter et al. 2007). In that case the locus was initially mapped in a single breed, the Portuguese water dog (PWD). Single nucleotide polymorphism (SNP) genotypes assayed in multiple dogs from each of 14 small and 9 giant breeds were then used to refine the region of interest to a single gene. It should be noted that the difference in body mass between large and small breeds is 40-fold so it is perhaps not surprising that the approach works; the genes being sought were those controlling gross effects of body size. Every Pekingese is significantly smaller than every Irish wolfhound; every Pomeranian is significantly smaller than every Saint Bernard. The challenge arises when seeking to identify genes controlling traits that differ more subtly between breeds, or for which breed-specific measurements are lacking, such as those associated with snout, head shape, relative height, or limb bone thickness. For example, from the AKC written standard of the Scottish terrier (American Kennel Club 1998), one would correctly characterize the breed as having a long snout relative to body length: “The Scottish Terrier is a small, compact, short-legged, sturdily-built dog of good bone and substance. His head is long in proportion to his size.” But by actually measuring a sample of dogs, we can quantify the degree of snout elongation and identify this breed as having the highest median ratio of snout length to body length among some 50 breeds.
A similar overall conclusion was achieved by Jones et al. (2008), who in an analysis of 2,801 dogs from 147 breeds with 1,536 SNPs was able to recapitulate our initial IGF1 mapping results (Sutter et al. 2007) as well as identify other putative loci for body size with plausible and interesting candidate genes, including SMAD2 and HMGA2. Although no quantitative measures were collected from individual dogs (Jones et al. 2008) to provide data comparable to this present report, the fact that our IGF1 result is replicated, and obvious candidate genes are implicated, despite the limited marker density argues that breed stereotypes would be a suitable surrogate for breed median values obtained by measuring individual dogs.
In this article we refine existing thinking and define a key set of measurements that can be used to define a “stereotype” for each breed. While we have analyzed a set of 27 measurements, there are clear redundancies. PCA on a reduced set of 13 measurements provides essentially identical results. This key set of measurements not only obviates the expensive and time-consuming task of collecting individual measurements on hundreds of dogs in preparation for any mapping study, but the data itself can be used directly in place of individual measurements on large numbers of dogs in whole-genome association studies aimed at understanding the genetic control of fine features in the dog.
Perhaps more importantly, defining the above functions highlights the traits that have undergone strong selection during breed creation and are thus most likely to be fixed and may be controlled by a small number of mappable genes. We have shown that simple metrics such as the ratio of withers height to body length and snout length to body length are able to quantify robust differences in shape between purebred populations. We have quantified degree of limb dwarfism among chondrodysplastic breeds and, at the other end of the spectrum, identified a set of breeds that are disproportionally long-legged. We anticipate that when dogs from many additional breeds are measured, it will be possible to identify more breeds fixed for extremes of these ratios.
Using PCA we have identified PCs for overall skeletal size and skeletal thickness. Our PC1 provides a measure for the complex trait “body size.” Body mass has been used successfully as a proxy for size but they are distinct traits. In addition, while the skeletal size of an adult changes little over time, the mass can and does change. PC1 incorporates size information from a large set of measurements and thus should provide a more robust estimate for size than does a single measurement such as withers height which may be confounded by gross morphologic changes like chondrodysplasia. Nevertheless, within a single breed in which all or none of the dogs are chondrodysplastic, a single measure such as withers height should provide a reasonable estimate for overall body size.
Our PC2 identifies variation in skeletal thickness and limb length and quantifies a dog’s variation between the molosser and sighthound skeletal types. We find that each breed occupies just a narrow portion of this spectrum. Our PC2 quantifies skeletal thickness and provides a more refined trait measure than simply categorizing breeds as molosser or sighthound. For example, while the standard poodle is not typically identified as a sighthound, we find the breed has an extremely high median PC2 value just like many sighthound breeds. Again, although the boxer breed is typically categorized as a molosser, the dogs we measured have a median PC2 that is midrange. Using a comprehensive set of nearly 100 bone length and width traits derived from radiographs of Portuguese water dogs, Chase et al. (2002) identified essentially this same axis of variation within a single breed. We hypothesize that it is present within every purebred population. Additional body measurements from dozens of dogs of the same breed will be necessary to address this question.
Although purebred dog populations were not formally genetically isolated until a century ago, the basic morphologic types displayed by modern purebred dogs are ancient; both the sighthound and molosser body types are depicted in ancient art and described in writing from at least 3,000 years ago (Brewer et al. 2001). Thus, it is plausible that genetic mutations contributing to skeletal shape variation in the dog are quite old and are likely to be shared among many or all of today’s modern breeds. Additional measurements, particularly from geographically dispersed breeds not recognized by the AKC, may potentially identify additional basic body types within the dog species.
In the course of this study we also chose to investigate the predicted differences in body size between males and females. Chase et al. (2005) had reported earlier that an as-yet undefined locus on the X chromosome, in close proximity to the CHM gene, interacted with IGF1 to affect body size in female versus male Portuguese water dogs, which reportedly differ in size by about 15%. This prompted us to examine gender pairings of small and large breeds to determine if Rensch’s rule held across purebred dogs. That is, was there a greater level of variance between sexes with membership in large breeds than in small, as there is across many bird and mammal orders, including, for example, the primates, pinnipedia, proboscidea, and artiodactyla (Fairbairn 1997). We found no evidence for subscription to Rensch’s rule in 53 breeds examined, nor did we find statistically significant data that female dogs of any one breed are “longer” than males to account for their pup-bearing capacity. This is, perhaps, not surprising. It is likely that selected breeding programs such as that associated with the PWD will generate breeds that are the exceptions. The PWD is unique in that an almost threefold difference is observed in body mass among registered members of the breed (Lark et al. 2006). This is one of the greatest, if not the greatest, allowances made for variation within a single breed, having made the breed ideal for trait mapping. It is therefore plausible that these allowances created a breed in which male and female body sizes are differentially regulated in a way that may not be recapitulated between breeds.
The measurements reported here are sufficiently robust that they can be used to classify individuals into their breed category with moderately high accuracy. Specifically, based on 19 body measurements (see Supplementary Fig. 6), we can correctly assign an individual to breed category 72.4% of the time using discriminant function analysis. When the number was reduced to just the seven measurements best aligned to total variation between breeds, we still had a success rate of 68.2%. The first discriminant function accounts for overall size differences between breeds. The second function discriminates between neck girth and foot circumference versus height at the withers. The third and fourth both discriminate snout length, neck girth, and body length versus height at the base of the tail.
As the size of our data set increases in both sample depth and breed coverage, we expect that we will refine all of these results even more, thus laying the groundwork for eventual identification of the genes that contribute to the diverse and ancient skeletal variations in size and shape that have been largely fixed within purebred dog populations.
Supplementary Material
Acknowledgments
We thank the hundreds of dog owners who collected measurements from their dogs or allowed us to collect measurements. We thank Barbara Hoopes for helpful discussion and Sean Davis for advice on R. We acknowledge the Intramural Program of the National Institutes of Health, the AKC Canine Health Foundation, and the Cornell College of Veterinary Medicine for their support.
Footnotes
Electronic supplementary material The online version of this article (doi:10.1007/s00335-008-9153-6) contains supplementary material, which is available to authorized users.
References
- American Kennel Club. The complete dog book. 19. Howell Book House; New York: 1998. [Google Scholar]
- Bohonak AJ, van der Linde K. RMA: software for reduced major axis regression, Java version. 2004 http://www.bio.sdsu.edu/pub/andy/RMA.html.
- Brewer D, Clark T, Phillips A. Dogs in antiquity: anubis to cerberus, the origins of the domestic dog. Aris and Phillips; Warminster: 2001. [Google Scholar]
- Chase K, Carrier DR, Adler FR, Jarvik T, Ostrander EA, et al. Genetic basis for systems of skeletal quantitative traits: Principal component analysis of the canid skeleton. Proc Natl Acad Sci USA. 2002;99:9930–9935. doi: 10.1073/pnas.152333099. [DOI] [PMC free article] [PubMed] [Google Scholar]
- Chase K, Carrier DR, Adler FR, Ostrander EA, Lark KG. Interaction between the X chromosome and an autosome regulates size sexual dimorphism in Portuguese water dogs. Genome Res. 2005;15:1820–1824. doi: 10.1101/gr.3712705. [DOI] [PMC free article] [PubMed] [Google Scholar]
- Fairbairn DJ. Allometry for sexual size dimorphism: pattern and process in the coevolution of body size in males and females. Annu Rev Ecol Syst. 1997;28:659–687. [Google Scholar]
- Jones P, Chase K, Martin A, Davern P, Ostrander EA, et al. Single-nucleotide-polymorphism-based association mapping of dog stereotypes. Genetics. 2008;179:1033–1044. doi: 10.1534/genetics.108.087866. [DOI] [PMC free article] [PubMed] [Google Scholar]
- Karlsson EK, Baranowska I, Wade CM, Salmon Hillbertz NH, Zody MC, et al. Efficient mapping of mendelian traits in dogs through genome-wide association. Nat Genet. 2007;39:1321–1328. doi: 10.1038/ng.2007.10. [DOI] [PubMed] [Google Scholar]
- Lark KG, Chase K, Carrier DR, Adler FR. Genetic analysis of the canid skeleton: morphological loci in the Portuguese water dog population. In: Ostrander UGEA, Lindblad-Toh K, editors. The dog and its genome. Cold Spring Harbor Laboratory Press; Cold Spring Harbor, NY: 2006. [Google Scholar]
- Moody JA, Clark LA, Murphy KE. Canine history and breed clubs. In: Ostrander UGEA, Lindblad-Toh K, editors. The dog and its genome. Cold Spring Harbor Laboratory Press; Cold Spring Harbor, NY: 2006. [Google Scholar]
- Ostrander EA, Kruglyak L. Unleashing the canine genome. Genome Res. 2000;10:1271–1274. doi: 10.1101/gr.155900. [DOI] [PubMed] [Google Scholar]
- Parker HG, Kim LV, Sutter NB, Carlson S, Lorentzen TD, et al. Genetic structure of the purebred domestic dog. Science. 2004;304:1160–1164. doi: 10.1126/science.1097406. [DOI] [PubMed] [Google Scholar]
- Parker H, Kukekova A, Akey D, Goldstein Ol, Kirkness E, et al. Breed relationships facilitate fine mapping studies: a 7.8 Kb deletion cosegregates with collie eye anomaly across multiple dog breeds. Genome Res. 2007;17:1562–1571. doi: 10.1101/gr.6772807. [DOI] [PMC free article] [PubMed] [Google Scholar]
- Peres-Neto PR, Jackson DA, Somers KM. How many principal components? stopping rules for determining the number of non-trivial axes revisited. Comput Stat Data Anal. 2004;49:974–997. [Google Scholar]
- Pollinger JP, Bustamante CD, Fledel-Alon A, Schmutz S, Gray MM, et al. Selective sweep mapping of genes with large phenotypic effects. Genome Res. 2005;15:1809–1819. doi: 10.1101/gr.4374505. [DOI] [PMC free article] [PubMed] [Google Scholar]
- Sutter NB, Bustamante CD, Chase K, Gray MM, Zhao K, et al. A single IGF1 allele is a major determinant of small size in dogs. Science. 2007;316:112–115. doi: 10.1126/science.1137045. [DOI] [PMC free article] [PubMed] [Google Scholar]
- Wayne RK. Cranial morphology of domestic and wild canids: the influence of development on morphological change. Evolution. 1986a;40:243–261. doi: 10.1111/j.1558-5646.1986.tb00467.x. [DOI] [PubMed] [Google Scholar]
- Wayne RK. Limb morphology of domestic and wild canids: the influence of development on morphologic change. J Morphol. 1986b;187:301–319. doi: 10.1002/jmor.1051870304. [DOI] [PubMed] [Google Scholar]
Associated Data
This section collects any data citations, data availability statements, or supplementary materials included in this article.